Transcription
Final draft submitted to the International Journal of Ventilation 2006A Comparison of CFD and Full-scale Measurement for Analysisof Natural VentilationT Yang1, NG Wright1, DW Etheridge2 and AD Quinn31School of Civil Engineering, University of Nottingham, University Park, Nottingham,NG7 2RD, UK2School of the Built Environment, University of Nottingham, University Park,Nottingham, NG7 2RD, UK3School of Engineering, University of Birmingham, Edgbaston, BirminghamB15 2TT, UKAbstractCFD modelling techniques have been used to simulate the coupled external and internal flow in a cubic buildingwith two dominant openings. CFD predictions of the time-averaged cross ventilation flow rates have been validatedagainst full-scale experimental data under various weather conditions in England. RANS model predictions provedreliable when wind directions were near normal to the vent openings. However, when the fluctuating ventilationrate exceeded the mean flow, RANS models were incapable of predicting the total ventilation rate. Improvedresults are expected by applying more sophisticated turbulence models, such as LES or weighted quasi-steadyapproximations.Key words: Natural ventilation, CFD, envelope flow theory, wind, buoyancy, full-scale experiment, comparisons1. IntroductionThe successful application of natural ventilationtechniques provides good indoor air quality andthermal comfort for the occupants whilst alsoreducing sick building syndrome (SBS). As well asimproving the productivity of occupants, it can alsosave energy and reduce CO2 emissions. In suchsystems the natural variations in wind and thermalbuoyancy forces continuously change the ventilationflow into a building which must be reflected inengineering practice whilst balancing demands for therapid turnaround of optimum design solutions. Whenevaluating ventilation performance, ComputationalFluid Dynamics (CFD) simulations can haveadvantages over other theoretical models ated buildings within a complex builtenvironment. CFD can provide detailed informationabout indoor flow patterns, temperature, airmovement, indoor pollutants and local draughtdistribution, etc.CFD techniques in natural ventilation studies haveoften been applied by modelling external flow aroundbuildings and indoor thermal comfort simulationseparately [1, 2]. However, this separation may leadto errors as ventilation openings will alter the externalflow pattern and imposing correct boundaryconditions for detailed indoor flow simulations can bea difficult engineering judgement in design practice,especially with complex surrounding obstructions.Advances in CFD and increased computer power nowmean that with careful application the simulation ofcombined indoor and outdoor airflows is becomingfeasible.Recent simulations of flow through large openingsinclude those in wind tunnel models [3]; in a fullscale building placed in a wind tunnel [4] and in afull-scale building located in an open country site [5].The differences between wind tunnel data and fieldmeasurements have been highlighted in thecomparison study of flows around a cubic building[6]. Wind tunnel scaling effects introduced bycombined wind and buoyancy forces may havesignificant effects on ventilation through both large1
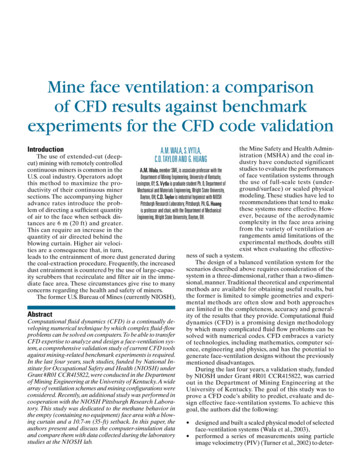
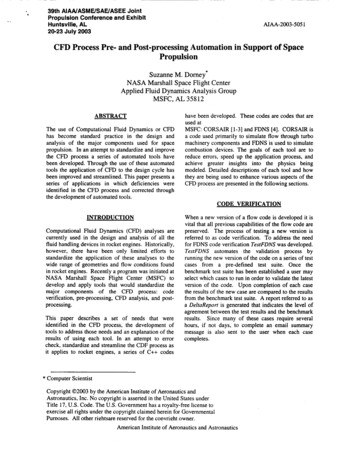
Final draft submitted to the International Journal of Ventilation 2006and small openings. There is little parallel CFD,wind tunnel and full-scale testing data available.The key objective of the work presented here was toevaluate the effectiveness with which CFD cancapture the coupled external and internal flow fieldsunder natural wind and buoyancy forces. Relativelyfew experimental studies have been undertaken forcross ventilation in a full-scale cube with smallopenings in natural environment. The field datacollected and reported here contribute to the smalldatabase of information on generic building formsand is valuable for CFD model validations.Comparisons of CFD simulations, envelope flowtheories and experimental measurements for theassessment of mean ventilation rates of a 6m cube arepresented.The numerical methodology of the CFD code isexplained with regard to issues related to thecomputational domain, boundary conditions and gridsensitivity studies in Section 2, followed by a briefdescription of theoretical envelope flow models inSection 3. Next, in Section 4, the experimentalmethodology and procedures are summarised.Section 5 presents CFD simulation results againstfull-scale experimental data in terms of the meanventilation rates. Finally, discussion and conclusionsare given in Sections 6 and 7.A cubic building represents a generic bluff body. Thestudy of turbulent flow around it can enhance theunderstanding of the complex flow physics and alsoeliminates the influence of the geometric parameters(i.e. building shape, aspect ratio and roof pitch) on theflow pattern and corresponding pressure distributions[7, 8]. Naturally ventilated buildings are normallycategorized as either isolated or connected spaces.An isolated cube with two simple purpose-providedventilation openings can well represent the simplestform for design practice. Therefore, in order to carryout the field studies for cross ventilation in buildingsand bypass the weakness of inaccurate CFDpredictions of the flow reattachment on the roof [9,10, 11] by placing the openings on the side walls notthe roof, the test building was chosen as a full-scale6m cube with two rectangular openings in oppositewalls (see Figure 1). Further to the wind tunnelstudies of Carey and Etheridge [12], the two openingsare designed to be identical, each with a size of 0.35m 0.25 m; therefore the ratio of the opening area towall area is 0.24%. The openings are located alongthe cube centreline, 1m above the ground and 1mbelow the roof respectively. The wind direction isdefined in Figure 2, the 0o indicates the direction ofthe wind blowing perpendicularly to the cube surfacethrough the lower level ventilation opening.2. CFD simulationCFD solutions are obtained with CFX5 (version5.5.1), which is a general-purpose, unstructured-gridCFD code [13]. CFX5 uses a finite element basedfinite volume method to model the equations for theconservation of mass, momentum and energy in termsof the dependent variables and pressure in theirReynolds time-averaged form. Turbulent effects aretaken account by Reynolds-averaged Navier-Stokes(RANS) turbulence models. The solution variablesare discretised on a co-located grid with a secondorder fully conservative vertex based scheme. Theresulting equation system is solved with a fullycoupled Algebraic Multi-Grid (AMG) solver [14].In the present study the standard k-İ and RNG k-İturbulence models are applied. Recently Cheng et al.[15] compared the performance of LES with thestandard k-İ model for a fully developed turbulentflow over a matrix of cubes. Based on the detailedcomparisons between the CFD predictions and thecorresponding wind tunnel experimental data, theauthors concluded that both LES and standard k-İmodel were able to predict the main characteristics ofthe mean flow in the array of cubes reasonably well.Both standard k-İ and RNG k-İ models in CFX5 areused in combination with a scalable wall function[13]. With a built-in lower limit for y (the nondimensional wall distance), the scalable near walltreatment ensures that the wall function is appliedonly in the log-law region, which allows forconsistent grid refinement near the wall. Sensitivitystudies (detailed in [16, 17]) have been carried out inline with best practice guidelines for CFDapplications [18, 19].2.1 Computational domain and meshThe computational domain size was set as 5H(H building height) upstream and 10H downstream,5H away from each side of the cube and 5H abovethe cube. In order to prevent any distortions of the2
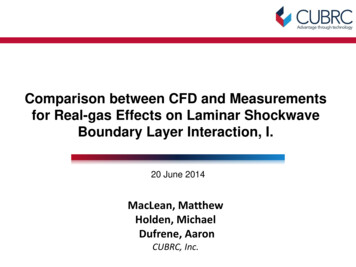
Final draft submitted to the International Journal of Ventilation 2006inlet velocity profile and the full development ofturbulent flow, domain dimensions should coversufficient regions around the building [20]. Thedomain size independency has been testedsatisfactorily in previous studies by Easom [21].An unstructured mesh consisting of approximately 1million tetrahedral and prismatic cells was used forthe simulations. Cells were uniformly distributedwithin the building space, and refined at ventilationopenings, on cube surfaces and building edges. Anillustration of the unstructured mesh is shown inFigure 3. Grid sensitivity tests are explained inSection 2.3.2.2 Boundary conditionsThe boundary conditions for steady state solutions ofthe wind effect cases are listed in Table 1.Based on the results of Richards and Hoxey [22] theincoming wind profile is expressed as:u*U ( z) u* k ε κln ( z / z 0 )κU refln (z ref z 0 )u*2Cμu*3κ (z z0 )(1)(2)(3)(4)wherezref reference height (6m)Uref reference wind speed at reference height ground roughness heightz0Cμ 0.09 (the model constant)Ʉ 0.41 (the von Karman constant)2.3 Grid dependency testsIn order to assess the accuracy of different mesh sizesand capture detailed flow features through theopenings, three types of meshes were used and namedaccording to the resolution on the cube surface (theratio of the cube height to the length scale of themesh element). These settings are listed in Table 2.The convergence criterion used on the three grids wasthe root-mean-square (RMS) of normalised residualfor all variables to be less than 1 10-4. Using thestandard k-İ turbulence model, the pressurecoefficient (Cp) distributions along the verticalcentreline of the cube differed negligibly for thesegrids, except for a maximum difference of 0.07 whichoccurred on the leeward wall halfway toward theground. At the two tapping points 0.5 m away fromthe centre of each opening along the verticalcentreline (see Figure 1), on the fine grid (Grid40) theCp value had a 3% (or 5%) difference from the othertwo grids.All three grids (Grid15, Grid20 & Grid40) were usedto obtain solutions using the 2nd order discretisationscheme with a convergence criterion of two moreorders of magnitude than the original solution, i.e.from the order of 10-4(RMS) to 10-6(RMS).Comparison of the resulting quantities, such as thearea-weighted mean speed and the mass flow ratethrough ventilation opening, showed that theconvergence differences affected these three solutionsat the level of less than 5% (mean speed) or 1% (massflow rate). Therefore, in the case of obtaining themean flow rate through opening by integration ofvelocity components, the solution on Grid40 atconvergence level 10-6 (RMS) is required. In othercases concerning only the pressure distributionaround the opening, the result on Grid15 at level 10-4(RMS) is adequate.Solutions with the RNG k-İ turbulence model havealso been investigated. Converged results with the2nd order discretisation scheme were achieved at theorder of 10-4 (RMS). The RNG k-İ model results onthe three grids have also compared to the referencecase by the standard the k-İ model (i.e. results onGrid40 at 10-6 level). On Grid 20 and Grid40, therewas an increase of approximately 5% in the meanspeed predicted through the lower opening comparedwith reference case. Similarly there was an increaseof 13% for the higher opening. A smaller than 5%increase of the mean speed was predicted on Grid15.When the complexity of the turbulence modelincreases, numerical stability reduces. For the RNGk-İ model results, the mass flow rate through the3
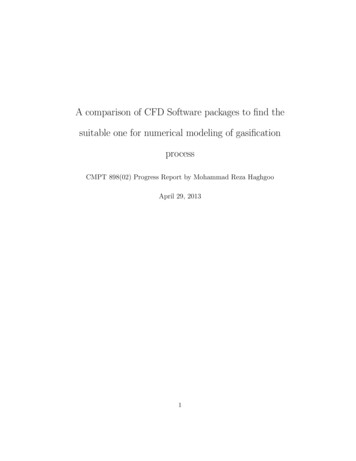
Final draft submitted to the International Journal of Ventilation 2006lower opening was different from the upper openingby 7%, 11% and 8% on Grid15, Grid20 and Grid40respectively. This is due to interpolation inaccuraciesintroduced by the grid resolution at these positions.Convergence to lower residuals with this method wasnot possible. This is possibly due to the unsteadyphysical effects that are incorrectly omitted in asteady state model. In these cases, the only stablesolution is an unsteady one (Prevezer 2002).As indicated in Figure 4, for a single zone buildingwith two equal dominant openings, the ventilationflow rate induced by combined wind and buoyancyeffects is described as:Both turbulence models produced a similar pressuredistribution on the windward wall. On average,applying the RNG k-İ model consumed about 1 daymore CPU time than the standard k-İ model toachieve the convergence level of 10-4 (RMS) on thethree types of grids. The differences of flow fieldvariables from the grid and turbulence modelsensitivity tests were all below 10% 15%. As it iscommon to accept a tolerance of 10% 15%uncertainty in full-scale and wind tunnelmeasurements, a compromise between accuracy andcomputational cost was made to investigate morescenarios under various wind directions on the finegrid at the convergence level of 1 10-4 (RMS) withthe standard k-ε model.Q Cd A3. Envelope flow theories3.1 Theoretical envelope flow modelsEnvelope flow models for ventilation studies arenormally categorized by the assumptions made forthe flow and continuity equations.A briefdescription of steady and unsteady envelope flowmodels are summarised by Etheridge [23]. Amongstthese models the simplest steady model, i.e. thepseudo-steady model, is commonly adopted fordesign procedures.3.2 Pseudo-steady modelThe pseudo-steady model requires knowledge of thetime-averaged pressure differences across theopening, corresponding to pressures at specifiedpoints on the inlet and outlet sides. In this model it isassumed that the time-averaged flow quantitiesfollow the same relationship as for truly steady flow.The Boussinesq approximation is used which statesthat the difference between the internal and externaldensities can be neglected in the continuity equation.Q Cd AΔPρ ΔTghTe ΔTghTeorwhereQ q1 q2CdAρΔP P1-P2ΔPρ(5)the mean flow rate (m3/s)opening discharge coefficient, whichis independent of the internalsize/shape of the buildingarea of the opening (m2)density of the air (kg/m3)mean static pressure differenceacross the two opening (Pa),2P 12 C p ρU refTe, Tiexternal, internal temperature (K)temperature differencehdistance between the two openings(m)and the ‘ ’ or ‘–’ sign indicates that the wind forcecomplements or counteracts the buoyancy effectΔT Ti-Te4. Full-scale experimentField tests were carried out on the wind engineeringsite at the Silsoe Research Institute (SRI) undervarious weather conditions. Details on the full-scaleexperiments and set-ups are described in anotherpaper [24]. Most data were collected on overcastdays with indoor and outdoor temperature differencesup to 8oC, so that the buoyancy effect was notdominant. In order to ensure the quality of full-scaledata, the mean ventilation flow rates of the cube weremeasured and evaluated by the following fourmethods simultaneously.4.1 Tracer gas decay methodTo determine qualitatively the ventilation flow ratesin the cube, the tracer gas (carbon monoxide) wasinjected into the indoor space until the concentrationhad built up to 20 ppm. The CO decay history can be4
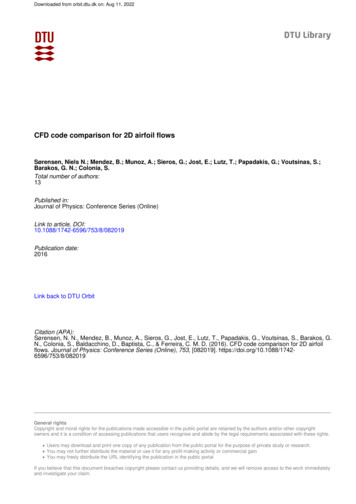
Final draft submitted to the International Journal of Ventilation 2006represented by C(t) C(0)e-It and it was logged at asampling rate of 1 Hz. The total air change rate wasobtained from the slope of the decay curve’s naturallog-plot, I. Five portable mixing fans were placedwithin indoor space to achieve adequate air mixing.4.2Mean static pressure and temperaturedifference measurementsThe pressure differences across the cube openingswere recorded using a static pressure probe situated ateach opening, and the indoor and outdoor temperaturedifferences were recorded by temperature probeslocated at opening levels. Equation 5 (in Section 3.2)was applied to calculate the mean flow rates. Figure5 shows the equipment arrangement at the high levelopening.4.3 Surface pressure measurement around theopeningAs pictured in Figure 5, each surface pressure tap wasmounted 0.5m from the centre of the opening. Theoverall pressure differences were estimated byaveraging the pressure difference from the twotapping points. Equation 5 is also employed tocalculate the mean ventilation rate.4.4 Flow speed measurement at the centre ofopeningAn ultrasonic anemometer (Gill Instrument ResearchR3 [25]) has been placed at each opening, and used tomeasure the instantaneous air velocity (see Figure 5).The mean ventilation rate was estimated using themean speed of the inflow or outflow through theopening multiplied by the opening area A.5. ResultsThe CFD results have been compared with the fullscale data collected on the Silsoe 6m cube.5.1 Pressure coefficient on ventilated cube‘CFX5 RNG’, which represent the results simulatedby the standard k-İ model and RNG k-İ modelrespectively.It can be seen in Figure 6 that at 0o wind directionCFX5 K-E and CFX5 RNG models produced similarpressure distributions on the windward wall.Significant differences occurred on the roofespecially near the leading edge, and somediscrepancies were shown around the higher opening.This is expected because flow separation from anedge of a bluff body creates a detached shear layerwhose character depends strongly on the separationlocation. Wakes change accordingly in their overallform and general nature [26].On the windward wall, the lower level opening hadeffects on the surface pressure distribution locallyaround the opening. On the leeward wall, the RNGmodel predicted more negative pressure above theopening and almost the same pressure just below theopening as the k-İ model. More differences can beseen close to the ground, the RNG model simulated alower value of negative pressure field than k-İ.Around each opening, the maximum value of 0.2 andminimum of 0.01 were the pressure coefficientdifference between these two turbulence modelresults.Regarding the average CPU time for simulation on a1 GHz Pentium III PC with 1 GB RAM, the RNG k-İmodel needed 1-day CPU time more than thestandard k-İ model, which used 8-hour of CPU time.The resulting flow field parameter differencesbetween the two turbulence models were below 7%for the mean speed, and a maximum value of 0.2 forthe pressure coefficients on the leeward wall. Thisaccuracy level is acceptable in full-scale and windtunnel experiments [6].Hence, a compromise of numerical accuracy andcomputational time led to the choice of the standardk-İ model for the follow-up parametric studies ofwind induced ventilation under various winddirections.In order to identify the opening effects on thepressure distribution, the full-scale data on the sealedcube from the CWE2000 competition [10] (quoted asSRI Full-scale in Figure 6) were also plotted togetherwith the CFD predictions of the cube with openings.The CFD predictions are named as ‘CFX5 K-E’ and5
Final draft submitted to the International Journal of Ventilation 20065.2 Mean ventilation rates comparison5.2.2 Value of discharge coefficient5.2.1 Full-scale dataIt has been noticed that under certain wind directionshigh values of the opening discharge coefficients (Cd)were required to give good agreement between theenvelope flow model and measurement.The measured ventilation rates were nondimensionalised by the opening area A and meanreference wind speed Uref. The well-establishedtracer gas decay method (in Section 4.1) is regardedas the most accurate method and is treated as thestandard for comparison. The overall ventilation ratemeasured by the tracer decay method is 0.63 0.05 forwind directions between 0o and 30o, i.e. a standarddeviation of 8.1% as shown in Table 3.Considering the pressure difference caused by windeffect alone (in Section 4.2) will result in an underprediction of 11%. Better estimations with both thewind and thermal effects lead to values 2% closer tothe effective ventilation rates obtained by method 1(in Section 4.1).In method 3 (Section 4.3), the surface pressuresrecorded by tapping points, provide the estimation ofaverage pressure drop across the cube.Thisestimation has a relatively low difference (3%)compared with the direct pressure measurement at theopenings in method 2 (9%).For a truly sharp-edged circular orifice in an infiniteplane wall with still-air condition 0.6 Cd 0.65 [27].The possible reasons for using high Cd in the presentstudies are:(i)Using experimental method 1, Q is measuredwith tracer gas and will therefore include anyeffects of turbulence on the removal of tracergas from the space.(ii) The actual opening has a depth of 0.045 m withan aspect ratio of 2.3. Experiments conductedon a circular opening [28] have shown that asharp-edged opening (zero depth as in CFDsimulation), has a Cd value of 0.6. As theaspect ratio of the opening depth increasesabove zero, the Cd value rises sharply. Thisvalue varied from 0.6 0.9, peaking around adepth of 3 and staying high up to a depth of 7.(iii) The opening is not circular.Method 4 (measurement of flow speed at the centreof the low level opening) over-predicts the flow rateby 4% in average. Due to the turbulent external flowassociated with the horseshoe vortex upstream of thebuilding’s front face and the crossflow over the loweropening, the single centre-point record could underpredict the mean inflow rate by 19% or over-predictby up to 11%. In contrast, the mean outflow speedcaptured at the high level opening under-predicts theoutgoing flow rate by 52% on average. This isprobably caused by the unsteadiness of the velocityfield in the wake of the building. The complicatedflow profile through the opening and the velocityfluctuation feature cannot be represented by thesingle point measurement at the centre of the highlevel opening.Comparatively speaking, the ventilation flow ratespredicted by method 3 showed the closest agreementwith method 1 mostly within 10% 15% agreement.(iv) The Cd value is defined on the basis of anexternal pressure and flow direction normal tothe opening.For wind directions within a 0o 30o range, the Cdvalue of 0.77 would give good agreement betweentheory and measurement. For the wind directionsaround 45o cases, the upwind fetch conditions wereaffected by nearby buildings; method 1 recorded thetotal flow rate through the cube with a standarddeviation of 21%. A value of Cd as 0.75 was chosento take account of the effects of the large incidentwind angle and the associated turbulent field aroundside walls and openings. This was done in order thatthe simulations agree with tracer gas experiments(method 1). For wind directions around 180o cases,the relatively rougher upstream fetch causes thereduction of the wind speed and with cross flowpresented at the high inlet opening location, thechoice of Cd as 0.6 gave reasonable agreement.Around the 90o cases turbulent mechanisms weredominant, the value of 0.6 was chosen to give an6
Final draft submitted to the International Journal of Ventilation 2006over-prediction of 2% by method 3 compared tomethod 1.5.2.3 Comparison of full-scale data and CFDsimulationsIn total 47 CFD simulations were performed undervarious wind directions in line with the full-scaleexperimental data. For example, 10o tests included16 cases in which the wind direction varied from 9o to13o. Addtionally, the wind speed was varied between2.97 m/s and 5.61 m/s. The simulations are dividedinto 5 groups and listed in Table 4.The ventilation rate was evaluated as in Section 4.3.Secondly, the mean ventilation rates were obtained byexperimental method 3.Figure 7 shows the CFD predictions compared withexperimental results around 10o wind directions.Without considering the minor temperature differenceeffects, CFD results under-predicted the totaleffective flow rates through the building up to 12%.The best fitting trend lines for all data in Figure 7show that the ventilation rates increase with theincreasing wind speed as expected. Without thescattered data usually found in experiments, it can bestated that fewer CFD modelling data are needed toextract the trend under specific weather conditions.It is apparent in Figure 8 that CFD assessment of themean ventilation rate for those wind directions thatare around 90o shows about 71% under-prediction ofthe experimental measurements by both method 1 andmethod 3. In this case, the ventilation may have beenmainly caused by turbulent fluctuations in the wind,which are not predicted by the time-averaged, steadystate RANS simulations. Moreover, the standard k-εmodel is not able to capture the dominantmechanisms around the cube side walls, e.g. theunsteady separation and reattachment of flow.6. DiscussionThe ventilation associated with turbulent velocityfluctuations is not accounted for in the simpler formsof envelope model. Improved results for turbulencedominated flow prediction are expected through:(i)including turbulence effects by using unsteadyenvelope flow models [27, 29], which isrelatively simple with quick solutions.However extensive knowledge of boundaryconditions is needed; or(ii) applying more sophisticated turbulencemodels, (e.g. Detached or Large EddySimulation, transient RANS [30]), which canpredict more realistic turbulence, but demandconsiderable computational power and time; or(iii) incorporating the automated simulatonfacilities within CFD packages. This wouldinvolve placing the buildings underinvestigation on a turntable within thenumerical domains and then automaticallyrotating the turntable according to the windincident angles, to obtain the quasi-steadyapproximations using 80o, 85o, 95o and 100oflow fields. This is then simulated by RANSmodels combined with a weighting factor tocalculate the ventilation rate for 90o case [31].This has been validated for wind engineeringapplications[31], but not ventilation studies.The methods mentioned above would need furtherinvestigation using the experimental data forvalidation. Parallel wind tunnel experiments usingscale models should be conducted in order to fill thegaps in full-scale data, and also to investigate thedifference for ventilation studies between wind tunneltests and field tests, e.g. Reynolds number or otherscaling factor effects.7. ConclusionsCFD has been applied to predict the naturalventilation rates in a full-scale cubic building withtwo realistic small size openings. When winddirections are near normal to the ventilation openings,i.e. 0o 30o, utilising the external surface pressurespredicted by a RANS model in a simple envelopemodel proved capable of predicting the totalventilation rate to within 12% of measured values.The RANS model provides an understanding of themean flow characteristics that could be used asguidance in design optimization.When fluctuating pressures were large compared tomean values (at around 90o) RANS models were7
Final draft submitted to the International Journal of Ventilation 2006incapable of accurately predicting ventilation rate.Further work is required to collect more field dataand to assess other CFD models (e.g. LES) at largewind incident angles.[3]Acknowledgement[4]This work has been funded by University ofNottingham and Silsoe Research Institute in the UK.NomenclatureSymbol DefinitionUnitsACdCpdPArea of openingOpening discharge coefficientPressure coefficientMean static pressure difference across theopeningsIndoor & outdoor temperature differenceGravitational accelerationRelative height of openingsTurbulent kinetic energyMean flow rateOutdoor temperatureWind streamwise, spanwise, verticalvelocity componentsMean wind velocity component in x,y,zdirection respectivelyWind speed at reference heightFriction velocityHeight above the groundAerodynamic roughness heightWind velocity reference heightDensity of airm2PaκVon Karman’s constant κ 0.40-εTurbulence dissipation ces[1][2]Cook, M.J., Y. Ji, and G.R. Hunt, CFDmodelling of natural ventilation: Combinedwind and buoyancy forces. InternationalJournal of Ventilation, 2003. 1(3): p. 169179.Chen, Q., Using computational tools to factorwind into architectural environment design.Energy and Buildings, 2004(In press).[10][11]Jiang, Y., D. Alexander, H. Jenkins, R.Arthur, and Q. Chen, Natural ventilation inbuildings: Measurement in a wind tunnel andnumerical simulation with large-eddysimulation. Journal of Wind Engineering andIndustrial Aerodynamics, 2003. 91(3): p.331-353.Nishizawa, S., T. Sawachi, K. Narita, H.Seto, and Y. Ishikawa, A wind tunnel fullscale building model comparison betweenexperimental and cfd results based on thestandard k-e turbulence representation.International Journal of Ventilation, 2003.2(4): p. 419-429.Straw, M.P., Computation and measurementof wind induced ventilation, phd thesis, PhDthesis, in School of Civil Engineering. 2000,University of Nottingham, UKhttp://www.nottingham.ac.uk/ evzngw/download.htm: Nottingham.Hoxey, R.P., P.J. Richards, and J.L. Short, A6m cube in an atmospheric boundary layerflow part i. Full-scale and wind-tunnelresults. Wind and Structures, 2002. 5(2-4): p.177-192.Tsuchiya, M., S. Murakami, A. Mochida, K.Kondo, and Y. Ishida, Development of a newk-e model for flow and pressure fields aroundbluff body. Journal of Wind Engineering andIndustrial Aerodynamics, 1997. 67 & 68: p.169-182.Hoxey, R.P., A.P. Robertson, B. Basara, andB.A. Younis, Geometric parameters thataffect wind loads on low-rise buildings: Fullscale and cfd experiments. Journal of WindEngineering and Industrial Aerodynamics,1993. 50: p. 243-252.Murakami, S., A. Mochida, Y. Hayashi, andS. Sakamoto, Numerical study on velocitypressure field and wind forces for bluffbodies by k-e, asm and les. Journal of WindEngineering and Industrial Aerodynamics,1992. 41-44: p. 2841-2852.Richards, P.J., A.D. Quinn, and S. Parker, A6m cube in an atmospheric boundary layerflow part 2. Computational solutions. Windand Structures, 2002. 5(2-4): p. 177-192.Wright, N.G. and G.J. Easom, Non-linear k-emodel results for flow over a building at fullscale. Applied Mathematical Modelling,2003. 27: p. 1013-1033.8
Final draft submitted to the International Journal of Ventilation 20
2. CFD simulation CFD solutions are obtained with CFX5 (version 5.5.1), which is a general-purpose, unstructured-grid CFD code [13]. CFX5 uses a finite element based finite volume method to model the equations for the conservation of mass, momentum and energy in terms of the dependent variables and pressure in their Reynolds time-averaged form.