Transcription
NASA/TM–2022-4659Multi-Fidelity CFD Simulation of theMultirotor Test BedJasim U. AhmadNASA Ames Research Center, Moffett Field, CaliforniaSarah A. ConleyNASA Ames Research Center, Moffett Field, CaliforniCarl R. RussellNASA Ames Research Center, Moffett Field, CaliforniApril 2022
This page is required and contains approved text that cannot be changed.NASA STI Program Report SeriesThe NASA STI Program collects, organizes,provides for archiving, and disseminates NASA’sSTI. The NASA STI program provides access tothe NTRS Registered and its public interface, theNASA Technical Reports Server, thus providingone of the largest collections of aeronautical andspace science STI in the world. Results arepublished in both non-NASA channels and byNASA in the NASA STI Report Series, whichincludes the following report types: TECHNICAL PUBLICATION. Reports ofcompleted research or a major significantphase of research that present the results ofNASA Programs and include extensive dataor theoretical analysis. Includes compilations of significant scientific and technicaldata and information deemed to be ofcontinuing reference value. NASA counterpart of peer-reviewed formal professionalpapers but has less stringent limitations onmanuscript length and extent of graphicpresentations.TECHNICAL MEMORANDUM.Scientific and technical findings that arepreliminary or of specialized interest,e.g., quick release reports, workingpapers, and bibliographies that containminimal annotation. Does not containextensive analysis.CONTRACTOR REPORT. Scientific andtechnical findings by NASA-sponsoredcontractors and grantees. CONFERENCE PUBLICATION.Collected papers from scientific andtechnical conferences, symposia, seminars,or other meetings sponsored orco-sponsored by NASA. SPECIAL PUBLICATION. Scientific,technical, or historical information fromNASA programs, projects, and missions,often concerned with subjects havingsubstantial public interest. TECHNICAL TRANSLATION.English-language translations of foreignscientific and technical material pertinent toNASA’s mission.Specialized services also include organizingand publishing research results, distributingspecialized research announcements andfeeds, providing information desk and personalsearch support, and enabling data exchangeservices.For more information about the NASA STIprogram, see the following: Access the NASA STI program home pageat http://www.sti.nasa.gov Help desk contact orm/and select the “General” help request type.
NASA/TM-2022-4659Multi-Fidelity CFD Simulation of theMultirotor Test BedJasim U. AhmadNASA Ames Research Center, Moffett Field, CaliforniaSarah A. ConelyNASA Ames Research Center, Moffett Field, CaliforniRussel R. CarlNASA Ames Research Center, Moffett Field, CaliforniNational Aeronautics andSpace AdministrationAmes Research CenterMoffett Field, CaliforniaApril 2022
AbstractThe high-fidelity and reduced order CFD method's validation and analysis are presentedfor the Multirotor Test Bed. The reduced-order method uses a rotor-disk model in theOVERFLOW CFD code and is an important aspect of this study. A rotor-trim option looselycoupling the comprehensive code CAMRAD II with the OVERFLOW CFD code is included inthe simulation that captures rotor blade aerodynamics, blade and rotor performance, rotor-rotor,and rotor-body interactions. Detailed comparison and validation were performed for both higherfidelity full rotor unsteady flows and reduced-order rotor-disk methods. The tunnel geometry isincluded in the detailed computational effort. Computations of the low-Reynolds number flowswere performed for a different number of in-plane rotors as well as for a single rotor modeledinside the tunnel.IntroductionNASA recently developed the Multirotor Test Bed (MTB) [ref. 1-3] system as a part of theagency's Revolutionary Vertical Lift Technology (RVLT) Project to facilitate wind tunnel testingfor new and existing multirotor aircraft configurations, with a focus on collecting validation datafor Urban Air Mobility (UAM) vehicle simulations. The MTB is currently capable of testing up tosix rotors with the potential to expand to more than six rotors. The MTB is designed to adjust thevertical, lateral, and longitudinal placement of each rotor, as well adjust the rotor tilt and thepitch of the whole assembly. Improvements are currently being made to the MTB to improve thequality of the data measurements for future MTB testing scheduled for testing in 2022.Conventional helicopter flow fields are complex in general and multirotor UAM aircraftsystem flow fields are even more complex and require high-fidelity Navier-Stokes simulations foraccurate representation. The knowledge gained from conventional helicopter flow fields is usefulfor understanding the low Reynolds number flow about UAM vehicles but is not directlyapplicable due to the large variations of the flow field Reynolds number and the interaction ofthe rotor flow filed with support structures. The flow field, whether in forward flight or hover,consists of unsteady aerodynamics with complex three-dimensional wakes dominated by theblade tip vortices. The wake also contains shear layers that are produced as the turbulentboundary layers detach from the blade surface. As the tip vortices convect away from the rotorblade, the vortex cores entrain part of the shear layer, and as such, the flow is inherentlyunsteady. To capture the rotor blade aerodynamic-structural interactions, high-fidelityComputational Fluid Dynamics (CFD), and Computational Structural Dynamics (CSD) analysesare coupled to accurately model the flow field, rotor blade motion, and rotor trim. Thecomputational simulation of such unsteady, moving, and often deforming surfaces, is timeconsuming, difficult, and not computationally expensive. Recently, there has been increasedinterest in the aerodynamics of multirotor vehicles such as those proposed for the emergingUAM market; vehicle geometries include quadcopters, side-by-side rotors, and lift plus cruiseconfigurations. Modeling these multirotor configurations requires increased computational effort.The OVERFLOW simulation captures rotor blade aerodynamics, blade, and rotor performance,and rotor-body interactions to improve understanding and performance of multirotor systems.Besides a higher-fidelity algorithm, we explore reduced-order modeling for the rotor to providean alternative to the fully modeled rotor.Validations of the CFD simulations using the data from MTB experiments wereperformed using the high-performance computing resources at the NASA AdvancedSupercomputing (NAS) facility at NASA Ames Research Center. Both the higher-order and thereduced-order models are available in the OVERFLOW [4] code. The reduced-order modelsignificantly reduces the complexity of the simulations. The rotors and the propellers aremodeled as infinitely thin disks, which are represented by the momentum source terms in thegoverning Navier-Stokes equations. The recent version of the OVERFLOW [4] code includedthis disk model. A detailed description of this modeling capability can be found in Ref. [5]. The
full-rotor models are loosely coupled with the CAMRAD II [6] comprehensive rotorcraft analysissoftware and tested on various rotor systems. The current effort introduced a rotor trimalgorithm. With this CAMRAD II - OVERFLOW CFD solution, the experimental investigators canadjust the rotor parameters, (e.g., the rotor pitch). The trim algorithm can eventually helpconstruct a more detailed test matrix for future experiments.The main objectives of this study are to validate the computational results for MTB bycomparing to the experimental data, understand the interaction between flow among differentstructures in the tunnel, and observe rotor-rotor interference effects. Section 1 summarizes thecomputational model for the rotor. Sections 2-3 describe the CFD/CSD coupling. Section 4briefly describes the experimental setup. Section 5 details the computational model thatincludes the wind tunnel geometry. Finally, in section 6, validation cases and somerepresentative results with single and multiple rotors for forward flight and hover are presented.The results attempt to quantify some aspect of the interactional effects of the support structuresby interpreting the mean flow. Some instantaneous flow fields are presented that will be usefulfor the MTB experimental designs.1. Computational Rotor ModelThe helicopter flowfield was computed using the Navier-Stokes equations in two ways.The first approach used the high-fidelity full-rotor (i.e., each blade modeled) unsteady flows withmoving grids. The flowfield in the second approach used a reduced-order model using a seriesof approximations. The first level of approximation consisted of retaining an unsteady frameworkand projecting the actual blades onto the disk so that they acted on the fluid as they rotate aboutthe rotor axis. For the helicopter problem, the unsteady formulation at least captures the firstharmonic effect. A further simplification was based on a steady-state assumption whereby thedisk area is filled with an infinite number of blades, and the force distribution is scaled accordingto the trim target. In this case, the unsteady description is lost, but computational costs aredrastically reduced to one steady-state simulation. The details are given in Ref. [3] and thesolved equations are shown below. The rotor is modeled as a disk as shown in Eq.1. Thesource term was computed using the Blade Element Theory (BET), where the blade wasrepresented with a series of 2-D blade sections. At each time step of the simulation procedure,at each elemental area on the rotor disk, an average of the flow properties was derived from themost recently computed Navier-Stokes solution of the flowfield. The source term was added tothe Right Hand Side (RHS) of the equation, as shown in Eq (1). 𝑈 𝑡 𝐹 𝐺 𝑥 𝑦 𝐻 𝑧 𝑆(1)𝑈 [𝜌, 𝜌𝑢, 𝜌𝑣, 𝜌𝑤, 𝜌𝐸]𝑇 is the vectors of conservative variables. 𝐹, 𝐺, 𝐻 are the convectiveand diffusive flux tensors in x, y, z. 𝑆 is the formal introduction of the source terms due to theactuator disk (force per unit area of the disk)𝑓 (𝑓𝑥 , 𝑓𝑦 , 𝑓𝑧 )𝑆 [0, 𝑓𝑥 , 𝑓𝑦 , 𝑓𝑧 , (𝑓 𝑣)]𝑇The effect of blade motions and deformations, namely pitching and flapping degrees offreedom were determined based on the rotor trim. Torsional deformations were not included inthe simulation presented here, though the coupled interface has the option to include the torsiondeformations. A simplified trim procedure for the target thrust and moment balance is availablein OVERFLOW. The appropriate approach, however, is to loosely couple OVERFLOW toCAMRAD II. CAMRAD II is a comprehensive analysis of rotorcraft that includes anaerodynamics module and structural analysis modules. CAMRAD II incorporates a combinationof advanced technologies, including multibody dynamics, nonlinear finite elements, and
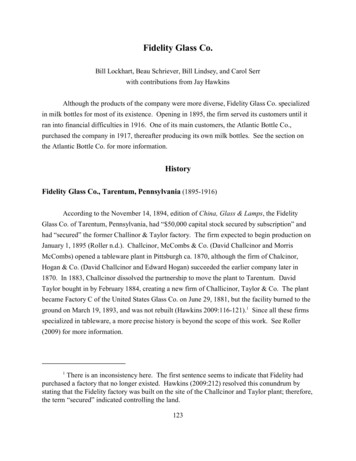
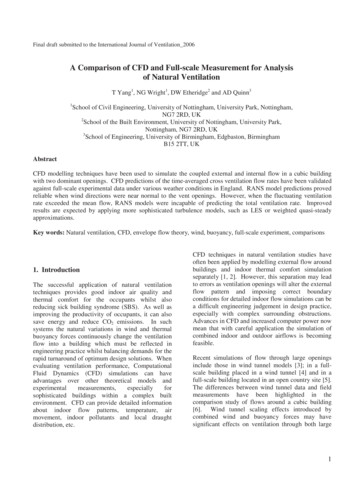
rotorcraft aerodynamics. Figure 1 shows the iterative approach for the coupled computation,with the CSD analysis provided by CAMRAD II.Figure 1. Schematic for CFD/CSD coupling for rotor disk model2. CFD/CSD Coupling and TrimCAMRAD II is interfaced with OVERFLOW for the full rotor unsteady simulation. InCAMRADII, each rotor blade is structurally modeled. Besides CSD, CAMRAD II provides fullhelicopter trim capability. Like the full rotor simulation, the CFD load is transferred to CAMRADII through an interface module “delta load”. The delta load between CFD and CAMRAD II isused in correcting CAMRAD II's aerodynamic load to compute new aerodynamic data and trim.The trim procedure is an important aspect of helicopter flight where the rotor loading accountsfor a significant portion of the total vehicle forces and moments. The trim task finds theequilibrium solution for a steady-state operating condition and solves performance, loads, andvibration.Recently, CAMRAD II has been interfaced with the rotor disk model in OVERFLOW [4],including the trim capability, like the full rotor simulation. The concept of motion interface asdiscussed above is modified to accommodate the blade motions through control angles insteadof quarter-chord displacement data in the full rotor simulation. At some specified iteration step,the CFD provides the same loads as a full rotor simulation to CAMRADII through the ‘delta load’and in turn, CAMRAD II provides the trimmed angles. This procedure is described in Ref. [5]. Ina typically coupled simulation, the initial execution of the CFD code is carried out for one or twocomplete rotor revolutions, using blade deformations from a trimmed CAMRAD II solution withthe unmodified lifting-line model in aerodynamics. In subsequent coupling cycles, the flow solveris run for some n-blade multiple of a revolution between coupling cycles (full revolution for somecases), ‘n’ being the number of blades of a rotor. At each coupling step, rotor loads from CFDare provided to CAMRAD II and in turn, CAMRAD II uses this CFD load to correct its lifting-lineaerodynamics to retrim the rotor. At convergence, the CFD airloads fully replace comprehensiveanalysis airloads.3. Experimental SetupA detailed description of the experiment of the Multirotor Test Bed (MTB) project is givenin Refs. [1-2]. Figure 2 shows the MTB as it was tested in the U.S. Army 7- by 10- Foot WindTunnel at NASA Ames Research Center. The MTB has the flexibility to test larger-scale rotorconfigurations when compared to previous tests using small hobby-scale Urban Aircraft System(UAS). This allows for testing at rotor tip Reynolds numbers more relevant to full-scale pilotedelectric Vertical Take-Off and Landing (eVTOL) aircraft expected for UAM operations. Theexperiment allows the multirotor design space to be parametrically explored. By measuringindividual rotor loads for a multirotor system and allowing for adjustments to individual rotorposition and tilt angle. Each rotor can tilt forward 90 deg and backward 5 deg about the hinge. Inaddition, the entire MTB can tilt forward 20 deg and backward 10 deg through the centralsupport structure, known as the strongback. The strongback is the backbone of the supportstructure assembly. The flexibility of the strongback assembly allows the entire multi-rotor
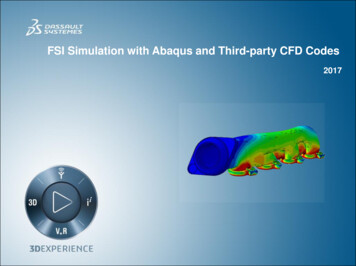
system to be tested in many different multirotor and tilting-rotor configurations. The rotors canbe arranged in tall and short configurations height-wise via adjustable support arms. The CFDsimulations will be validated for the multirotor configurations in hover and edgewise forwardflight for short configurations in this work.Figure 2. The left MTB in the U.S. Army’s 7-by 10-Foot Wind Tunnel at NASA AmesResearch Center1,2. Picture on the right shows the tall and short configuration of the rotorsupport arms.4. Overset Grid SystemThe overset grid system used in the present simulation was generated using theChimera Grid Tools (CGT) software [7]. CGT contains a very efficient and modular grid scriptinglibrary used for grid manipulation, generation, reorganization, overset hole cutting surfaces, andgeneration of OVERFLOW input files. This scripting procedure produces high-quality surfacegrids and subsequent volume grids with a set of input parameters. These parameters allow thegrid system to be quickly and automatically modified for the existing geometry. Figure 3 showsthe computational model for the modified MTB structure inside the tunnel. For the tunnel wallcomputational geometry, the tunnel test section is represented exactly and is extruded at theentrance and the exit. At the entrance, is extended about half of the tunnel test section lengthand at the exit about one tunnel length.(a)(b)Figure 3. (a). Computational domain showing rotor numbering and configuration. Cclockwise, CC-counterclockwise rotor. (b). Right picture shows volume mesh that transitioned tothe wall grid.
4.1 Rotor GeometryThe MTB uses six KDE-CF245-DP two-bladed, 24.5in., carbon fiber rotors. The bladeswere 3D-scanned to generate an accurate three-dimensional geometry, which provides camber,thickness, chord, and twist characteristics. Twenty-five airfoil sections were identified along thespan to provide accurate blade characteristics for use in the simulations. The KDE-CF245-DPairfoil sections of the rotor blade, and radial location are shown in Table 1. Besides thecomputational grid for the full blade simulation, the airfoil table plays a very important role inimplementing a more accurate rotor-disk model.r/RAirfoilsKDE-CF245-DP Airfoil Sections0.1891KDE1MTB roR 1891.c810.2662KDE2MTB roR 2662.c810.7515KDE3MTB roR 7515.c810.9435KDE4MTB roR 9435.c81Table 1. Radial locations of KDE-CF245-DP Airfoil SectionsAirfoil tables are generally created using two-dimensional (2D) computational analyses of anairfoil shape for a specified range of angle-of-attack and Mach number pairs or by wind tunneltesting. The 2D analysis computes the section lift coefficients, drag coefficients, and momentcoefficients. There are two approaches to determine the lift and drag of the blade elements. Thefirst and widely used approach is to use airfoil tables arranged in the C81 format. Coefficientsfor airfoil lift, drag, and pitching moment are listed as a function of Mach number and angle-ofattack. The main geometric characteristics of the rotor blades [1] are summarized in Table 2.Figure 4 shows the non-linear blade twist and chord distribution.RotorValuesParametersRadius, R12.125 inchNumber of2Blades, Nb0.08460Geometric1.3566 inchSolidityMean Chord,CmeanTable 2. Geometric Properties of the Rotor.Figure 4. Geometric properties: Blade Twist, Chord, and Quarter-chord distributionFigure 5 (a) shows the blade planform as provided by Refs [1-2] and the computational gridfor the rotor. The O-grid system used in the present simulations is shown in Fig. 5 (b). The blade
tip geometry is accurately represented in the surface grid, including all sharp edges. Theoverset grids for each rotor blade consist of three separate grids: the main rotor-blade body, acap grid at the outboard tip, and a cap grid at the inboard root. The main rotor-blade body usesan O-mesh topology that maintains good surface resolution. The viscous spacing provides anaverage y of approximately 1.0 or less. For the rotor-disk model the cylindrical grid system usedis shown in Figure 6 (a). Figure 6 (b) shows a cutout view of the grid with the representative diskplane for the source terms and the indices that are used in the OVERFLOW rotor-diskalgorithm. For both grid systems, the “Near-Body (NB)” grids refer to the curvilinear oversetsurface grids of the rotor, tunnel, and support structures. These are embedded into a CartesianOff-Body (OB) box grid which fills the tunnel space by resolving the rotor wake region andextending the computational domain to the tunnel wall grid. These off-body Cartesian box gridsare generated within OVERFLOW according to user-specified input parameters and at variouslevels of resolution starting from Level 1 (L1) in the rotor-wake region, to successively coarsergrid levels (L2, L3, L4 etc.) to extend the grid system rapidly and efficiently fill out the tunnel aswell as beyond the test section. For this study, the box grid spacing is constant and two differentresolution was used in this study. Detailed grid statistics are shown in Table 3 in section 5.(a). Blade planform(b). Blade gridFigure 5. (a). Schematic of blade planform. (b). Blade gridFigure 6. Grid used in the rotor disk model.5. Computational ApproachDetails of the various aspects of the OVERFLOW algorithms are available in manypublications including Ref. 4. A brief description of the CAMRAD II comprehensive code, thefluid/structure loose coupling procedure, the UH-60A geometry, the overset grids, and theOVERFLOW CFD code are described in this section.5.1 Comprehensive Analysis and Rotor TrimThe rotorcraft CSD code used for this study is CAMRAD II [6]. The aerodynamics moduleswithin CAMRAD II are based on lifting-line models utilizing airfoil tables, coupled with wakemodels. Within CAMRAD II, each blade is structurally modeled as a set of nonlinear beam
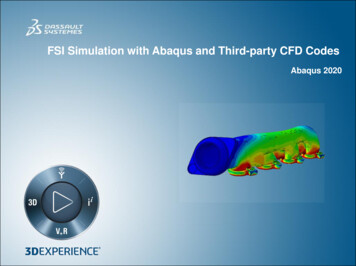
elements. In addition to the structural dynamics modeling, CAMRAD II offers a trim capability.For the UH-60A simulations in this paper, a three degree-of-freedom trim was utilized, with thesolidity-weighted thrust coefficient, pitching moment, and rolling moment specified as trimtargets within CAMRAD II. In turn, CAMRAD II provides the collective pitch, longitudinal cyclic,and lateral cyclic pitch angles. The details of this comprehensive code and coupling strategiesare described in Ref. [4-5].5.2 Flow Solver AlgorithmOVERFLOW is a high-fidelity finite-difference, overset grid, RANS CFD code. Besidesthe higher-fidelity, OVERFLOW recently implemented a reduced-order rotor-disk model, Ref [4].The reduced-order method using a rotor-disk model in the OVERFLOW CFD code is one of theimportant aspects of this study. For these multi-fidelity algorithms, user-supplied, body-fittedstructured grids are employed near solid surfaces, with automatically generated backgroundCartesian grids filling the remainder of the computational domain. Higher-order spatialdifferences for convective fluxes with 5 th order accuracy on uniform Cartesian grids areavailable. The code has several upwind flux schemes to improve the numerical accuracy forhigh-speed applications as well as for vortex-dominated flows. The results presented here wereobtained using one of the HLL [8] family of upwind approximate Riemann flux algorithms,namely, the contact preserving HLLC [9] variant, with nominally 5th order WENO reconstructionfor the inviscid fluxes. To advance the solution in time, an implicit, second-order backwarddifference scheme is used in which the nonlinear system of equations is linearized at each timestep. In this study, the resulting system of linear equations is solved using symmetric successiveoverrelaxation (SSOR) [10], which eliminates factorization errors at the expense of morecomputational work and memory per time step. Within OVERFLOW, several time-steppingschemes are available, including dual-time schemes. This study used the Newton iterationscheme. For this simulation, OVERFLOW used anywhere from 10 to 40 subiterations at eachtime step. Several turbulence models are available in OVERFLOW. Here, the standard oneequation model of Spalart-Allmaras [11] with Detached Eddy Simulation (DES) [12] length scalemodels were utilized.6. Results for MTB in forward flight: short configurationComputations have been performed, including validation and a verification showing theconvergence and effectiveness of the interface between OVERFLOW and CAMRAD II. Theseresults include a wide range of configurations from single to multiple rotors and from aconventional helicopter to UAM concept vehicles. The MTB wind tunnel experimentdemonstrated all the capabilities of testing with 1, 2, 4, and 6 rotors, tilting the rotors, pitchingthe whole model, moving the rotors in different positions/configurations, and testing at windtunnel speeds of 0, 20, and 40 ft/s. The computational simulations here attempted todemonstrate most of the experimental tests.Before comparing the computational and experimental results, a flow visualization ispresented in Figure 7 for the six-rotor case with support structure assembly pitched at -5degrees. The results shown in Figure 7 are for the full blade simulations of Overflow. The MTBflowfield is complex. The vortex evolution shows the growth structure, wandering, turbulencemerging, and somewhat complex merging with the shear layer and with tip vortices from otherblades, and rotor-structure interactions. The shear layer leaving the blade and the vortexevolution are interdependent. The wake interactions with structures are higher for these lowReynolds number flows, where the tip vortices are weaker, and the slow-moving vortices aremore pronounced to velocities induced by flows due to the close proximities of the structuresand the other rotors. This behavior is stronger for the aft set of rotors. One purpose of this paperis to assess the prediction capability of the solver for such complex flows.
Figure 7. Vortices visualized with Q-criteria colored by pressure coefficient, Cp for MTB 6rotors in Forward Flight, 40 fps, -5 deg pitch assembly. Looking at the flow with differentperspectives.Previously, slightly different verifications were performed for similar computations in refs [13]for a wind tunnel experiment. A limited verification procedure was performed to assess solutionsensitivity to spatial resolution, temporal resolution including the number of subiterations used ateach time step, the CFD/CSD loose coupling frequency, for a single UH-60 helicopter isprovided in ref [13]. A series of runs (steps 1-6 listed below) were performed to determine anoptimum choice of parameters for computation. For, subiterations, time step, and loose couplingfrequency, step 3-6 we followed the guidelines suggested in ref [12] and not repeated here.1. Spatial variations: {ℎ𝑖 1,3 , 𝑡, 𝑆, 𝐿𝐶, 𝑇𝑟}: ℎ𝑖 1,3 0.00129,0.00136,0.00145, ℎ is the gridspacing defined below, 𝑡 is the time step, S is the sub-iterations, LC is the loosecoupling step, Tr is the trim strategy.2. Trim strategy, Tr: {ℎ, 𝑡, 𝑆, 𝐿𝐶, 𝑇𝑟𝑖 1,5 }:1: no trim only fixed collective used in the measurement2: only one front rotor3: all 6 rotors4: longitudinal line rotors, rotor 1,3,5 or 2,4,6 (for rotor number refer to Figure 7 below)5: counterclockwise and clockwise rotors: 1,4,5 and 2,3,6 respectively3. Subiterations S: 12-154. 𝑇𝑖𝑚𝑒 𝑠𝑡𝑒𝑝: 𝑡 is equivalent to an incremental azimuthal advance Dyin degrees per physical time step. 𝑡 𝑜𝑟 𝜓 𝑜𝑓 0.25 𝑑𝑒𝑔5. LC step: Periodic fraction based on number of blades in a rotor for full rotor simulation,100 to 200 steps for steady state rotor disk simulation.6. Turbulence model sensitivityComputations were performed for spatial sensitivity and trim strategy. For various trimmingoptions, we presented the results for trimming 3 rotors for now. For spatial sensitivity, we use 3different grid resolutions with the following combinations of spatial variations shown in Table 4.This parameter set provides reasonable information for making choices for numeric in practicalsimulations with some convergence measure. A function or a functional can be used to assess
the sensitivity of the results for this convergence measure. For this validation and verification,convergence measures based on one functional of airload, 𝐹(𝜓, 𝑟) 𝑀2 𝐶𝑛 is used.A.Spatial Sensitivity AnalysisThe near-body mesh of MTB structures and the rotors are of adequate resolutions. Furtherrefining of the near-body grids does not change the rotor performance numbers. However, dueto the different amounts and different types of numerical dissipation contained in each scheme,the structures, and the growth of eddies in the wake are highly grid size and scheme dependent.The grid refinement study was done only for the background intermediate mesh that fills thetunnel space. These intermediate box grids are referred to as L1 and L2 meshes. Therefinement ratios between the two box grids were not kept fixed to avoid incompatibleresolutions. Table 3 shows the details of these grids. Spatial errors are represented in a globalmeasure of average grid spacing h, where h 1/ (Total grid points)1/3.Figure 8(a) shows W-velocity profile at a location at the two aft rotors where the flowinteractions are high. This profile is taken at a line in the grid system through rotor hub centersof Rotor 5 and Rotor 6. The coarse grid solution changes quite a bit near the Rotor 6. Thesolution for all the grids is not symmetric. There are some differences although not so significantbetween fine and medium grid solution. Fig. 8 (b) shows the error estimate between fine meshand the other meshes. The W-velocity shows very little differences at a location at Rotor 1 Rotor 2, and Rotor 3 - Rotor 4 as shown in Figure 9.Figure 10 shows normal loads for various grids for only two rotors, one front rotor R1 andone aft rotor R6. There are no significant differences between all grid system for the surfacequantity, the rotor sectional load, 𝑀2 𝐶𝑛 . The aft Rotor 6 shows slight differences toward theblade tip showing some interference effect on the surface quantities.GridTotalTotalnumber points inof gridsNB gridsinmillionsTotalpoints inNBsupportgrids inmillionsTotalTotalAverageRefinementPoints in Points in GridRatioTunnelmillions Spacing, hWallGrids 236402727156ℎ1 0.00119ℎ2 0.00160ℎ3 0.00186ℎ𝑟21 ℎ2 11.34ℎ𝑟32 ℎ3 21.16Table 4. Spatial sensitivity analysis with various grids, 6-Rotor, Tunnel Speed 20 fps, MTBPitch 0 deg,
Figure 8. Spatial sensitivity analysis with various grids, 6-Rotor, Tunnel Speed 20 fps, MTBPitch 0 deg. (a). W-velocity profile at a lateral location in at the aftmost rotors. (b). RMSdifference between fine mesh and other two meshes.Figure 9. Spatial sensitivity analysis with various grids, 6-Rotor, Tunnel Speed 20 fps,MTB Pitch 0 deg. (a). W-velocity profile at a lateral location in at the front two rotors. (b). Wvelocity profile at a lateral location in at the middle two rotors.
Figure 10. Spatial sensitivity analysis with various grids, 6-Rotor, Tunnel Speed 20 fps,MTB Pitch 0 deg. Sectional loads (a). at a representative front rotor, (b). at an aftmost rotor.B.Trim sensitivityIn the multirotor framework, the trim strategy is an important aspect of the computationand even more so for this MTB simulation as the measurement did not maintain natural lateralsymmetry. Measurements were done for configurations of 1, 2, 4, and 6 rotors. For allconfigurations, the simulation trims each rotor to its measured thrust. The six-rotorconfigurations in this study incorporated different trim strategies, namely, trim all six rotors ortrim only three symmetric rotors. The differences in trimmed
The high-fidelity and reduced order CFD method's validation and analysis are presented for the Multirotor Test Bed. The reduced-order method uses a rotor-disk model in the OVERFLOW CFD code and is an important aspect of this study. A rotor-trim option loosely coupling the comprehensive code CAMRAD II with the OVERFLOW CFD code is included in