Transcription
Comparison between CFD and Measurementsfor Real-gas Effects on Laminar ShockwaveBoundary Layer Interaction, I.20 June 2014MacLean, MatthewHolden, MichaelDufrene, AaronCUBRC, Inc.
New Test Cases for Hollow Cylinder Flare Model2
New Test Cases for Double Cone Model3
Comparisons to Previous Data Obtained over DoubleCone Model from LENS-I Reflected Shock Tunnel3 MJ/kg (2.5 km/s)Nitrogen5 MJ/kg (3 km/s)Air10 MJ/kg (4.5 km/s)Air4
Test Conditions for Double Cone and Hollow CylinderFlare ExperimentsDouble ConeHollow Cylinder Flare5
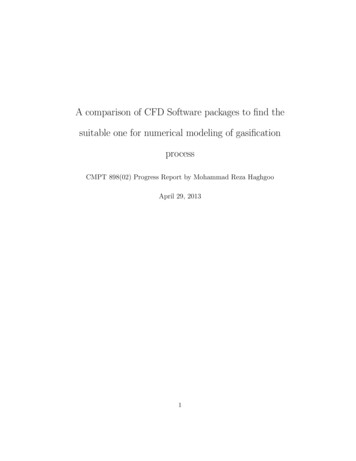
Operation schematic of an Expansion Tunnel1. Three tubes initially separated by diaphragms (test gas shown in center tube)DRIVERTEST GASACCELERATION GAS2. Breaking the primary diaphragm transmits a shock into the test gas, increasing its pressure3. When the shock reaches the secondary diaphragm, the higher pressure test gas breaks itand causes the test gas to expand into the acceleration tube3. The expanding test gas cools and gains velocity while it drives a very strong shock throughFreestream gasthe acceleration gas ahead of itShock-heated accelerator gas5. Testing begins as soon as the test gas arrives at the test station and lasts until the unsteadyexpansion fan begins to alter the freestream state of the gas [ O( 1ms) ]Freestream gas6
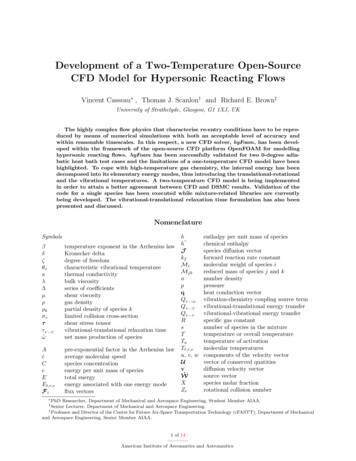
Wave Diagram of an Expansion Tunnel showing Propagationof Shocks, Expansions, and Contact SurfacesTest Time Limited by Two Factors: Head of unsteady expansion (reflected off primary contact)unsteady expansion addskinetic energy directly(U5 U2) Tail of unsteady expansionTIME (t)peak temperature (2)TEST TIME520expansion wave3contact surface2shock104freestream (5)1POSITION (x)DRIVERTEST GASACCELERATION GASassume:P4 P1 P107
Freestream Condition Calculation for LENS-XX CUBRC High Enthalpy Expansion TunnelAnalysis (CHEETAh) Code Numerically solves 1D primary and secondarywave systems (shown right) incorporatingequilibrium chemistry, thermodynamics,ionization, etc. Makes use of measurable quantities like shockspeed, Pitot pressure, static pressure, etc. toanchor the solution.Primary Shock system Rapid, real-time solution of “as-run” freestreamconditions available in less than 1 second.Secondary Shock system8
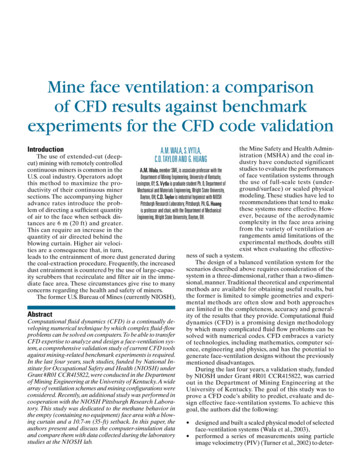
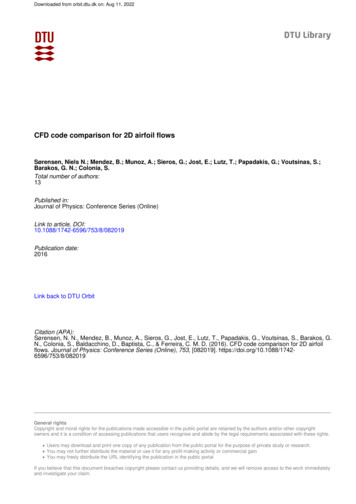
Development of Separated Region overDouble Cone: Run 05 Arrival of initial gas marked approximately by time 0.0 Separation length estimated using distance from the corner forward to the point whereheat flux sharply drops on the front cone (eyeballed). Accelerator gas pre-cursor time is shown in yellow, followed by establishing test gasshown in gray – the accelerator gas partially develops the separated region. As pressure and heat flux rise post-test as shown in blue, separation point remainsinvariant for quite a while.9
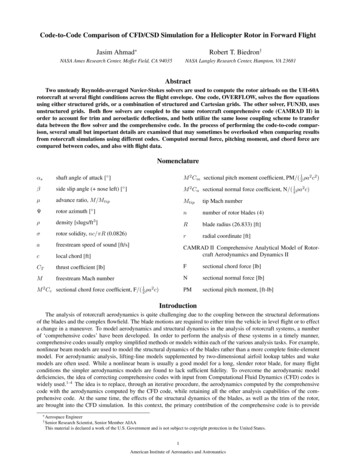
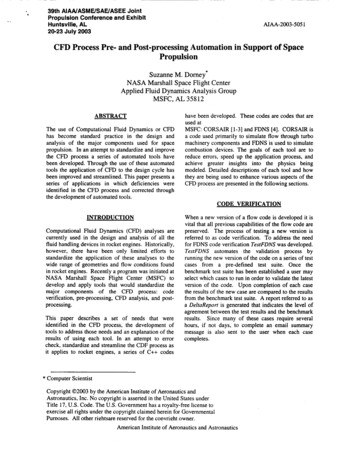
Development of Separated Region overHollow Cylinder Flare: Run 04 Separation region size is approximately 2.5X the size observed on the double-cone;establishment timescale seems to increase correspondingly. In all cases, the hollow cylinder “over-shoots” (separated region gets too large)immediately after the contact surface arrives, and then shrinks back to its minimumobserved size (recall the CFD solutions over-predict this). Post-test as pressure and heat flux rises on the model, separation region increasesagain (as Reynolds number increases)10
Freestream ConditionsMach NumberPitot Pressure(kPa)Unit ReynoldsNumber/106 3615.2311.4659.00.395.4662.045573Run #Total Enthalpy/106 (ft2/s2)Mach NumberPitot Pressure(psia)Unit ReynoldsNumber/103 (1/ft)Velocity(kft/s)Densityx106 1Run #Total Enthalpy(MJ/kg)111
Run 01: [3.2 km/s, 0.5 g/m3]12
Run 02: [4.3 km/s, 1.0 g/m3]13
Run 03: [6.0 km/s, 0.5 g/m3]14
Run 04: [6.5 km/s, 1.0 g/m3]15
Run 05: [6.0 km/s, 1.1 g/m3]16
Run 06: [5.4 km/s, 2.1 g/m3]17
Reynolds Number Trend in Experimental Data18
Velocity (Enthalpy) Trend in Experimental Data19
Freestream ConditionsRun #Total Enthalpy(MJ/kg)Mach NumberPitot Pressure(kPa)Unit ReynoldsNumber/106 n #Total Enthalpy/106 (ft2/s2)Mach NumberPitot Pressure(psia)Unit ReynoldsNumber/103 (1/ft)Velocity(kft/s)Densityx106 5.656121.371.838111220
Run 01: [3.1 km/s, 0.6 g/m3]21
Run 02: [4.5 km/s, 0.5 g/m3]22
Run 03: [4.7 km/s, 1.8 g/m3]23
Run 04: [5.5 km/s, 2.2 g/m3]24
Run 05: [6.5 km/s, 0.9 g/m3]25
Reynolds Number Trend in ExperimentalData26
Double Cone Data Obtained in LENS-I vsLENS-XXLENS-I5 MJ/kg (3 km/s)NOTE:Reynoldsnumbers arenot the samebetween thetwo tunnels!10 MJ/kg (4.5 km/s)LENS-XX27
Conclusions Unique dataset of laminar shock/BL-interaction experimentsavailable from LENS-XX from 3 to 6.5 km/s freestream velocity. Comparison between LENS-I and LENS-XX at 5 and 10 MJ/kgcompares favorably. Comparisons with CFD to be made at end of session.28
Comparison between CFD and Measurementsfor Real-gas Effects on Laminar ShockwaveBoundary Layer Interaction, II.20 June 2014MacLean, MatthewHolden, MichaelDufrene, AaronCUBRC, Inc.
Model Configurations30
Freestream ConditionsMach NumberPitot Pressure(kPa)Unit ReynoldsNumber/106 3615.2311.4659.00.395.4662.045573Run #Total Enthalpy/106 (ft2/s2)Mach NumberPitot Pressure(psia)Unit ReynoldsNumber/103 (1/ft)Velocity(kft/s)Densityx106 1Run #Total Enthalpy(MJ/kg)131
Run 01: [3.2 km/s, 0.5 g/m3]32
Run 02: [4.3 km/s, 1.0 g/m3]33
Run 03: [6.0 km/s, 0.5 g/m3]34
Run 04: [6.5 km/s, 1.0 g/m3]35
Run 05: [6.0 km/s, 1.1 g/m3]36
Run 06: [5.4 km/s, 2.1 g/m3]37
Freestream ConditionsRun #Total Enthalpy(MJ/kg)Mach NumberPitot Pressure(kPa)Unit ReynoldsNumber/106 n #Total Enthalpy/106 (ft2/s2)Mach NumberPitot Pressure(psia)Unit ReynoldsNumber/103 (1/ft)Velocity(kft/s)Densityx106 5.656121.371.838111238
Run 01: [3.1 km/s, 0.6 g/m3]39
Run 01: [3.1 km/s, 0.6 g/m3]40
Run 02: [4.5 km/s, 0.5 g/m3]41
Run 02: [4.5 km/s, 0.5 g/m3]42
Run 03: [4.7 km/s, 1.8 g/m3]43
Run 03: [4.7 km/s, 1.8 g/m3]44
Run 04: [5.5 km/s, 2.2 g/m3]45
Run 04: [5.5 km/s, 2.2 g/m3]46
Run 05: [6.5 km/s, 0.9 g/m3]47
Run 05: [6.5 km/s, 0.9 g/m3]48
Conclusions Dataset of laminar shock/BL-interaction experiments availablefrom LENS-XX from 3 to 6.5 km/s freestream velocity. In general, the CFD simulations are very consistent with eachother except for specific instances shown during thepresentation. In general, the CFD tends toward over-predicting separatedregion length on the hollow cylinder flare and under-predictingseparated region length on the double cone. Data on the hollow cylinder flare in the attachment regionshows consistently broader character than the CFD predicts –reason unclear.49
Comparison between CFD and Measurements for Real-gas Effects on Laminar Shockwave Boundary Layer Interaction, I. 20 June 2014 MacLean, Matthew . observed size (recall the CFD solutions over-predict this). Post-test as pressure and heat flux rises on the model, separation region increases again (as Reynolds number increases) 10 .