Transcription
CONTROL SYSTEMS AND SIMULATION LABLAB MANUALSubject CodeRegulationsClass:::A60290R15– JNTUHIII Year II Semester (EEE)DEPARTMENT OF ELECTRICAL AND ELECTRONICS ENGINEERINGINSTITUTE OF AERONAUTICAL ENGINEERING(Autonomous)Dundigal, Hyderabad – 500 0431 P age
INSTITUTE OF AERONAUTICAL ENGINEERING(Autonomous)Dundigal, Hyderabad - 500 043Department of Electrical and Electronics EngineeringProgram ineering Knowledge: Apply the knowledge of mathematics, science, engineeringfundamentals, and an engineering specialization to the solution of complex engineering problems.Problem Analysis: Identify, formulate, review research literature, and analyze complexengineering problems reaching substantiated conclusions using first principles of mathematics,natural sciences, and engineering sciences.Design / Development of Solutions: Design solutions for complex engineering problems anddesign system components or processes that meet the specified needs with appropriateconsideration for the public health and safety, and the cultural, societal, and environmentalconsiderations.Conduct Investigations of Complex Problems: Use research-based knowledge and researchmethods including design of experiments, analysis and interpretation of data, and synthesis of theinformation to provide valid conclusions.Modern Tool Usage: Create, select, and apply appropriate techniques, APPRATUS, and modernengineering and IT tools including prediction and modeling to complex engineering activities withan understanding of the limitations.The Engineer and Society: Apply reasoning informed by the contextual knowledge to assesssocietal, health, safety, legal and cultural issues and the consequent responsibilities relevant to theprofessional engineering practice.Environment and Sustainability: Understand the impact of the professional engineering solutionsin societal and environmental contexts, and demonstrate the knowledge of, and need for sustainabledevelopment.Ethics: Apply ethical principles and commit to professional ethics and responsibilities and normsof the engineering practice.Individual and Team Work: Function effectively as an individual, and as a member or leader indiverse teams, and in multidisciplinary settings.Communication: Communicate effectively on complex engineering activities with the engineeringcommunity and with society at large, such as, being able to comprehend and write effective reportsand design documentation, make effective presentations, and give and receive clear instructions.Project Management and Finance: Demonstrate knowledge and understanding of the engineeringand management principles and apply these to one’s own work, as a member and leader in a team,to manage projects and in multidisciplinary environments.Life - Long Learning: Recognize the need for, and have the preparation and ability to engage inindependent and life - long learning in the broadest context of technological change.Program Specific OutcomesPSO1PSO2PSO3Professional Skills: Able to utilize the knowledge of high voltage engineering in collaborationwith power systems in innovative, dynamic and challenging environment, for the research basedteam work.Problem - Solving Skills: Can explore the scientific theories, ideas, methodologies and the newcutting edge technologies in renewable energy engineering, and use this erudition in theirprofessional development and gain sufficient competence to solve the current and future energyproblems universally.Successful Career and Entrepreneurship: The understanding of technologies like PLC, PMC,process controllers, transducers and HMI one can analyze, design electrical and electronicsprinciples to install, test , maintain power system and applications.2 P age
INDEXS. No.List of ExperimentsPage No.1Time response of Second Order systems6-82Characteristics of Synchros9 - 123Programmable Logic Controller-Study and verification of truth tables of logicgates, simple Boolean expressions and application of speed control of motor13 - 184Effect of feedback on DC servo motor19 - 215Transfer function of DC motor22 - 276Effect of P, PD, PI, PID Controller on second order systems.28 - 297Lag and Lead compensation - Magnitude and phase plot30 - 338Transfer function of DC generator34 - 379Characteristics of magnetic amplifiers38 - 4110Temperature controller using PID42 - 4411Characteristics of AC Servo motor.45 - 4712PSICE simulation of Op-Amp based Integrator and Differentiator circuits48 - 5113Stability analysis (Bode, Root Locus, Nyquist) of Linear Time Invariant systemusing MATLAB.52 - 5614State space model for classical transfer function using MATLAB57 -593 P age
ATTAINMENT OF PROGRAM OUTCOMES & PROGRAM SPECIFIC OUTCOMESExp.No.Experiment1Time response of Second Order systems2Characteristics of Synchros3Programmable Logic Controller - Study andverification of truth tables of logic gates, simpleBoolean expressions and application of speedcontrol of motor4Effect of feedback on DC servo motor5Transfer function of DC motor67Effect of P, PD, PI, PID Controller on secondorder systems.Lag and Lead compensation - Magnitude andphase plotProgram OutcomesAttainedProgram SpecificOutcomes AttainedPO2, PO4PSO1, PSO2PO1, PO2, PO3PSO2PO1, PO2, PO3, PO4,PO5PSO1, PSO2PO3, PO6, PO9PSO1, PSO2PO2, PO4PSO2PO1, PO3, PO4PSO1, PSO2PO1, PO2, PO3, PO4PSO1, PSO28Transfer function of DC generatorPO1, PO3PSO19Temperature controller using PIDPO1, PO3, PO4PSO1, PSO310Characteristics of magnetic amplifiersPO1, PO3, PO4PSO111Characteristics of AC Servo motor.PO1, PO3PSO1, PSO2PO1, PO2, PO3, PO4,PO5PSO1, PSO2PO1, PO3, PO4PSO1, PSO3PO1, PO2, PO3, PO4,PO5PSO1, PSO2121314PSICE simulation of Op - Amp based Integratorand Differentiator circuitsStability analysis (Bode, Root Locus, Nyquist)of Linear Time Invariant system usingMATLAB.State space model for classical transfer functionusing MATLAB4 P age
CONTROL SYSTEMS AND SIMULATION LABORATORYOBJECTIVEThe objective of the lab is to design a system and calculate the transfer function, analyzing the stability of thesystem (both open and closed loop, with positive and negative feedback) with time domain approach andfrequency response analysis, using MATLAB and also developing the system which is dynamic innature with state space analysis approach.OUTCOMES:Upon the completion of Control Systems practical course, the student will be able to attain the following:1. Recognize the symbols for the different parts of a block diagram: functional blocks,summing blocks and branch points. Simplify a block diagram using block diagram algebrato obtain a transfer function between any two points in the diagram.2. Model a mechanical (masses, dampers and springs) and electrical system (inductors,resistors, capacitors) in the form of a transfer function.3. Determine the impulse, step, and ramp response of a system, given a transfer functionmodel.4. Perform Routh’s stability criterion and root locus of a system to determine stability. Forsystems with unknown values, determine the range of values for which the system will bestable and explain how adding a pole or a zero affects the stability.5. Analyze feedback control systems in the time and frequency domain to use state spaceconcepts to describe systems.6. Recognize the “type” of a system (based on the number of free integrators) and discuss theexpected error characteristics as related to step, ramp, and acceleration inputs.7. Interpret design criteria as related to the closed loop pole location on the complex plane.8. Draw the Frequency response plots like Bode, Nyquist and Polar plots (magnitude andphase) for a given transfer function.9. Design feedback compensators to achieve a set of desired closed loop system characteristicsand design a compensator in the frequency domain to meet specific design requirementsusing a lead compensator, lag compensator, or lead-lag compensator.10. Develop a PLC program for an automatic control system of a medium degree of complexityand select the right hardware for a given application.11. Consider such aspects of the automation system as network communication, human machineinterface, safety and protection against interference.5 P age
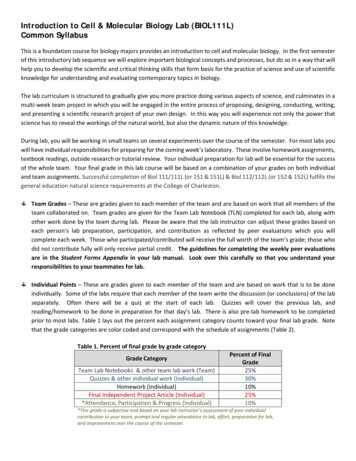
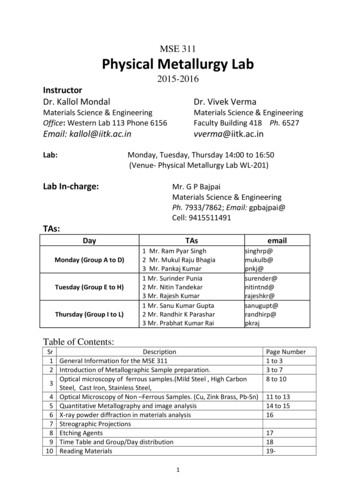
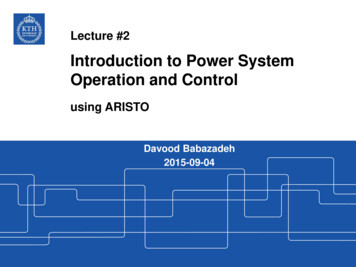
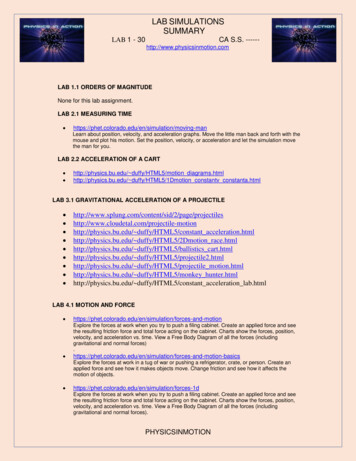
EXPERIMENT - 1TIME RESPONSE OF SECOND ORDER SYSTEM1.1AIM:To study the time response of a second order series RLC System .1.2APPRATUS:S. No.1.3Equipments1Second order system study unit.2Cathode Ray Oscilloscope3Multimeter4Connecting LeadsBLOCK DIAGRAM:Fig – 1.1 Time Response of Second order System1.4CIRCUIT DIAGRAM:Fig – 1.2 Series RLC second order Equilent6 P age
1.5PROCEDURE:1. Connections are given as per the block diagram.2. Adjust the input square wave such that the magnitude of the wave is 1V (p-p).(Check the square wave in CRO by placing CRO in Channel 1 mode).3. Observe the time response on the CRO (Channel 2) by varying the resistance by changingthe knob provided on the front panel.4. Take the corresponding values of Peak Time (TP), Peak Over Shoot (µP) (i.e. Max PeakValue -1) using trace papers.5. Calculate Damping Ratio (δ), Undamped Natural Frequency (ωn) from the followingformulaeδ ln (µP) / ( 2 ln (µP)2ωn / TP (1- δ2)6. Calculate the parameters L & C of RLC system using the following formulaeδ (R/2) (C/L)ωn 1 / (LC)7. Now calculate Settling Time (TS), and Damped Frequency (ωd) using the followingformulaeTS 4 / (δ ωn)------ (2% Settling Time)ωd ωn (1- δ )21.6TABULAR ncy(ωd)SettlingTime(TS)123457 P age
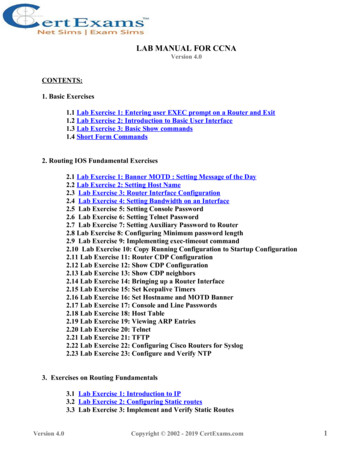
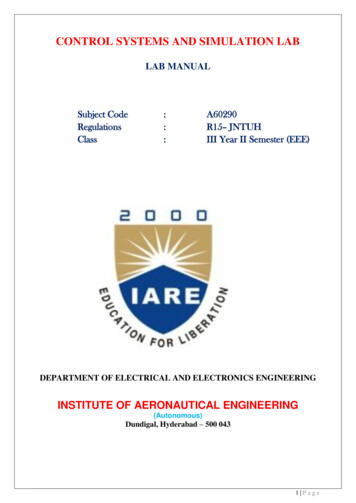
)SettlingTime(TS)123451.7MODEL GRAPH:Fig - 1.3 Time Specifications of Second order System1.8RESULT:1.9PRE LAB VIVA QUESTIONS:1. What are the Open loop and closed loop control systems?2. Give the advantages of closed loop control systems.3. What do you mean by feedback and what are the types of feedback?4. What is a system?8 P age
5. Define rise time, peak time, settling time, peak overshoot, damping ratio, steady stateerror.1.10LAB ASSIGNMENTS:1. To study the time response of a second order series RLC System to determine theparameters of L & C from ramp input2. To study the time response of a second order series RLC System to determine theparameters of L & C from sinusoidal input1.11POST LAB VIVA QUESTIONS:1. In this experiment what type of feedback is used? Why?2. Give a practical example for a first order system.3. Give a practical example for a second order system.EXPERIMENT 2CHARACTERISTICS OF SYNCHROS2.1AIMTo studyi) Synchro Transmitter characteristics.ii) Synchro Transmitter – Receiver Characteristics.2.2APPARATUS:S. No.2.3Equipments1Synchro Transmitter – Receiver Kit2Patch chordsBLOCK DIAGRAM:9 P age
Fig – 2.1 Synchro-Transmitter Pair2.4CIRCUIT DIAGRAM:2.5Fig – 2.2 Circuit Diagram of Synchro-Transmitter ReceiverPROCEDURE:2.5.1Transmitter Characteristics1. Connect the mains supply to the system with the help of a cable provided. Do not connectany patch cords to terminals marked S1, S2 and S3, R1 and R2.2. Switch ON mains of the unit.3. Initially switch ON Sw1, starting from1 ZERO position, note down the voltage betweenstator winding terminals (i.e. VS1S2, VS2S3 and VS3S1) in a sequential manner.4. Measure these voltages by using AC voltmeter provided in the trainer and note down thereadings.5. Plot a graph of angular position of rotor voltages for all three phases.2.5.2Transmitter - Receiver Characteristics1. Connect the mains supply cable.2. Connect S1, S2 and S3 terminals of synchro transmitter to S1, S2 and S3 of synchro receiverby patch cords provided respectively.10 P a g e
3. Switch ON mains supply and also S1 and S2 on the kit.4. Move the pointer i.e. rotor position of synchro transmitter Tx in steps of 30 and observethe new rotor position in synchro receiver.5. Observe that whenever Tx rotor is rotated, the Tr rotor follows if for both the directions ofrotations and their positions are in good agreement.6. Note down the input angular position and output angular position and plot the graph.2.6TABULAR COLUMN:2.6.1Transmitter CharacteristicsS. No.Rotor PositionVS1S2VS2S3VS3S11232.6.2Transmitter - Receiver CharacteristicsS. No.Angular Position of TransmitterAngular Position of Receiver1232.7MODEL GRAPH:Fig – 2.3 Synchro Transmitter Characteristics11 P a g e
Fig – 2.4 Synchro Transmitters - Receiver Characteristics2.8RESULT:2.9PRE LAB VIVA QUESTIONS:1. Define the term "synchro".2. Name the two general classifications of Synchros.3. List the different synchro characteristics and give a brief explanation of each.4. Explain the operation of a basic synchro transmitter and receiver.5. Mention the application of Synchros.2.10LAB ASSIGNMENTS:1. To draw the characteristics of receiver.2. How it will works in navy systems?3. Explain what happens when the rotor leads on Synchro transmitter and synchro receiverare reversed.4. Draw the five standard schematic symbols for synchro and identify all connections.2.11POST LAB VIVA QUESTIONS:1. State the difference between a synchro transmitter and a synchro receiver.2. Explain the operation of a simple synchro transmission system.3. State the purposes of differential Synchros.4. State the purposes and functions of multispeed synchro systems.5. List the basic components that compose a torque synchro system.12 P a g e
EXPERIMENT - 3STUDY OF PROGRAMMABLE LOGIC CONTROLLER3.1AIM:Study and develop the ladder program using PLC for the following modules(i) Logic gate simulation(ii) Boolean algebra3.2APPARATUS:S. NoName of the equipmentQuantity1PLC Trainer Kit12Logic gate simulation module113 P a g e
3.33Boolean algebra panel14DC motor Control using relays15Personnel Computer16Connecting wires1CIRCUIT DIAGRAM:BLOCK DIAGRAM OF PLC TRAINERFig – 3.1 Logic Gate ModulesTruth table INV gateTruth table for AND gate:X0011Q0110Y0101X.Y Q0001Truth table for OR gate:X0011Y0101X Y0111Truth table for EX-NOR gate:X0011Y0101X Y XY100114 P a g e
15 P a g e
Fig – 3.2 Logic Gate SimulationFig – 3.3 Boolean Algebra Module16 P a g e
Demorgan’s Ist LawA00001111B00110011C01010101A. .C0000010000000100Dorgan’s IInd LawA00001111B00110011C01010101A11011111 C11011111Fig – 3.4 Boolean algebra simulation17 P a g e
3.4PROCEDURE:1Press the start button2Click on the program folder3Click on the WPL soft4Execute WPL25After the ‘RUN’ operation what operated next is the WPL window will show up.6After WPL soft is activated we are to undertake the creating of new documents.7After the setting is completed, three windows will show up: one is the ladder diagrammode window, the other is the command mode window and the third one is the SFCediting mode.8Users are to choose the editing mode of their interests to proceed with the programediting.9The ladder diagram mode :(after the diagram is edited , convert the ladder diagram to thecommand mode and the SFC diagram through compiling)10 The command mode (after the command is edited, convert it to the ladder and the SFCdiagram through compiling)11 The SFC mode: (after the SFC diagram is edited convert it to the command code throughcompiling and to convert it to the ladder diagram, users have to go through the commandcode compiling in order to achieve the ladder diagram conversion.)12 When WPL soft is activated, the first image to show up is; there are five selections on thefunction panel: File (F), communication(C), option (o), window (W), Help (H).13 Click on ‘New’ under ‘’File’’, and the following image will show up; there will be someother selections listed on the function panel: Edit (E), Compile (P), Comment (L),Search(S), View (V).3.5RESULT:3.6PRE LAB VIVA QUESTIONS1. What is PLC?2. Write down two advantages of PLC.3. Differentiate between normally ON and normally OFF switch.4. Distinguish between Timers and counters.5. What is Latches?18 P a g e
3.7POST LAB VIVA QUESTIONS:1. What is the function of MCR (Master Control Relay)?2. Where in the PLC memory is is each timer storing its data?3. How does the operation of an OFF -delay timer differ from that of an on-delay timer?4. How does each type of timer get reset back to zero?5. How long of a time period can a timer time? What is the maximum “count” value for atimer?19 P a g e
EXPERIMENT - 4EFFECT OF FEEDBACK ON DC SERVO MOTOR4.1AIM:To study the effect of feedback on DC servo motor.4.2APPARATUS:DC servo motor kit and DVM.4.3CIRCUIT DIAGRAM:Fig – 4.1 Block diagram of Effect of Feedback on DC servo motor4.4PROCEDURE:OPEN LOOP PERFORMANCE:1. Connect the main unit to the supply. Keep the gain Switch off. Set Vr 0.7 or 0.8.Connect DVM with feedback signal socket Vt.2. Note the Speed N rpm from display and tacho output Vt in volts from DVM. Record Nrpm and Vt3. volts for successive gain 4-10 in observation table.4. Calculate Vm Vr * Ka. Where Ka is the gain set from control 3 – 10.5. Vr 0.7 V.6. Vm at gain 3 0.7 * 3 2.1 V.7. Plot N vs Vt and N Vs Vm graph.CLOSED LOOP PERFORMANCE:1. In this case the gain switch is kept in on position thus feedback voltage gets subtractedfrom reference voltage.2. This is observed by decreased motor speed. Record the result between gain factor Ka andspeed N. draw the graph between techo voltage Vt and speed N.20 P a g e
4.5PRECAUTIONS:1. Apply the voltage slowly to start the motor2. Take the reading properly.3. Do not apply breaks for long time as the coil may get heated up.4. Switch OFF the main power when not in use.4.6OBSERVATION TABLE:S.NO4.7GAIN (Ka)Vt (volts)N(rpm)Vm Vr KaMODAL GRAPHS:Fig – 4.2 Model Graphs for Open LoopFig – 4.3 Model Graphs for Closed Loop4.8RESULT:21 P a g e
4.9PRE LAB VIVA QUESTIONS:1. What are the uses of DC servo motor?2. What are the types of DC servo motors?3. How the speed of DC servo motor is controlled?4. What is the relation between torque and speed of DC servo motor?5. Why the speed torque characteristics of DC servo motor has large Negative Slope?4.10POST LAB VIVA QUESTIONS:1. What is the effect of negative slope?2. In which wattage the DC servo motors are available?3. What are the special features of DC SERVO MOTORS?4. How the direction of rotation of DC servo motor can be changed?5. What is transfer function of DC SERVO MOTOR?22 P a g e
EXPERIMENT - 5TRANSFER FUNCTION OF DC MOTOR5.1AIM:To determine the transfer function of armature controlled dc motor by performing load test on dcmotor and speed control by armature voltage control to plot characteristics between back e.m.f. andangular velocity and armature current Vs torque.5.2APPARATUS:1. Armature controlled DC motor2. Patch cards3. Tachometer5.3FRONT PANEL DETAILS:AC, IN :MCB :Terminals to connect 230V AC mains supply.2 pole 16A MCB to turn ON / OFF AC supply to the controller.Armature VA : Potentiometer to vary the armature voltage from 0 – 200V.ON / OFF : ON / OFF switch for arm voltage with self start.0 – 200V DC : 0 – 200V variable DC supply for armature0 – 230V AC “ 0 – 230V variable AC supply to final inductance eoffield coil with NClamp(AC Voltage Controller)5.4CIRCUIT DIAGRAM:Fig – 5.1 Load Test on DC Motor23 P a g e
Fig – 5.2 Armature voltage control5.5THEORY:The speed of DC motor is directly proportional to armature voltage and inversely proportional toflux in field winding. In armature controlled DC motor the desired speed is obtained by varying thearmature voltage.Let Ra Armature resistance, OhmsLa Armature Inductance , HenrisIa Armature current, AmpsVa Armature voltage, VoltsEb Back emf,Kt Torque constant, N-m/AT Toque developed by motor, N mq Angular displacmenet of shaft, radJ Moment of inertia of motor and load, Kg-m2/rad.B Frictional coefficient of motor and load, N-m/rad-sec.Kb Back emf constnat, V/(rad-sec)By applying KVL to the equivallent circuit of armature, we can write,IaRa La (dIa/dt) Eb VaTorque of DC motor proportional to the product of flux & current. Since flux is constant.T α IaT Kt IaThe differential equation governing the mechanical system of motor is given byThe back emf of DC machine is proportional to speed of shaft.Eb α dθ/dt; Back emf, Eb Kb(dθ/dt)The Laplace transform of various time domain signals involved in this system areL[Va] Va(s); L[Eb] Eb(s); L(T) T(s); L[Ia] Ia(s); L[θ] [s]on taking Laplace transform of the system differential24 P a g e
equation (1) can be written as(Ra SLa) Ia(s) Eb(s) Va(s)substitute Eb(s) & Ia(s) in above equation, we getthe required transfer functions is q(s) / Va(s)where , La/Ra Ta Electrical Time constantand J/B Tm mechanical time constantThe parameters which determine the transfer function are Kt, Kb, Ri, La, B, J and theseparameters are found by conducting the following testsBrake TestThis test is conducted to find torque constant Kt and Back emf constant KbIt is a direct method andconsists of applying a brake to water cooled pulley mounted on the motorshaft. A belt is woundround the pulley and its two ends are attached to two spring balances S1 and S2. The tension of thebelt can be adjusted with the help of the wheels. Obviously, the force acting tangentially on thepulley is equal to the difference between the readings of the two spring balances.S1 and S2 spring balances in Kg.R is the radius of the brake drum in meters.N is the speed of the motor in rpm.Torque T (S1 – S2) R x 9.81 N-m.The slope of plot between Eb Vs w gives Kb.The slope of plot between Torque Vs Ia gives Kt.25 P a g e
SPEED CONTROL BY ARMATURE VOLTAGE CONTROL:This test is conducted for determines B. The motor is run on no load with a suitable excitation byconnectivity it to a d.c. source. The only torque under no load condition at any constant speed is thefriction. Torque By only. The plot between torque and speed gives the B.5.6PROCEDURE:I) LOAD TEST ON DC MOTOR1. Circuit connections are made as per the circuit diagram.2. Connect 220V fixed DC supply to the field of DC motor and brake drum belt should belessened.3. Start the motor by applying 0 - 220V variable DC supply from the controller till the motorrotates at rated speed.4. Note down meter readings which indicates no load reading.5. Apply load in steps up to rated current of the motor and note down corresponding I, N, F1& F2 readings.6. Switch off the armature DC supply using armature supply ON / OFF swich and thenswitch OFF the MCB.II)SPEED CONTROL BY ARMATURE VOLTAGE CONTROL:1. Circuit connections are made as per the circuit diagram. „2. Connect 220V fixed DC supply to the motor field. Keep the armature control pot at itsMaximum position and switch at off position.3. Switch ON the MCB, Switch on the armature control switch. Vary the armature voltageand Note down the speed and the corresponding meter readings.4. Repeat the same for different armature voltages.5.7PRECAUTIONS:1. Connect the polarities correctly and vary the knobs slowly. Avoid loose connections.2. Take the readings without parallax errors.5.8OBSERVATION TABLE:1.LOAD TEST:S.NoSpeed(r.p.m)IA(A)F1(Kg)F2(Kg)T (F1 – F2 )x6.5x9.81N.M.12345626 P a g e
2.ARMATURE VOLTAGE CONTROL:S.NoSpeed(r.p.m)Ia(A)V(volts)Eb VIaRaW 2ΠN/60123456Fig – 5.3 Model Graphs5.9MODEL CALCULATIONS:a). Motor ParamatersDC motor – 0.5 HP / 220V / 1500 rpmArm resistance Ra 1.8ΩArm Inductance La 135mHField Resistance Rf 650ΩField inductance Lf 21 HMoment of intertia J 0.024 Kg/m2Friction fo-efficient B 0.8TRANSFER FUNCTIONS:27 P a g e
5.10RESULT:5.11PRE LAB VIVA QUESTIONS:1. Why does the speed fall slightly when the D.C. shunt motor is loaded?2. What will happen if the field current of the D.C. shunt motor gets interrupted?3. What are the possible errors in the experiment?4. How will you avoid the breaking arrangements getting heated?5. Up to what capacity of motor can this type of test be done?6. Why the motors are not operated to develop maximum power.7. By applying which law, the direction of rotation of d.c. motor can be determined.5.12POST LAB VIVA QUESTIONS:1. The transfer function dc motor with armature control is system.2. The transfer function dc motor with field control is system.3. What is order the of the transfer function of DC motor?4. The motor time constant is given by;5. In armature control is maintained constant.6. Armature control is suitable for speeds28 P a g e
EXPERIMENT - 6EFFECT OF P, PI, PID CONTROLLER ON A SECOND ORDER SYSTEM6.1AIM:To study the steady state performance of an analog P, PI & PID controller using simulated system.6.26.3APPRATUS:S. No.Equipment1PID Controller2Patch ChordsBLOCK DIAGRAM:Fig – 6.1 Block diagram Effect of P, PI, PID Controller on a second order system6.4PROCEDURE:1. Make the connections as per the block diagram.2. Set input DC amplitude to 1V.3. Adjust I, D to Zero.4. For various values of P, measure Vf, Vi and Ve using meter provided on the kit and notedown the readings.6.5TABULAR COLUMN:P ControllerS. No.P(Variable Proportionate gain)ViVfVe123429 P a g e
PI Controller (Constant Proportionate gain and Variable Integral gain)P S. No.IViVfVe1234PID Controller (Constant Proportionate gain & Integral gain and Variable Differential gain)P I S. No.DViVfVe12346.6RESULT:6.7PRE LAB VIVA QUESTIONS:1. What is a controller?2. What is the difference between a compensator and controller?3. Write a brief note about Proportional Controller.4. Write a brief note about Derivative Controller.5. Write a brief note about Integral Controller.6.8LAB ASSIGNMENTS:1. To observe open loop performance of building block and calibration of PID Controls.2. To study P, PI and PID controller with type 0 system with delay.3. To study P, PI and PID controller with type 1 system.6.9POST LAB VIVA QUESTIONS:1. Write a brief note about PID Controller.2. Compare the performance of PI and PD controller.3. Which controller is used for improving the transient response of the system?4. Whch controller is used for improving the steady state response of the system?5. What is the purpose of PID controller?30 P a g e
EXPERIMENT - 7STUDY OF LEAD – LAG COMPENSATION NETWORKS7.1AIM:To study of Lead - Lag compensation networks.7.27.3APPARATUS:S.No.Equipment1Lead-Lag network study unit2C.R.OCIRCUIT DIAGRAM:Fig – 7.1 Lag Compensation NetworkFig – 7.2 Lead Compensation NetworkFig – 7.3 Lag-Lead Compensator Network31 P a g e
7.4PROCEDURE:1. Switch on the main supply to unit observes the sine wave signal by varying the frequencyand amplitude potentiometer.2. Now make the network connections for Lag, Lead and Lead-Lag networks connect thesine wave output to the networks input.3. Note down the peak actuator input using digital voltmeter provided, now the meter willshows peak voltage.4. Set the amplitude of sine wave to some value ex: 3 Volts peak, 4Volts Peak etc.,5. Now vary the frequency and note down frequency, phase angle difference and outputvoltage peak for different frequencies and tabulate all the readings.6. Calculate the theoretical values of phase angle difference and gain compare these valueswith the practical values.7. Plot the graph of phase angle versus frequency (phase plot) and gain versus frequency(magnitude plot).8. Repeat the same for different values of R and C.9. Repeat the same for different sine wave amplitude.10. Repeat the same experiment for lead and lag-lead networks.FORMULAELag NetworkPhase angle, Φ tan -1ωRC1Gain RC ω2 1RC 2FORMULAELead Network -1Phase angle, Φ tan 1 ωRCjωRC 1 jωRCGain GC jω VoutVinVout R Z Vin ZR2 1 ωC 2Vin VFORMULAELag-Lead NetworkR1C1 τ1 , R 2C2 τ2R R2β 1 1R232 P a g e
β 10k 10k 2.010kα R20.5 1R1 R 2The transfer function of such a compensator is given by s 1 s τ1 G s s 1 s βτ1 (lag)1 τ2 1 ατ 2 (lead)CALCULATIONS:R1C1 τ1 0.002, R 2C2 τ2 0.002ω0 1τ1 τ 2The frequency at which phase angle zero is ω0 1τ1 τ 2ω0 2 500f 500/6.28 80Hz7.5TABULAR COLUMN:Lag NetworkS.No.Frequency(Hz)Phase angle Ф indegreesOutput voltage VO(Volts)Gain Vo/VinPhase angle Ф indegreesOutput voltage VO(Volts)Gain Vo/VinPhase angle Ф indegreesOutput voltage VO(Volts)Gain Vo/Vin123TABULAR COLUMN:Lead NetworkS. No.Frequency(Hz)123TABULAR COLUMN :Lag-Lead NetworkS. No.Frequency(Hz)12333 P a g e
7.6RESULT:7.7PRELAB QUESTIONS:1. Write a brief note about Lag Compensator.2. Write a brief note about Lead Compensator.3. Write a brief note about Lag Lead Compensator.4. Which compensation is adopted for improving transient response of a negative unityfeedback system?7.8LAB ASSIGNMENTS:1. To study the open loop response on compensator and Close loop transient response.2.The max. phase shift provided forlead compensator with transfer functionG(s) (1 6s)/(1 2s)7.9POSTLAB QUESTIONS:1. Which compensation is adopted for improving steady response of a negative unityfeedback system?2. Which compensation is adopted for improving both steady state and transient response ofa negative unity feedback system?3. What happens to the gain crossover frequency when phase lag compensator is used?4. What happens to the gain crossover frequency when phase lead compensator is used?5. What is the effect of phase lag compensation on servo system performance?34 P a g e
EXPERIMENT - 8TRANSFER FUNCTION OF DC GENERATOR8.1AIM:To determine the transfer function of separately excited DC generator using thyristor controller.8.2APPRATUS:S. No.8.3Equipment1Thyristor controller2MGSET (Motor Generator)3DC Ammeter4DC Voltmeter5AC Ammeter6AC VoltmeterBLOCK DIAGRAM:VfVf1/Rf sLfKg/Rf sLfKgEgEg(Kg/Lf) /Vf(s)(s Rf/Lf)EgFig – 8.1 Block DiagramINTERNAL CIRCUIT DIAGRAMSFig – 8.2 Measurement of Field Resistance35 P a g e
Fig – 8.3 Measurement of Field InductanceFig – 8.4 AC Voltage Controller8.4PROCEDURE:1. Make the connection as given in the circuit diagram.2. Connect motor field supply to field adjust the motor field voltage to its rated voltage220V.3. Connect generator field supply to fie
CONTROL SYSTEMS AND SIMULATION LAB LAB MANUAL Subject Code : A60290 Regulations : R15– JNTUH Class : III Year II Semester (EEE) DEPARTMENT OF ELECTRICAL AND ELECTRONICS ENGINEERING INSTITUTE OF AERONAUTICAL ENGINE