Transcription
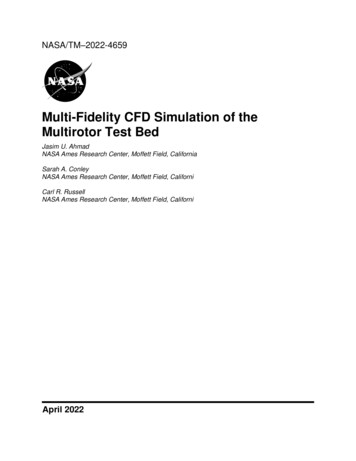
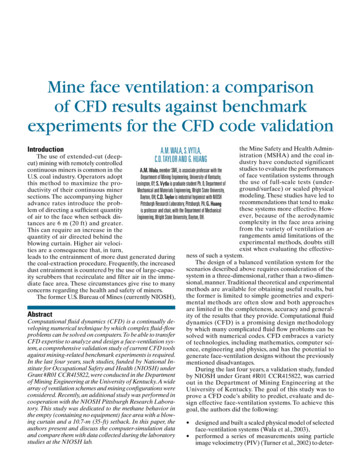
.39th AIANASMEISAEIASEE JointPropulsion Conference and ExhibitHuntsville, AL20-23 July 2003AIAA-2003-5051CFD Process Pre- and Post-processing Automation in Support of SpacePropulsionSuzanne M. Dorney*NASA Marshall Space Flight CenterApplied Fluid Dynamics Analysis GroupMSFC, AL 35812ABSTRACTThe use of Computational Fluid Dynamics or CFDhas become standard practice in the design andanalysis of the major components used for spacepropulsion. In an attempt to standardize and improvethe CFD process a series of automated tools havebeen developed. Through the use of these automatedtools the application of CFD to the design cycle hasbeen improved and streamlined. This paper presents aseries of applications in which deficiencies wereidentified in the CFD process and corrected throughthe development of automated tools.have been developed. These codes are codes that areused atMSFC: CORSAIR [ 1-31 and FDNS [4]. CORSAIR isa code used primarily to simulate flow through turbomachinery components and FDNS is used to simulatecombustion devices. The goals of each tool are toreduce errors, speed up the application process, andachieve greater insights into the physics beingmodeled. Detailed descriptions of each tool and howthey are being used to enhance various aspects of theCFD process are presented in the following sections.CODE VERIFICATIONINTRODUCTIONComputational Fluid Dynamics (CFD) analyses arecurrently used in the design and analysis of all thefluid handling devices in rocket engines. Historically,however, there have been only limited efforts tostandardize the application of these analyses to thewide range of geometries and flow conditions foundin rocket engines. Recently a program was initiated atNASA Marshall Space Flight Center (MSFC) todevelop and apply tools that would standardize themajor components of the CFD process: codeverification, pre-processing, CFD analysis, and postprocessing.This paper describes a set of needs that wereidentified in the CFD process, the development oftools to address those needs and an explanation of theresults of using each tool. In an attempt to errorcheck, standardize and streamline the CDF process asit applies to rocket engines, a series of C codesWhen a new version of a flow code is developed it isvital that all previous capabilities of the flow code arepreserved. The process of testing a new version isreferred to as code verification. To address the needfor FDNS code verification TestFDNS was developed.TestFDNS automates the validation process byrunning the new version of the code on a series of testcases from a pre-defined test suite. Once thebenchmark test suite has been established a user mayselect which cases to run in order to validate the latestversion of the code. Upon completion of each casethe results of the new case are compared to the resultsfrom the benchmark test suite. A report referred to asa DeltuReport is generated that indicates the level ofagreement between the test results and the benchmarkresults. Since many of these cases require severalhours, if not days, to complete an email summarymessage is also sent to the user when each casecompletes.* Computer ScientistCopyright 02003 by the American Institute of Aeronautics andAstronautics, Inc. No copyright is asserted in the United States underTitle 17, U.S. Code. The U.S. Government has a royalty-free license toexercise all rights under the copyright claimed herein for GovernmentalPumoses. All other rightsare reserved for the CoDvright owner.American Institute of Aeronautics and Astronautics
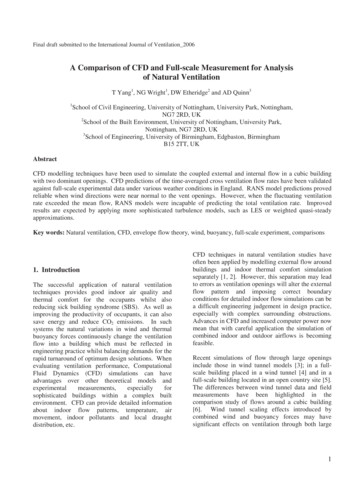
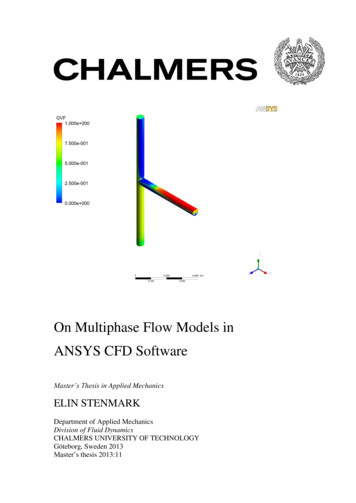
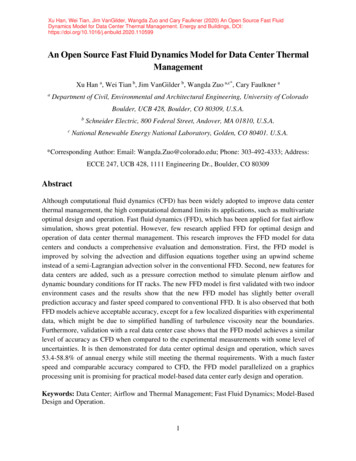
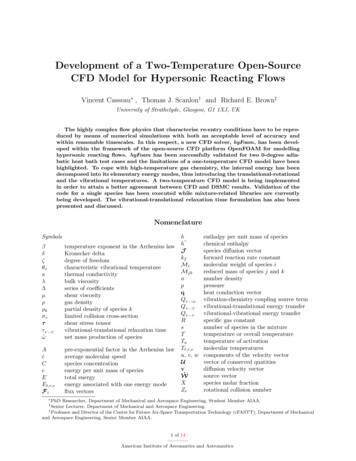
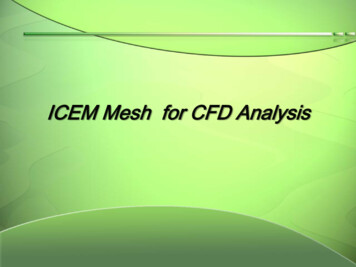
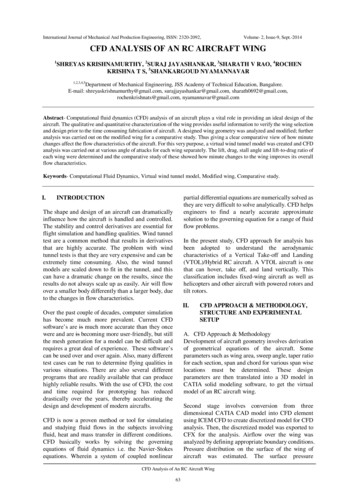
AIAA-2003-5051ResultsResultsTestFDNS has been used extensively to validate newand modified versions of FDNS. The time savings inbeing able to run and analyze the results of severaltest cases automatically is quite significant. Casesthat previously would take two days (manually) cannow be computed in 20 minutes. TestFDNS is alsohaving an impact in the development of new versionsof FDNS. When an improvement is incorporated intothe flow code TestFDNS is being used to test theintermediate results. The DeltuReport is then used todetermine if the latest set of modifications results in asolution that is closer, or farther from, the knownresults in the test suite.The impact of PreViewer was immediate. PreViewerwas able to detect several errors in cases that werecurrently in the final stages of running, and in onecase the final stage of post-processing. This particularsimulation consisted of 44 separate grids and hadtaken several days to error check all of the boundaryspecifications. Through the use of PreViewer withinseconds the error report indicated one error stillexisted in the specification of the boundaryconditions. PreViewer is now run as standard practiceprior to starting any FDNS simulation. Not only doesit detect errors but it ensures the validity of theboundary condition specification. Shortly after itsrelease a batch version of the error reportingcapability of PreViewer was added so that the errorreport could be generated without initiating aninteractive session.The use of TestFDNS has become standard practicefor all new releases and modifications of the code. Anexample of a partial DeltuReport is shown in Fig 1.In addition to error checking the input files for anFDNS simulation, PreViewer has evolved into a fullpre-processing tool. To take advantage of parallelCFD codes and multiple processors it is oftenadvantageous to break domains into multiple grids.Codes exist that can automatically break up a gridsystem, except once again the boundary conditionswould need to be specified by hand. Figure 3 shows avortex core chamber that was originally discretizedusing 9 grids and was then broken up into 19 grids.This almost doubled the number of boundaryconditions. Before PreViewer, most engineers wouldnot undertake such a task because the time needed tospecify and verify the boundary conditions was toogreat. With the decomposition option in PreViewerthis process is now automated and the net result ofbreaking up the grids in this case was a speed up of afactor of 5.PRE-PROCESSINGAs part of an Advanced Space TransportationProgram simulations are being performed for aRocket Based Combined Cycle engine (RBCC). Thisgeometry is represented as a series of grids. Multiplegrids are used for one of two reasons. Grid generationof the complete system is often much easier when itcan be done in segments. Multiple grids can also beused to take advantage of multiple processors. Thesolution of each grid (or combination of grids) can beaccomplished on a separate processor. Of particularinterest in a simulation are the boundary conditions.Boundary conditions control the physical behavior ofthe flow model. The edges of each grid are processeddifferently than internal points. In a single gridsimulation the boundary conditions are relativelysimple to specify, yet in the RBCC simulation where22 grids are modeled the situation is significantlymore complicated. Over 2000 separate values areneeded to specify the boundary conditions. These2000 values need to be verified before the simulationis computed and the results are evaluated. Thisverification was previously done manually. Becauseof the sheer volume of values this process was errorprone and ambiguous.To aid in post-processing PreViewer has thecapability to combine grids after a simulation iscompleted.INTERIM-PROCESSINGWhen a physical experiment is being performedengineers have access to several sensor panels used tomonitor the experiment. In this manner they candetermine if the experiment is exhibiting the expectedbehavior. In a similar manner it is often useful tomonitor the interim results of a computationalsimulation during its processing. To assist in this areatwo tools, Monitor and FlowShow have beendeveloped. These tools can be used to construct aPreViewer is an interactive visualization toolspecifically designed to address the issues ofboundary conditions. It can be used to visuallyspecify boundary conditions, examine boundaryconditions, as well as error check boundaryconditions. An example panel from PreViewer used tovisually inspect the interface between two grids isshown in Fig. 2.2American Institute of Aeronautics and Astronautics
AIAA-2003-5051traditional contour and vector plots Animator also hasautomated feature extraction capabilities [5-61. Asingle frame from an animation of a shock is shown inFig 6.series of contour, vector, and line plots that aregenerated from the intermediate solutions beinggenerated. Monitor is a package that will generate acollection of plots in an interactive window. Eachimage in the window is updated when the nextsolution file is written. Figure 4 shows such acollection of plots. FlowShow can be used to generatean animation of a single plot. Each frame of theanimation is generated from an intermediate solution.This tool is particularly useful when the time betweenprinting solutions is quite large. A single frame of ananimation generated with FlowShow is shown in Fig.5. Through the use of these tools it is possible for anengineer to track the progress of a solution while it isforming. Of particular interest is determining whenthe simulation can be terminated because a solutionhas converged or reached a time-periodic state.Parametric studies are being performed on a regularbasis as a way to determine optimal componentgeometries. Because of the volume of resultsgenerated the management of a parametric study canbe overwhelming. To deal with this volume of datamany engineers reduce the data to scalars such asefficiency for their final analysis of the differentsimulations. To address the need to manage andinterpret the results of a parametric study the toolAutoPlot was developed. This tool allows for specificvalues to be determined from the solution such as thelocation of complete combustion or the maximumtemperature along a wall. AutoPlot has the capabilityto be used as a calculator and determine quantities notpresent in the solution file itself. The specific valuesare then organized into a single report. AutoPlot canalso be use to generate a set of standard contour andline plots for each case in the parametric study. Theprimary use of AutoPlot is to generate values andplots in a consistent manner for each case run as partof a parametric study.ResultsThe use of Monitor met with some initial resistance asusers felt that it would draw too much on the alreadyoverloaded computer systems. However this was notthe case. Monitor was used to watch several casesand allowed for the early detection of problems in thesimulation, as well as convergence. Monitor hassuffered, in a sense, from its own success. Monitorwas designed to allow the user to track a particularvalue while the solution is forming. This abilityproved to be so useful that the use of “monitor” pointswithin the flow solver itself has become highlyutilized.ResultsThe results of using Animator have been fairlydramatic. Although the use of animations is not new,the ability to generate simple animations in batchmode without the need for extensive training onintricate animation packages has been quite useful. Inaddition to its obvious uses in presentations the abilityto generate animations in batch mode from partialsolutions enables flow features to be evaluated anderrors to be detected before large amounts of time andresources are invested.FlowShow was used in those cases where a finalanimation of a simulation was more useful than anupdating image. In particular when a new restart filewas only generated once or twice a day it was morebeneficial to view a single animation at the end of asimulation than to constantly track the simulation.One case where this was particularly useful was asimulation of a vortex chamber in which a flowinstability was occurring and through the use ofFlowShow it was visualized.AutoPlot has been used extensively in the preliminaryphases of an injector parametric study. In the initialphase 50 simulations were performed and analyzed.By using AutoPlot it was possible to organize,monitor, and compare the results of each case. SinceAutoPlot’s ability to calculate values is not limited toa pre-defined set of variables it can be used in manydifferent ways. In particular, AutoPlot was used in apre-processing phase to check the geometries of eachcase prior to starting the simulation. One of thevariable parameters was the size of the injectoropening. AutoPlot was used to examine eachgeometry file and calculate the opening in eachsimulation. These calculations were compared, withinAutoplot, to a set of expected values to determine ifeach grid was correct. Thus examining a simplePOST-PROCESSINGAlthough there are several commercially availablepost-processing visualization packages available thereis still the need for engineers to be able to generateanimations quickly and easily. This was particularlydifficult with time dependent simulations. To addressthe issues of generating animations quickly and easilyAnimator was developed. Animator is a batchprocessing tool that can be used to generateanimations of time dependent solutions. In addition to3American Institute of Aeronautics and Astronautics
.AIAA-2003-505 1report was all that was needed to confirm that eachsimulation was set up correctly.1. Dorney, D. J., Griffin, L. W., Huber, F., Sondak,D. L., "Unsteady Flow in a Supersonic TurbineStage With Variable Specific Heats," AIMJournal of Propulsion and Power, Vol. 18, No. 2,March-April, 2002, pp. 493-496.CONCLUSIONS2. Dorney, D. J., Griffin, L. W., and Huber, F., "AStudy of the Effects of Tip Clearance in aSupersonic Turbine," ASME Journal ofTurbornachinery, Vol. 122, No. 4, October, 2000,pp. 674-673.The effort to standardize the CFD process as it appliesto rocket engines has been successful. Through theuse of the tools TestFDNS, PreViewer and AutoPlotthere is a standard process and system of tools that arebeing used consistently. The ability to reduce errorsand establish confidence in the validity of eachsimulation prior to starting the computation hasyielded a significant improvement in the CFDprocess. Animator has also had a significant impactby allowing engineers to quickly and easily examinethe results of time dependent simulations through theuse of animations. Other tools such as Monitor andFlowShow are used less frequently, but allow the CFDuser a suite of tools that can be used when specialcases arise.3. Griffin, L. W. and Dorney, D. J., "Simulations ofthe Unsteady Flow Through the FastracSupersonic Turbine," ASME Journal ofTurbornachinery, Vol. 122, No. 2, April 2000, pp.225-233.4.Wang, T-S. and Chen, Y.-S.,"Unified NavierStokes Flowfield and Performance Analysis ofLiquid Rocket Engines," Journal of Propulsionand Power, Vol. 9, No. 5, Sept-Oct 1993, pp.678685.ACKNOWLEDGEMENTS5. Lane, David A., "Scientific Visualization ofLarge-Scale Unsteady Fluid Flows," ScientificVisualization. IEEE Computer Society Chapter 5 ,pp 125-145.The author would like to acknowledge thecontributions of members of the Applied FluidDynamics Analysis Group at NASA Marshall SpaceFlight Center especially Dr. Daniel Dorney, Dr. JeffWest, and Mr. Fransisco Canabal.6. Lovely, David, Haimes Robert, "ShockDetection from Computational Fluid DynamicsResults," AIAA Paper No. 99-3285, NorfolkVA, June, 1999.REFERENCES4American Institute of Aeronautics and Astronautics
AIAA-2003-505 1Delta Reportbase file:Results-FDNS500/fort.93new file:Temp-Results-FDNS50O/fort.93file: fort.93 tolerance: 0.050000 (percent)comparison of rho values:values within tolerance: 48000values not within tolerance: 0total values: 48000min and max values from base case:min: 0.000000 max: 1.291901min and max values from new case:min: 0.000000 max: 1.291901percent differences from base case:min: 0.0max: 0.0comparison of rhoU values:values within tolerance: 48000values not within tolerance: 0total values: 48000min and max values from base case:min: 0.239215 max: 1.257541min and max values from new case:min: 0.239215 max: 1.257541percent differences from base case:min: 0.0max: 0.0Figure 1: Partial DeltaReportPFigure 2: Patched Interface Panel from PreViewer5American Institute of Aeronautics and Astronautics
.AIAA-2003-505 1Figure 3: Vortex Chamber with 9 and 19 GridsIlass Conservationlo1Delta Levels-1.5-02-2.6a-02-6.k-030.01-3.000.0320oOVel. IlaqnituckU Velocity ProfilesVelocity Vectors0.00Ymoo0.20V Velocity Profiles61.50,Anach Contours-2.100-29.0.00Ymoo0.20nach buber Profiles2.59I-1.130-2.ioo0.0020oOFigure 4: Results of Monitor6American Institute of Aeronautics and AstronauticsY0.20-
.AIAA-2003-505 1Vel.Mas.Development o f V e l o c i t y V e c t o r sI0.06 .002nn nn---.-330.00360.00390.00120.00450.00*eo. 00510.00540.00570.00600.00. ’.I500Figure 5: Formation of Flow SolutionTW Turbine- Entropy1.5 Surface2 1s284194193172I611511481 29I 19lea0 650 548.438 320 220 118 Bc*Figure 6: Entropy Contours on a Shock Surface7American Institute of Aeronautics and Astronautics
major components of the CFD process: code verification, pre-processing, CFD analysis, and post- processing. This paper describes a set of needs that were identified in the CFD process, the development of tools to address those needs and an explanation of the results of using each tool. In an attempt to error