Transcription
Xu Han, Wei Tian, Jim VanGilder, Wangda Zuo and Cary Faulkner (2020) An Open Source Fast FluidDynamics Model for Data Center Thermal Management. Energy and Buildings, n Open Source Fast Fluid Dynamics Model for Data Center ThermalManagementXu Han a, Wei Tian b, Jim VanGilder b, Wangda Zuo a,c*, Cary Faulkner aaDepartment of Civil, Environmental and Architectural Engineering, University of ColoradoBoulder, UCB 428, Boulder, CO 80309, U.S.A.bcSchneider Electric, 800 Federal Street, Andover, MA 01810, U.S.A.National Renewable Energy National Laboratory, Golden, CO 80401. U.S.A.*Corresponding Author: Email: Wangda.Zuo@colorado.edu; Phone: 303-492-4333; Address:ECCE 247, UCB 428, 1111 Engineering Dr., Boulder, CO 80309AbstractAlthough computational fluid dynamics (CFD) has been widely adopted to improve data centerthermal management, the high computational demand limits its applications, such as multivariateoptimal design and operation. Fast fluid dynamics (FFD), which has been applied for fast airflowsimulation, shows great potential. However, few research applied FFD for optimal design andoperation of data center thermal management. This research improves the FFD model for datacenters and conducts a comprehensive evaluation and demonstration. First, the FFD model isimproved by solving the advection and diffusion equations together using an upwind schemeinstead of a semi-Lagrangian advection solver in the conventional FFD. Second, new features fordata centers are added, such as a pressure correction method to simulate plenum airflow anddynamic boundary conditions for IT racks. The new FFD model is first validated with two indoorenvironment cases and the results show that the new FFD model has slightly better overallprediction accuracy and faster speed compared to conventional FFD. It is also observed that bothFFD models achieve acceptable accuracy, except for a few localized disparities with experimentaldata, which might be due to simplified handling of turbulence viscosity near the boundaries.Furthermore, validation with a real data center case shows that the FFD model achieves a similarlevel of accuracy as CFD when compared to the experimental measurements with some level ofuncertainties. It is then demonstrated for data center optimal design and operation, which saves53.4-58.8% of annual energy while still meeting the thermal requirements. With a much fasterspeed and comparable accuracy compared to CFD, the FFD model parallelized on a graphicsprocessing unit is promising for practical model-based data center early design and operation.Keywords: Data Center; Airflow and Thermal Management; Fast Fluid Dynamics; Model-BasedDesign and Operation.1
1 IntroductionData centers house a large amount of mission-critical IT equipment, such as IT servers, networkand communication servers, and data storage devices, which dissipate effectively all input poweras heat during operation. Data centers require cooling to remove the heat dissipated from the ITequipment to ensure the IT equipment operates reliably. It was reported that data centers consumedapproximately 1.8% of the total U.S. electricity [1], with 24%-60% of this being consumed by thecooling system alone [2]. As the IT equipment becomes increasingly more power-intensive, itimposes more challenges on the data center cooling system [3]. As of today, air cooling is still thedominant method for primary heat removal from data centers, though liquid cooling is emergingas an energy-saving alternative [4].Data center thermal management is crucial for reliable operation of IT equipment and energyefficiency of the cooling system in the data center, which typically involves non-uniform andcomplex airflow dynamics [5]. For example, medium and large-size data centers are usuallyconfigured with alternating cold aisles and hot aisles to ensure the IT rack inlet temperatures arewithin a safe threshold by eliminating or reducing the mixing of the cooling system supply coldair and IT rack exhaust hot air. However, many data centers are over-cooled, such as more coldair is supplied than needed, just to dilute a few local hot spots (i.e. locations at the intake of ITequipment where the measured temperature is greater than the recommended value), which leadsto a low energy efficiency of the cooling system. Model-based design and operation methods canbe adopted to improve the thermal management in data centers by evaluating the coolingperformance for different scenarios. For example, in the design phase, the model can helpdetermine the layout of IT racks, the open-area-ratio (ratio of open area to total area) and locationof the perforated tiles, and the depth of the raised-floor plenum. In the operation phase, the modelcan help determine the optimal setpoints of the supply air flow rate and temperature to achieve thebest energy performance while still meeting the thermal requirements of data centers.To support model-based design and operation for data centers, many available thermalmanagement models have been utilized with varying levels of complexity and accuracy. CFD wasused to predict detailed airflow and temperature fields in the data center [6, 7]. Potential flowmodels [8] and linear abstract heat flow models [9] were also employed as fast predictiontechniques. To further accelerate the speed of predictions, artificial neural networks [10] andreduced order models (e.g. Proper Orthogonal Decomposition ) [11] were utilized to obtain somecritical information of the data center thermal environment. Among these methods, CFD has beenwidely used as a more sophisticated method than others. A recent study showed that, with carefulcalibration, CFD can make reliable predictions of perforated-tile air flow rates and rack-inlettemperatures [12]. However, while versatile and generally accurate, CFD is computationallyexpensive (especially when the size of the data center is large). This makes its use in optimal designand operation of data centers difficult, especially when multiple parameters are optimized, whichrequires a large number of simulations.2
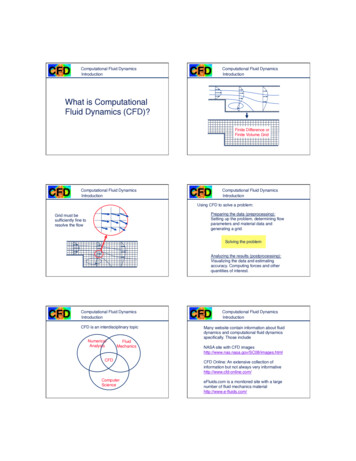
Conventional CFD commonly employs the Semi-Implicit Method for Pressure Linked Equations(SIMPLE) [13] to solve the governing equations for fluid flow. For simplicity, the conventionalCFD is referred to as CFD in the rest of the paper. To accelerate CFD, an alternative CFD modelcalled fast fluid dynamics (FFD) was proposed and applied to predict indoor environment. FFDsolves the same set of governing equations as CFD, but with a time-split method and semiLagrangian advection solver. FFD was reported to be 50 times faster than CFD and it canadditionally speedup 30 times by running in parallel on graphics processing unit (GPU) [14, 15].This level of speed improvement has great potential to significantly accelerate the process ofmodel-based design and operation for data centers. FFD was first introduced and verified inbuilding simulation applications by Zuo and Chen [16]. FFD was then improved to simulatedifferent cases such as indoor airflow [14, 15, 17], airflow around buildings [18], cabinenvironment [19], and urban-scale airflows [20]. However, the airflow and thermal dynamics indata centers are quite different compared to these applications [5]. One is that the high thermalload and airflow rate make the airflow pattern in the data center more complex than that in regularindoor environment. The other is that special treatments for boundary conditions unique for datacenters are needed, such as perforated floor tiles and IT racks with server fans inside. Someprevious studies [12, 21, 22] tried to use FFD for data center airflow and thermal modeling andshowed potential, but these studies lack a comprehensive evaluation of using FFD for optimaldesign and operation of data center thermal management. In addition, the FFD programsimplemented in those studies are proprietary. This research develops the necessary FFD modulesfor data center and conducts a comprehensive evaluation of FFD for that regarding predictionaccuracy, computing speed and performance for model-based design and operation in a real datacenter. The new FFD model for data center thermal management is implemented using OpenCL,which is a cross-platform parallel computing language. To enable the large-scale application, theFFD code has been publicly released under a free open-source license.This paper is organized as follows. First, a comprehensive introduction of the new FFD model isprovided including governing equations, methods to solve these equations, treatments of specialboundary conditions in data centers and their implementation. The new FFD model is validatedwith two classical cases for indoor environment modeling [23] in Section 3.1 and a real data centercase located in Massachusetts, U.S.A in Section 3.2. Subsequently, the application of the FFDmodel is demonstrated using three case studies based on the aforementioned data center.2 Methodology2.1 Data Center Airflow and Thermal DynamicsThe configuration and intended airflow directions of a typical raised-floor data center are shownin Figure 1. The above-floor white space (i.e. allocated for IT equipment) in the data center ispartitioned into cold aisles and hot aisles by rows of racks. The raised-floor plenum and perforatedfloor tiles are designed to uniformly distribute the cold air to the cold aisles. The cold air from the3
cooling system is supplied to the cold aisle, then flows through the IT racks and carries heatdissipated from IT equipment, and then exhausts to the hot aisle and returns to the cooling systemthrough the ceiling plenum. ASHRAE [24] defines the requirements of the data center airflow andthermal management. One key parameter is to ensure the rack inlet temperatures are within a safethreshold (e.g. not exceeding 27 oC). The segregated cold and hot aisles help lower the IT rackinlet temperature by preventing or mitigating the mixing of cold and hot air. Sometimes, physicalcontainment of the hot or cold aisle is employed to avoid such mixing.Ceiling plenumRecirculationReturnairPerforated ceiling floor plenumCRAHHotaislePerforatedfloor tilesSupply airFigure 1 Airflow pattern in a typical raised-floor data centerCFD has been widely used to improve the data center thermal management. For example, CFDcan be adopted to evaluate the temperature and airflow distribution for scenarios with differentdesigns, such as different layouts of the cold aisle, hot aisle and IT racks. However, one limitationof CFD is the high computational demand, which makes its application infeasible when multipleparameters are studied and hundreds or even thousands of simulations are needed. Thus, the FFDmodel, which was reported to be 50 times faster than CFD [15], is evaluated in this paper to solvethis problem.2.2 Fast Fluid DynamicsThis section introduces conventional FFD for indoor environment modeling and the improved FFDmodel for data center thermal management. Note that here the “conventional FFD” representsexisting FFD [12, 15, 25-27] as opposed to the proposed FFD described later in this paper. Theimprovements include changing the solving methods for the advection equation and implementingboundary conditions and special treatments for data center environment. The implementation ofthe FFD model in OpenCL is also discussed.4
2.2.1 Governing Equations and Solution MethodsLike CFD, the FFD model solves the same set of governing equations for flows. The Navier-Stokesmomentum equation can be generalized and written as: 𝑼𝑖 𝑼𝑖 2 𝑼𝑖1 𝑃 𝑼𝑗 𝜈 𝑭𝑖 , 𝑡 𝒙𝑗 𝒙𝑗 𝒙𝑗 𝜌 𝒙𝑖(1)where 𝑼 is the velocity vector, 𝑡 is time, 𝒙 is the spatial coordinates, 𝜈 is the kinematic viscosity, 𝜌is the density, 𝑃 is pressure, and 𝑭𝑖 is the source term.The energy equation can be written as: 𝑇 𝑇 2𝑇 𝑼𝑗 𝛼 𝑺𝑇 , 𝑡 𝒙𝑗 𝒙𝑗 𝒙𝑗(2)where 𝑇 is the temperature, 𝛼 is the thermal diffusivity, and 𝑺 𝑇 is the thermal source term.FFD uses a time-split method. Equation 1, for example, is split into three equations in conventionalFFD [15]:(1)𝑈𝑖(𝑛) 𝑈𝑖 𝑡(2)𝑈𝑖𝑗(1) 𝑈𝑖 𝑡(𝑛 1)𝑈𝑖 𝑼 𝑼𝑗 𝒙 𝑖 , 2 𝑼𝑖 𝜈 𝒙(2) 𝑈𝑖 𝑡𝑗 𝒙𝑗 𝑭𝑖 ,1 𝑃 𝜌 𝒙 .(3)(4)(5)𝑖The three equations are solved sequentially. As shown in Figure 2, conventional FFD first solvesEquation (3), namely the advection equation, by a semi-Lagrangian (SL) scheme [28]. Equation(4), namely the diffusion equation, is solved with an implicit scheme. Finally, Equation (5), namelythe pressure equation, is solved together with the continuity equation:5
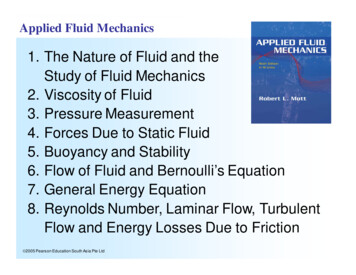
𝑼𝑖 0, 𝒙𝑖(6)based on a projection-correction method [29] to ensure mass conservation.The SL scheme [28] has been widely adopted to solve the advection equation in conventional FFD[14, 15, 17-20]. One of the major advantages of the SL scheme is the fast computing speed, whichis achieved by tracing locations at the last time step and calculating velocities through interpolationwithout any iterative algorithm. However, a major drawback of the SL scheme is that it does notguarantee in-general quantity conservation [30]. In addition, the determination of the time step sizeis crucial for the stability of simulation as well as the accuracy of the SL scheme [31]. For example,the Courant–Friedrichs–Lewy (CFL) constraints (𝑼𝑖 𝑡/ 𝑥 1) should be satisfied to overcomethe stability concerns, which may require a small time-step size. Meanwhile, a smaller time stepsize may also reduce accuracy because of truncation error growth [31]. As a result, additionalefforts are required to address these issues. On the other hand, an implicit scheme, such as the firstorder upwind, is stable and robust even when the CFL number is larger than one. However, theimplicit scheme is usually more computationally expensive compared to the SL scheme. Thus, itwill increase the computing demand by 8%-20% according to our tests if the SL scheme is replacedby an implicit scheme to solve the advection equation.In addition to the stability and robustness, the first order upwind scheme has another advantagecompared to the SL scheme, which is the unconditional conservation of mass and energy for eachcell in the computational domain. With SL, one will have to enforce mass balance at the globallevel. Even by doing so, the mass balance at cell level is not perfect. This is particularly importantin data center applications, because unlike regular buildings where the purpose is to create anenvironment with general thermal comfort, data center operators and researchers care more aboutlocal energy balance, which may influence the generations of local hot spots.To take advantage of the stability, robustness and unconditional local mass and energyconservation of the first order upwind scheme while not sacrificing computing speed, this paperproposes a new FFD model to simultaneously solve diffusion and advection equations with a firstorder upwind scheme (Figure 2). The Equations (3) and (4) are solved together as:(2)𝑈𝑖(𝑛) 𝑈𝑖 𝑡 2 𝑼𝑖 𝜈 𝒙𝑗 𝒙𝑗 𝑼 𝑭𝑖 𝑼𝑗 𝒙 𝑖 ,𝑗(7)For clarity, the proposed FFD model is called FFD-Upwind (or the FFD model) and theconventional FFD model is called FFD-SL. As shown in Figure 2, the FFD-Upwind first assignscoefficients of equation matrix for diffusion and advection sequentially and then solve the equation6
matrix with a linear Gauss-Seidel (GS) or Jacobi solver. As a result, the FFD-Upwind discards theSL scheme without increasing the computing demand compared to the FFD-SL.Conventional Solver:GS/JacobiProjectionGS/JacobiProposed FFD-Upwind:Equations:Diffusion /JacobiFigure 2 Workflow of the convectional FFD-SL and proposed FFD-Upwind2.1.2 Boundary conditionsIn this section the general boundary conditions that are commonly used for modeling of indoorenvironment are briefly introduced. The special boundary conditions for objects in the data centerenvironment are then described including perforated floor tiles and IT racks.General boundary conditions:In our study, three general types of boundaries are considered including inlets, outlets, and walls.A Dirichlet boundary condition is applied for the inlets as a fixed velocity. For the outlets, eithera Neumann boundary condition with a zero-gradient velocity or a Dirichlet boundary conditionwith a fixed velocity can be imposed. For the walls, a no-slip wall boundary condition is applied,which assumes the air velocity at the solid wall boundary is zero.Perforated floor tile:Since the raised-floor plenum and white space are modeled separately in this paper, the modelingof perforated floor tiles can be done with different considerations depending on which space isstudied [5]. The aim of modeling the raised-floor plenum is to predict the air flow rates atperforated tiles. The flow rates are determined by the pressure distribution in the plenum and thepressure drop when the air flows through the perforated tiles. We adopt a commonly used approach7
called the porous jump method (also regarded as lumped resistance method). It simplifies theperforated tiles as flow resistances and specifies a step pressure loss across the perforated tiles [5,7, 32]: 𝑃 1𝜌𝑓𝑉 2 ,2(8)where 𝑃 is the pressure drop across the tile, 𝑉 is the velocity approaching the tile, and 𝑓 is thedimensionless loss coefficient, which can be estimated from manufacturer data or by empiricalformulae, for example, the one proposed by Fried and Idelchik [33]:𝑓 1[1 0.5(1 𝛽)0.75 1.414(1 𝛽)0.375 ],𝛽2(9)where 𝛽 is the open-area-ratio of the perforated tile.When modeling the white space, the goal is to study the airflow and temperature distribution withinthe space. The perforated tiles are just special inlet boundary conditions. As a result, they are oftentreated as prescribed uniform-velocity boundaries independent of their open-area-ratio. Themagnitude of the velocity is typically determined based on the air flow rate and the total area ofthe perforated tile. However, in reality, the airflow will be accelerated when it goes through thesmall openings of the perforated tiles, which results in higher local velocities and a lower-pressureregion above the perforated tiles.Balancing the complexity and accuracy of modeling such perforated tiles should be considered.On one hand, modeling the perforated tiles as fully opened openings with a pressure loss using theporous jump model would omit the jet effect above the tiles, and therefore may lead to inaccurateor even incorrect results [32]. On the other hand, detailed pore-by-pore modeling, althoughversatile and generally accurate, is impractical in practice considering the added complexity.Consequently, there are various attempts in this area to achieve a compromise between complexityand accuracy of modeling the perforated tiles. The body force model or modified body force modelwere used to specify a momentum source above the perforated tiles [32, 34]. Abdelmaksoud, et al.[34] also developed a quadrants method, which separates the perforated tile to multiple openingswith the same total opening area. All these methods were reported to successfully capture the airacceleration through the pores of the perforated tiles. This research adopts the body force method[32] due to its simplicity and good accuracy. An additional force is added into the momentumequations to correct the under-estimated velocity for computational cells just above the perforatedfloor tiles. Suppose that a perforated tile has an open-area-ratio of 𝛽, surface area 𝐴 (m2) and air8
flow rate 𝑄 (m3/s). With the assumption that the momentum source is applied to a computationalcell with a height ℎ (m) directly above the tile, we can compute the momentum source as:𝑭𝑖 𝑄2 1(𝐴2 ℎ 𝛽 1),(10)where the direction of 𝑭𝑖 is perpendicular to the surface orientation of the perforated tile. In thispaper, we set ℎ as 0.15 m.IT Rack:There are generally two approaches to model the IT racks: the open box model and the black boxmodel [35]. The major difference between the two methods is that the airflow inside the rack ismodeled in the open box model but is excluded in the black box model. The former method adoptsa more detailed model, which may be able to capture the temperature and velocity stratificationacross the surfaces of the rack inlet and outlet. The latter method simplifies the rack as a solid boxwith an inlet and an outlet. The exhaust temperature at the rack outlet is calculated based on thetemperature profile of the air flowing into the rack inlet, with an assumed temperature rise to modelthe effect of heat dissipation inside the rack. Zhang, et al. [36] compared different levels of detailsfor modeling an IT rack including a black box rack, a detailed rack with crude server simulatorsand a detailed rack with detailed server simulators, and found that the different levels of rackdetails had little effect on the predicted temperatures for the studied case. Therefore, in the presentstudy, we adopt the black box model for its simplicity and sufficient prediction performance. Inthe black-box model, individual servers or “slices” are not explicitly resolved. The airflow isassumed to be proportional to total rack power dissipation (𝑃, 𝑘𝑊) with 212 m3/h (125 cfm) ofairflow for each kW of power (𝜓, m3/h/kW) [12, 37]. The airflow is spread uniformly over thefront and rear of the rack.𝑄𝑖𝑛 𝑃 𝜓(11)The air temperature at the rack inlet is assigned with the temperature of its adjacent cells. Thevertical temperature gradient at the front (inlet) of the rack is carried through to the rear (exhaust)of the rack with a temperature rise, which is determined by the heat dissipation of IT servers andflow rate of air through the rack:𝑞𝑇𝑒𝑥 𝑇𝑖𝑛 𝑐𝑠𝑒𝑟𝑣𝑒𝑟 𝑚̇𝑝9(12)
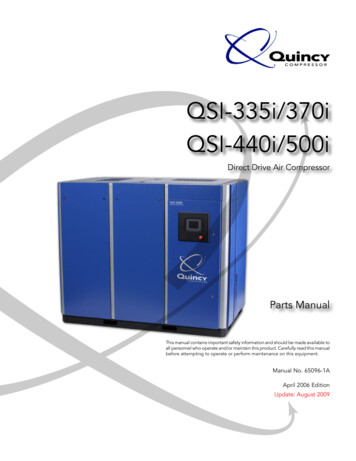
2.1.3 Software ImplementationThe data center can be split into two volumes: the raised-floor plenum and white space [5]. Aprevious study [38] recommended to model the raised-floor plenum separately and use the resultsof flow rates at perforated tiles as boundary conditions in the white space model. For modelingconvenience, our current implementation follows the procedure of modeling the raised-floorplenum and the white space separately. This is justified when relatively low open-area-ratio tilesare employed.The structure and workflow of the FFD model is shown in Figure 3. The FFD model isimplemented through hybrid programming in C and OpenCL. The host program (i.e. main routineof FFD) runs sequentially on the CPU and the kernels run in parallel on the GPU. The code inOpenCL is used to execute the kernels for assigning boundary conditions and solving thegoverning equations. For more details of the structure of the implementation, please refer to Tian,et al. [17]. It is noted that the source codes of this FFD model have been publicly released in [39] ,which is the first open source FFD model for data center thermal management.STARTInitialize in CPUInitialize in GPUAssign rack inlet boundariesbased on Equations 11-12Plenum or room?Assign rack boundariesAssign rack outlet boundariesbased on Equations 11-12RoomPlenumBlack-box rack modelSet velocities at the tilesFFD solverRead data back from GPUPlenumPlenum or room?Solve diffusion andadvection in Equation 7RoomSolve pressure correctionNext step?NoNext step?YesSolve projection bycombining Equations 5-6YesFFD solverSend data back to CPUNoWrite outputsCPUGPUFigure 3 Structure of the proposed FFD model10
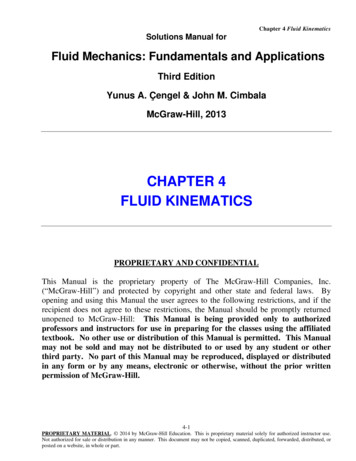
When modeling the raised-floor plenum, to ensure that the simulated airflow field and air flowrates at tiles simultaneously satisfy Equations (1) and (7), we adopt a pressure correction methodproposed by VanGilder, et al. [40]. The FFD first assigns initial values for all air flow rates at tilesand computes the pressure field in the raised floor plenum based on Equation (5) and (6). The FFDmodel then calculates the air flow rates at tiles according to the obtained pressure field andEquation (7) and checks the mass conservation. Subsequently, the FFD model shifts the pressurein the plenum by a constant value (for example, the pressure at all cells in the plenum will beincreased by a constant value if the current pressure field is too small to provide enough outflows)until a converged flow field satisfying momentum and mass conservation is achieved.When modeling the white space, we adopt a black box model to assign the boundary conditionsfor the IT racks based on Equations 10 and 11 [12]. All the governing equations are solved basedon a Jacobi method on the GPU in parallel. For the modeling of both plenum and white space, thesimulation will be terminated when the velocity, temperature and pressure fields become steadystate.3 ValidationTo validate the proposed FFD model, two classic cases for indoor environment modeling and onedata center case are selected. The indoor cases are studied to evaluate the proposed FFD modelthat solves the advection and diffusion equations together, compared to conventional FFD thatsolves them separately. The real data center case is then studied to evaluate the capability of theproposed FFD model with new features to simulate data center thermal environment. Experimentaldata are taken as reference for all the cases.3.1 Validation of the Improved FFD Model3.1.1 Description of the indoor environment casesThe first case is an empty room with forced convection, which is a pure airflow case without heattransfer [23]. The room is 2.44 m (8 ft) long, 2.44 m (8 ft) wide and 2.44 m (8 ft) high with an inletat the top of the west wall and an outlet at the bottom of the east wall. Other critical dimensionsare shown in Figure 4 (a). The temperatures of the inlet flow and surfaces in the room are controlledto be the same. Experimental data at ten locations as shown in Figure 4 (b) are available [23].The second case increases the flow complexity by adding a heated box (1.22 m 1.22 m 1.22m) in the center of the room, in which heat transfer occurs [23]. The size of room and locations ofthe inlet and outlet are the same with the first case. Other critical dimensions are shown in Figure5 (a). The temperatures of the inlet flow, box surface, ceiling, flow and other walls are 22.2 ºC.,36.7 ºC, 25.8 ºC, 26.9 ºC, and 27.4 ºC, respectively. Experimental data is available for ten locationsshown in Figure 5 (b) [23].11
(a)(b)Figure 4 (a) Schematic of the forced convection in an empty room and (b) locations ofexperimental data(a)(b)Figure 5 (a) Schematic of the mixed convection in a room with a box and (b) locations ofexperimental data3.1.2 Evaluation metricsNormalized root-mean-square deviation (NRMSD) is adopted to quantify the accuracy ofpredictions by FFD and CFD with respect to experimental data, which is defined as:12
𝑁𝑅𝑀𝑆𝐷 𝑥𝑁1𝑚𝑎𝑥 𝑥𝑚𝑖𝑛2 𝑖 1(𝑥̂𝑖 𝑥𝑖 ) 100%,𝑁(13)where 𝑥̂𝑖 and 𝑥𝑖 are simulated and measured values at point i, respectively. 𝑁 is the total numberof data points. (𝑥𝑚𝑎𝑥 𝑥min) represents the range of the studied parameter over the computationaldomain, which is 1.36 m/s when evaluating velocity profiles and 14.5 oC (36.7 oC - 22.2 oC) whenevaluating temperature profiles for the two cases.3.1.3 Setup of simulationsTable 1 Settings of simulations in FFD-Upwind and FFD-SLGridCaseForced Convection inan Empty RoomMixed Convection in aRoom with a BoxSimulation Time (s)FFDFFD-SLUpwindTime Step Size (s)FFDFFD-SLUpwind40 40 4013500.0540 40 4013500.05FFDUpwindFFD-SLTable 1 summarizes the simulation settings employed in both FFD-Upwind and FFD-SL. Weperform a similar grid independent study as was done in Tian, et al. [17]. It is found that with thenon-uniform structured grid (40 40 40), in which the averaged mesh size is about 6 cm, thesimulations achieve grid independent results. Similar conclusions were drawn in previous studies[17, 23]. The mesh is refined at critical locations to capture the gradients and changes in the flow.For example, the inlet as well as near-ceiling areas is refined with a minimum mesh size of about0.5 cm and the outlet as well as the near-floor area is refined with a minimum mesh size of about1 cm. The FFD-Upwind and FFD-SL models perform transient-state simulations because of thetime-split method used in FFD (with a time step size of 0.05 s and simulation time of 1350 s). BothFFD-Upwind and FFD-SL use a zero-equation turbulence model [41, 42] and are performed on anAMD FireProTM W8100 GPU.3.1.4 ResultsTable 2 summarizes the NRMSD of predictions for the cases with FFD-Upwind and FFD-SL. Theaverage NRMSDs for the four locations with FFD-Upwind are 5.18% and 4% for the two cases.The FFD-Upwind has slightly better overall prediction accuracy with lower averaged NRMSDsfor the two cases compared to FFD-SL. However, it can still be seen that FFD-SL performs betterthan FFD-Upwind for velocity predictions at the locations P1 and P5. This may be due to thecomplex flow structure in those areas, which is hard to capture.13
Table 2 NRMSD of predictions for cases with FFD-Upwind and FFD-SLCasesSimulationProgramForced Convection inan Empty RoomFFD-SLFFD-UpwindMixed Convection in aRoom with a cityTemperatureVelocityTemperatureP13.724.93NRMSD .6.715.185.254.00Figure 6 Comparison of velocity profiles for forced convection in an empty roomFigure 7 Comparison of velocity profiles for mixed convection in an empty room with a box14
Figure 8 Comparison of temperature profiles for mixed convection in an empty room with a boxFigure 6-8 compare the velocity and temperature profiles predicted by FFD-Upwind and FFD-SLfor the two cases. Generally, all agree with the experimental data [23] for most locations and FFDUpwind performs slightly better than FFD-SL does. However, some obvious discrepancies can beobserved. For example, velocity prediction at P5 by FFD-Upwind and temperature prediction atP6 by FFD-SL for the secon
An Open Source Fast Fluid Dynamics Model for Data Center Thermal Management Xu Han a, Wei Tianb, Jim VanGilder b, Wangda Zuoa,c*, Cary Faulkner . CFD is referred to as CFD in the rest of the paper. To accelerate CFD, an alternative CFD model called fast fluid dynamics (FFD) was proposed and applied to predict indoor environment. .