Transcription
C O M P R E H E N S I V EH O U S I N GM A R K E TA N A L Y S I SGreenville-Anderson-Mauldin,South CarolinaU.S. Department of Housing and Urban DevelopmentOffice of Policy Development and ResearchAs of October 1, 2017SummaryHousing Market AreaHendersonRutherfordPolkNorth heSouth CarolinaGreenvilleUnionalinaroh C woodNewberryThe Greenville-Anderson-MauldinHousing Market Area (hereafter,Greenville HMA), coterminous withthe Greenville-Anderson-Mauldin, SCMetropolitan Statistical Area (MSA)in upstate South Carolina, comprisesAnderson, Greenville, Laurens, andPickens Counties. Many of the citiesand towns in the HMA were establishedin the late 1800s when workers settledaround the local cotton mills. ClemsonUniversity, a public land-grant university and the 2016 National CollegiateAthletic Association (NCAA) footballchampion, is in Pickens County.Market DetailsEconomic Conditions. 2Population and Households. 6Housing Market Trends. 8Data Profile. 13EconomyRental MarketThe Greenville HMA recovered thenumber of jobs lost during the GreatRecession by the end of 2013. Duringthe 12 months ending September 2017,nonfarm payrolls increased 1.0 percentto average 412,300 jobs compared withthe previous 12-month period. Themining, logging, and constructionsector, which increased 12.4 percentto average 20,000 jobs primarilybecause of residential and commercialconstruction projects in the HMA,led job gains. The unemploymentrate during the 12 months endingSeptember 2017 was 3.8 percent, downfrom 4.6 percent a year earlier. Duringthe 3-year forecast period, nonfarmpayrolls are expected to increase anaverage of 1.2 percent annually.The overall rental housing market iscurrently slightly tight, with anestimated vacancy rate of 4.4 percent,down from 11.4 percent in 2010. Theapartment market is also slightly tightbut easing. During the third quarter of2017, the average vacancy rate increased to 4.7 percent, from 3.5 percenta year earlier (MPF Research). Theaverage rent increased 3 percent to 930. Builders responded to the tightrental market conditions by increasingapartment construction. During thenext 3 years, demand is estimated for6,000 new market-rate rental units inthe HMA (Table 1). The 2,500apartments under construction willmeet a portion of the demand.Sales MarketTable 1. Housing Demand in theGreenville HMA* Duringthe Forecast PeriodThe sales housing market in theHMA is currently tight. The estimated owner vacancy rate is currently0.9 percent, down from 2.9 percent in2010. During the 12 months endingAugust 2017, 20,150 new and existinghomes sold, up 8 percent from a yearearlier (CoreLogic Inc., with adjustments by the analyst). The averagesales price also increased 8 percentto 186,300. During the next 3 years,demand is expected for 10,400 newhomes in the HMA (Table 1). The2,000 homes under construction willmeet part of the demand.Greenville HMA*Total demandUnder ,500* Greenville-Anderson-Mauldin HMA.Notes: Total demand represents estimatedproduction necessary to achieve a balancedmarket at the end of the forecast period.Units under construction as of October 1,2017. The forecast period is October 1,2017, to October 1, 2020.Source: Estimates by analyst
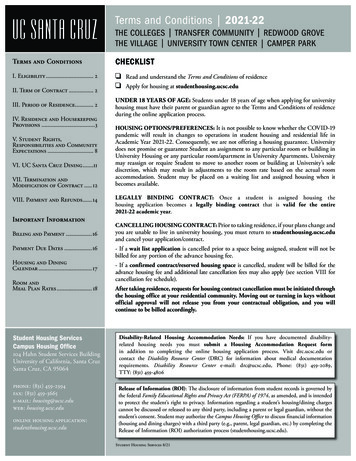
2Economic ConditionsG r e e n v i l l e - A n d e r s o n - M a u l d i n , S C C O M P R E H E N S I V E H O U S I N G M A R K E T A N A LY S I SThe Greenville HMA economyhistorically relied on manufacturing-related jobs, specificallycotton and textile manufacturing.Manufacturing comprised nearly 30percent of total nonfarm payrolls in1990 but declined to less than 14 percent currently. Since 1990, the textileindustry has declined nationally andin the HMA, because many manufacturing jobs moved overseas forcheaper labor costs. Employment attextile mills accounted for 17 percentof manufacturing jobs in the HMA in2001 but declined to 7 percent in 2011(most recent data available).Total nonfarm payrolls averaged374,100 jobs in 2000 but declinedby an average of 6,200 jobs, or 1.7percent, annually during the economiccontraction from 2001 through 2003.Manufacturing comprised the greatestshare of job losses, decreasing anaverage of 5,100 jobs, or 7.1 percent,annually. Approximately 40 percentof the losses in the manufacturingsector during this period occurredin the textile mills industry. Payrollsincreased an average of 6,900 jobsannually from 2004 through 2007,led by the professional and businessservices sector, which increased by anaverage of 3,000 jobs, or 5.8 percent,annually. Partially offsetting gains, themanufacturing sector continued todecrease by an average of 1,600 jobs,or 2.8 percent, annually. By the endof 2007, the HMA gained the numberof jobs lost since 2000; however, theeconomic expansion was brief. In 2008and 2009, nonfarm payrolls decreasedby an average of 13,000 jobs annually,or 3.5 percent. The professional andbusiness services, the wholesale andretail trade, and the mining, logging,and construction sectors led declines,decreasing by averages of 3,800, 3,800,and 3,000 jobs annually, respectively.The economy began to recover in2010, and the number of jobs lostwere recovered by the end of 2013.From 2010 through 2015, nonfarmpayrolls increased by an average of8,000 jobs, or 2.1 percent, annually.The professional and business servicessector led the recovery, adding anaverage of 3,200 jobs, or 5.5 percent,annually. The manufacturing sectorreversed years of declines and increasedby an average of 1,000 jobs, or 1.4percent, annually to 56,900 jobs. Theseincreases were not in textile manufacturing, however. In the adjacentSpartanburg, SC MSA, expansions atthe BMW Group Plant Spartanburgled to automotive supplier expansionsin the Greenville HMA, including80 jobs at JTEKT Corporation in2012, 450 jobs at ZF FriedrichshafenAG in 2013, and 150 jobs at MagnaInternational Inc. in 2015. Partiallyoffsetting increases in manufacturingpayrolls, Judson Mill, once the largesttextile mill in Greenville County,closed in 2015, eliminating 200 jobs.Despite recent gains in manufacturingemployment, the sector currently remains below the 77,100 jobs in 2000.The education and health servicessector has been the fastest growingpayroll sector in the HMA. Thesector has increased 72 percent since2000 (Figure 1). Payrolls increasedevery year except 2012, which had aslight decline of 300 jobs, or less than1 percent. The education and healthservices sector comprises about 12percent of nonfarm payrolls (Figure 2).Employment at Greenville HealthSystem (GHS) increased by 835 workers, or 7 percent, annually from 2010through 2016; increases were frommergers with existing healthcare facilities, expansions, and opening newfacilities. In 2017, GHS completed anexpansion of the intensive care unit at
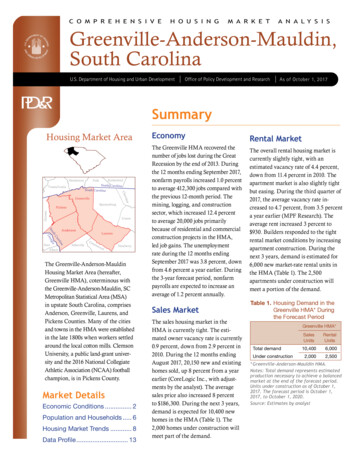
3Economic Conditions ContinuedFigure 1. Sector Growth in the Greenville HMA,* Percentage Change, 2000 to CurrentTotal nonfarm payroll jobsGoods-producing sectorsMining, logging, & constructionManufacturingService-providing sectorsG r e e n v i l l e - A n d e r s o n - M a u l d i n , S C C O M P R E H E N S I V E H O U S I N G M A R K E T A N A LY S I SWholesale & retail tradeTransportation & utilitiesInformationFinancial activitiesProfessional & business servicesEducation & health servicesLeisure & hospitalityOther servicesGovernment– 30– 20– 1001020304050607080* Greenville-Anderson-Mauldin HMA.Note: Current is based on 12-month averages through September 2017.Source: U.S. Bureau of Labor StatisticsFigure 2. Current Nonfarm Payroll Jobs in the Greenville HMA,*by SectorGovernment 14.6%Mining, logging, & construction 4.9%Manufacturing 13.9%Other services 3.5%Leisure & hospitality 10.3%Education & health services 11.8%Professional & business services 16.5%Wholesale & retail trade 15.7%Transportation & utilities 2.8%Information 1.7%Financial activities 4.4%* Greenville-Anderson-Mauldin HMA.Note: Current is based on 12-month averages through September 2017.Source: U.S. Bureau of Labor StatisticsTable 2. Major Employers in the Greenville HMA*Name of EmployerNonfarm Payroll SectorNumber ofEmployeesGreenville Health SystemMichelin North America, Inc.BI-LO, LLCBon Secours Health System, Inc.AnMed HealthClemson UniversityDuke Energy CorporationGeneral Electric CompanyFluor CorporationZF Friedrichshafen AG* Greenville-Anderson-Mauldin HMA.Note: Excludes local school districts.Source: Upstate SC Alliance, 2017Education & health servicesManufacturingWholesale & retail tradeEducation & health servicesEducation & health servicesGovernmentTransportation & utilitiesTransportation & utilitiesProfessional & business 143,3003,2002,4002,400Greenville Memorial Hospital, adding 15 additional patient rooms. The72-bed Patewood Memorial Hospitalopened in 2007 and expanded to offerobstetric services in 2017. GHS is thelargest employer in the HMA with14,787 workers, and the healthcaresystems industry comprises three ofthe five largest employers in the HMA(Table 2).During the 12 months ending September 2017, nonfarm payrolls averaged412,300 jobs, up 4,100 jobs, or 1.0percent, from the previous 12-monthperiod (Table 3). Mining, logging,and construction payrolls led growth,increasing by 2,200 jobs, or 12.4percent. Commercial and residentialconstruction projects contributed tothe increase. The shuttered cottonmills provided an opportunity forredevelopment into mixed-use andresidential communities. Historic andrevitalization tax incentives availableto redevelop abandoned mills in theHMA make it attractive to developers. Examples of mills renovated to
4Economic Conditions ContinuedTable 3. 12-Month Average Nonfarm Payroll Jobs in the GreenvilleHMA,* by SectorG r e e n v i l l e - A n d e r s o n - M a u l d i n , S C C O M P R E H E N S I V E H O U S I N G M A R K E T A N A LY S I S12 Months EndingTotal nonfarm payroll jobsGoods-producing sectorsMining, logging, & constructionManufacturingService-providing sectorsWholesale & retail tradeTransportation & utilitiesInformationFinancial activitiesProfessional & business servicesEducation & health servicesLeisure & hospitalityOther 01,100– 100– 200500– �� 0.9– 2.82.9– 2.40.81.02.10.8* Greenville-Anderson-Mauldin HMA.Notes: Numbers may not add to totals because of rounding. Based on 12-month averagesthrough September 2016 and September 2017.Source: U.S. Bureau of Labor Statisticsresidences include the Lofts at MillsMill condominiums in 2004 and theWest Village Lofts at Brandon Millapartments in 2016. Construction projects are also under way at ClemsonUniversity; the largest project is the 212.7 million Douthit Hills Village,which will include dormitories, dining,retail, and a student center. The projectis expected to be complete by thestart of the 2018–2019 school year. Inaddition to the construction impact,the university employed nearly 3,825people in 2016. The university had aneconomic impact of 1.6 billion onthe Greenville-Spartanburg-Anderson,SC combined statistical area in 2013(Clemson University).Other sectors with significant contributions to payroll gains during the past12 months include the wholesale andretail trade and the manufacturing sectors, which increased by 1,100 and 600jobs respectively, or 1.7 and 1.1 percentfrom a year earlier. Partially offsettingpayroll gains, the professional andbusiness services sector lost 1,700jobs, or 2.4 percent, compared withthe previous 12-month period. Theprofessional and business services sector is nearly 3 percent lower than theprevious peak in 2015. During 2016,all the jobs lost in the professional andbusiness services sector were in thetemporary help services.Some manufacturing firms seek toretain flexibility in production andeliminate unnecessary costs by hiringtemporary help workers, classifiedunder the professional and businessservices sector, to fill some manufacturing jobs. Because of these evolvingbusiness practices in manufacturing,the overall declines in manufacturingpayrolls since 1990 may be somewhatoverstated. A temporary workersubsequently hired on directly by themanufacturing firm would changepayroll classification (from the professional and business services sectorto the manufacturing sector) but notjob duties; anecdotal reports indicatethis shift occurs less frequently thanmanufacturing workers replaced bytemporary help workers. In 2004,approximately one-third of temporary
workers work in manufacturing (Economic Report of the President, 2004). A2011 report stated, “Both the growthin professional and business servicesand the decline in manufacturingappear to have reflected manufacturing firms’ new staffing practices ofheightened firing of full-time employees and greater use of temporaryworkers as replacements into thosevacated core manufacturing slots.Hired via temporary help agenciesrather than the manufacturer, thesenew workers were then classified astemporary service workers rather thanmanufacturing employees, thoughthey might have been doing identicalwork” (The Brookings Institution,Responding to Manufacturing Job Loss:What Can Economic Development PolicyDo?, 2011).The unemployment rate during the 12months ending September 2017 was3.8 percent, down from 4.6 percentduring the previous 12-month period.Figure 3 shows trends in labor force,resident employment, and the unemployment rate in the HMA from 2000through 2016. Growth in residentemployment outpaced growth inthe labor force, contributing to thedecrease. The unemployment rate declined from the peak 10.5-percent ratein 2009 during the Great Recession.During the next 3 years, nonfarmpayrolls are expected to increasean average of 1.2 percent annually.Construction employment is expectedto contribute to the growth withcontinued redevelopments at formercotton mills. Preliminary work is under way at commercial projects withinWoodside Mill and Judson Millmixed-use redevelopments; residentialplans are still being finalized. In addition, ongoing projects at ClemsonUniversity will support growth in construction payrolls. Manufacturing isalso expected to continue to increase,following an additional expansionannounced at the BMW factoryin the city of Spartanburg, whichwill increase demand at automotivesuppliers in the HMA. The wholesaleand retail trade and the education andhealth services sectors are expected toincrease to support the needs of thegrowing population.Resident employment* Greenville-Anderson-Mauldin HMA.Source: U.S. Bureau of Labor bor mployment rateUnemployment rateFigure 3. T rends in Labor Force, Resident Employment, and Unemployment Rate in the Greenville HMA,* 2000 Through 2016Labor force andresident employmentG r e e n v i l l e - A n d e r s o n - M a u l d i n , S C C O M P R E H E N S I V E H O U S I N G M A R K E T A N A LY S I S5Economic Conditions Continued
6Population and HouseholdsG r e e n v i l l e - A n d e r s o n - M a u l d i n , S C C O M P R E H E N S I V E H O U S I N G M A R K E T A N A LY S I SThe population in the GreenvilleHMA is estimated at 898,800,an average increase of 9,950, or 1.2percent annually since 2010. Approximately 56 percent of the HMApopulation lives in Greenville County,which includes Greenville, the largestcity and economic center of theHMA. Anderson County is thesecond most populous county in theHMA, comprising 22 percent of theHMA population, and Pickens andLaurens Counties account for 14 and8 percent respectively.Net in-migration comprises the largestshare of population growth in theHMA; however, it fluctuates witheconomic growth. From 2000 to2005, during the first recession andinitial stages of recovery, the population increased by an average of 7,125,or 1.0 percent, annually (CensusBureau decennial census and population estimates as of July 1). Netin-migration averaged 4,050 people,or 57 percent of population growth.From 2005 to 2008, populationgrowth accelerated; during most ofthis period, the economy grew morestrongly. The population increased byan average of 15,250, or 2.0 percent,annually. Net natural change (residentbirths minus resident deaths) increased slightly, but the largest shareof the population increase was fromnet in-migration, which surged to11,200 people annually, or 73 percentof population growth. As a result ofthe Great Recession, populationgrowth slowed from the previousexpansion. From 2008 to 2010, thepopulation increased by 8,775, or 1.1percent, annually. Net natural changeslowed to an average of 3,700 peopleannually, but net in-migration fell toan average of 5,075 people annually.During the early stages of recoveryfrom 2010 to 2013, the populationgrowth slowed further to average 7,775people, or 0.9 percent, annually. Despitea slight increase in net in-migration toaverage 5,100 people annually, netnatural change decreased to an averageof 2,675 people annually, which causedthe further slowdown in populationgrowth. Because of the strongereconomic growth in recent years,population growth increased again toaverage 11,650 people, or 1.3 percent,annually from 2013 to the currentdate. This economic recovery did nothave as strong of an impact on netin-migration as the previous recovery,in part, because residents in the HMAreentering the labor force took jobs.Net in-migration averaged 9,175people annually, however, comprising79 percent of population growth.The adjacent Spartanburg, SC MSAhas attracted the largest share ofpeople moving out of the HMA since2010, comprising 12 percent ofout-migrants from the HMA (2011–2015 American Community Survey[ACS] 5-year estimates). Spartanburghad a similar economic recovery fromthe most recent recession, but theaverage home price in the Spartanburg, SC MSA is nearly 25 percentlower than in the Greenville HMAand within a commutable distance.The Columbia, SC MSA contributed7 percent of the people moving intothe Greenville HMA, which was thelargest share of any MSA, in part,because the economic recovery in theColumbia, SC MSA lagged that ofthe Greenville HMA.Clemson University enrolled approximately 24,375 students during the fall2017 semester (Clemson University,Office of Institutional Research), andcontributes to net in-migration byattracting students from outside the
7Population and Households ContinuedFigure 4. Number of Households by Tenure in the GreenvilleHMA,* 2000 to nt2010RenterOwner* Greenville-Anderson-Mauldin HMA.Note: The current date is October 1, 2017.Sources: 2000 and 2010—2000 Census and 2010 Census; current—estimates byanalystFigure 5. Population and Household Growth in the GreenvilleHMA,* 2000 to ForecastAverage annual change12,00010,0008,0006,0004,0002,00002000 to 20102010 to currentPopulationHouseholdsFigure 6. Components of Population Change in the GreenvilleHMA,* 2000 to 00002000 to 20102010 to currentNet natural changeAn estimated 363,500 householdsreside in the HMA. The number ofhouseholds increased by an averageof 3,975, or 1.2 percent, annuallysince 2010. The homeownership ratedeclined, following national trendsand the housing crisis, as householdshave increasing preferences to rent.Currently, an estimated 64.3 percentof households own their homes,down from 69.0 percent in 2010.Figure 4 shows the number ofhouseholds by tenure in the HMAsince 2000.Current to forecast* Greenville-Anderson-Mauldin HMA.Notes: The current date is October 1, 2017. The forecast date is October 1, 2020.Sources: 2000 and 2010—2000 Census and 2010 Census; current and forecast—estimates by analystAverage annual changeG r e e n v i l l e - A n d e r s o n - M a u l d i n , S C C O M P R E H E N S I V E H O U S I N G M A R K E T A N A LY S I S0HMA. Clemson University studentscomprise less than 3 percent of thepopulation but approximatelyone-third of students come from outof state. Enrollment increased anaverage of 3 percent annually since2010.Current to forecastNet migration* Greenville-Anderson-Mauldin HMA.Notes: The current date is October 1, 2017. The forecast date is October 1, 2020.Sources: 2000 and 2010—2000 Census and 2010 Census; current and forecast—estimates by analystDuring the next 3 years, the population and households are expected toincrease by an annual average of11,000 and 4,200 respectively, or 1.2percent each (Figure 5). Net inmigration is expected to comprisenearly 80 percent of the populationgrowth, similar to recent trends(Figure 6). The number of studentsenrolled at Clemson University isexpected to increase approximately3 percent annually.
8Housing Market TrendsG r e e n v i l l e - A n d e r s o n - M a u l d i n , S C C O M P R E H E N S I V E H O U S I N G M A R K E T A N A LY S I SSales MarketThe sales housing market in theGreenville HMA has improvedsignificantly from soft conditions in2010, and conditions are currentlytight, with an estimated vacancy rateof 0.9 percent compared with 2.9 percent in 2010 (Table DP-1 at the endof this report). Recent economic andpopulation growth contributed to theabsorption of excess inventory, in addition to subdued home constructionsince 2008. The inventory of homesfor sale represented a 4.6-monthsupply in September 2017, up froma 4.1-month supply a year earlier(Greater Greenville Association ofRealtors ). The average sales pricefor all homes sold, including new andexisting single-family homes, townhomes, and condominiums, increased8 percent during the 12 months endingAugust 2017 to 186,250 comparedwith a year earlier (CoreLogic, Inc.,with adjustments by the analyst). Thenumber of homes sold during the past12 months also increased 8 percent to20,150 sales.During the 12 months ending August2017, 17,300 existing homes sold,which includes regular resale and realestate owned (REO) single-familyhomes, townhomes, and condominiumsales, an increase of nearly 7 percentfrom a year earlier (CoreLogic, Inc.,with adjustments by the analyst).Existing home sales remain 17 percentbelow the previous peak of 20,700homes sold in 2006. From 2001through 2006, existing home salesincreased 5 percent annually. Existinghome sales declined leading up tothe national housing crisis and GreatRecession, and the declines continuedinto the early stages of the economicrecovery. From 2007 through 2011,home sales decreased an average of13 percent annually to 10,300 homessold. Then, as the economy strengthened and buyer confidence increased,home values showed strong signs ofrecovery, and access to credit returned.Existing home sales increased again,averaging 9-percent gains annuallyfrom 2012 through 2016.The housing recovery in the HMA ledto a reduction in the REO inventoryand absorption of the excess regularresale homes that were available duringthe soft housing market in 2010. Theshare of existing home sales that wereREO sales peaked at an average of 21percent in 2010 and 2011 and gradually decreased to 5 percent duringthe 12 months ending August 2017.The share of seriously delinquentmortgages (loans that are 90 or moredays delinquent or in foreclosure)and REO properties also decreased.In August 2017, 1.8 percent of homeloans were seriously delinquent orhad transitioned into REO status,down from 2.3 percent a year earlier.Mortgages with this status peaked at6.3 percent in February 2010. Therate in the HMA remains lower thanthe national rate of 2.2 percent andstayed below the national peak of 8.6percent.During the 12 months endingAugust 2017, the average price of anexisting home increased 8 percent to 174,950. The average price of anexisting home previously peaked at 140,400 in 2007, before decreasingan average of 4 percent annually to alow of 129,150 in 2009. The averagesale price remained flat in 2010 but,beginning in 2011, increased an average of 4 percent annually to 167,300in 2016. In 2013, the average existingsales price surpassed the previouspeak from 2007.
Sales Market ContinuedSales of new homes in the HMAcontinue to increase following theeconomic recovery. Trends are similarto existing home sales trends but morepronounced, because new home salesare relatively small in volume comparedwith the number of existing homessold. The recovery in new home saleslagged the economic recovery some what due to reduced h omebuildingactivity, but the lower levels of con struction helped the market absorbthe previous excess supply of existinghomes. During the 12 months endingAugust 2017, 2,850 new homes sold,up 17 percent from a year earlier. Newhome sales comprise about 14 percentof all homes sold in the HMA, whichis similar to the 15-percent rate from2000 through 2003, when an averageof 2,925 new homes sold annually.New home sales increased an averageof 57 percent annually from 2004through 2006 to 4,500 homes sold,while the economy was expanding,and population growth was strong.New home sales averaged 17 percentof all home sales in the HMA duringthis period. From 2007 through 2011,however, new home sales decreasedan average of 24 percent annually.New home sales bottomed out in2011, when fewer than 1,175 newhomes sold, which was 10 percent ofFigure 7. Single-Family Homes Permitted in the Greenville HMA,*2000 to Current7,0006,0005,0004,0003,0002,0001,0001716* Greenville-Anderson-Mauldin HMA.Notes: Includes townhomes. Current includes data through September 2017.Sources: U.S. Census Bureau, Building Permits Survey; estimates by 00604020320202001202000020G r e e n v i l l e - A n d e r s o n - M a u l d i n , S C C O M P R E H E N S I V E H O U S I N G M A R K E T A N A LY S I S9Housing Market Trendsall home sales. From 2012 through2016, new home sales increased anaverage of 17 percent annually. Newhome sales remain 37 percent belowthe previous peak in 2007. Duringthe 12 months ending August 2017,the average price of a new home was 256,700, up 5 percent from a year earlier. The average price of a new homeonly recovered during the past year;the price is less than 5 percent higherthan the previous peak of 245,200 in2008.Overbuilding at the start of the2000-through-2009 decade contributed to soft sales market conditions,which only recently alleviated. From2000 through 2005, single-familyhomebuilding, as measured by homespermitted, increased an average of6 percent annually to nearly 6,400homes permitted in 2005 (annualpermits data, with adjustments bythe analyst). Homebuilding activity,in response to the soft sales market,began to decline in 2006 despite thesurge in net in-migration. From 2006through 2009, single-family homespermitted decreased an average of28 percent annually, and from 2009through 2011, homebuilding activityremained subdued, averaging 1,800homes a year. The sales housingmarket has been able to recover,because single-family homebuildingactivity, though increasing, remainsbelow the levels at the beginningof the past decade, allowing excesshomes to be absorbed by the growingpopulation. From 2012 through 2016,single-family homebuilding increased17 percent annually to 4,225 homespermitted. Home constructionremains well below the previouspeak. During the 12 months endingSeptember 2017, 4,650 homes werepermitted, up 13 percent from a
G r e e n v i l l e - A n d e r s o n - M a u l d i n , S C C O M P R E H E N S I V E H O U S I N G M A R K E T A N A LY S I S10Housing Market TrendsSales Market Continuedyear earlier (preliminary data, withadjustments by the analyst). Figure 7shows single-family homes permittedin the HMA since 2000. Homebuilding in the HMA is primarily inGreenville County, the location of theprincipal city of Greenville and muchof the population and job growth.In southern Greenville County, theTable 4. Estimated Demand for New Market-Rate Sales Housing inthe Greenville HMA* During the Forecast PeriodPrice Range ( )FromToUnits ofDemandPercentof ,999449,999549,999and higher4,9003,7501,25031021047.036.012.03.02.0* Greenville-Anderson-Mauldin HMA.Notes: The 2,000 homes currently under construction in the HMA will likely satisfy someof the forecast demand. The forecast period is October 1, 2017, to October 1, 2020.Source: Estimates by analyst107-lot Coventry subdivision in thecity of Simpsonville began construction in summer 2017. Approximately30 homes are under way, with pricesstarting at 205,700 for a threebedroom home with two bathrooms.During the next 3 years, demandfor 10,400 new homes is expected(Table 1). The 2,000 homes currentlyunder construction will fill part ofthe demand. Nearly one-half of thedemand will be for homes pricedbelow 250,000 (Table 4). Demandfor new homes will be primarily inGreenville County, which has most ofthe population and jobs, but the othercounties in the HMA offer somejob opportunities and have moreaffordable home prices, which will beattractive to some buyers.Rental MarketRental housing market conditions in the Greenville HMA arecurrently slightly tight, with anestimated vacancy rate of 4.4 percent.The rental market has tightenedsignificantly since soft marketconditions in 2000 and 2010, whenthe vacancy rate exceeded 11 percent(Figure 8). Approximately 54 percentof renter households in the HMAlive in single-family homes or mobileFigure 8. Rental Vacancy Rates in the Greenville HMA,* 2000 to urrent* Greenville-Anderson-Mauldin HMA.Note: The current date is October 1, 2017.Sources: 2000 and 2010—2000 Census and 2010 Census; curr
Name of Employer Nonfarm Payroll Sector Number of Employees Greenville Health System Education & health services 14,787 Michelin North America, Inc. Manufacturing 7,120 BI-LO, LLC Wholesale & retail trade 4,600 Bon Secours Health System, Inc. Education & health services 3,985 . Upstate SC Alliance, 2017: Greenville Memorial Hospital, add-ing .