Transcription
Aberrant Functional Connectivity in Resting StateNetworks of ADHD Patients Revealed byIndependent Component Analysis(ICA)Huayu ZhangShandong University of Science and TechnologyYue ZhaoShandong University of Science and Technology and Shandong First Medical University & ShandongAcademy of Medical SciencesWeifang CaoShandong First Medical University & Shandong Academy of Medical SciencesDong CuiShandong First Medical University & Shandong Academy of Medical SciencesQing JiaoShandong First Medical University & Shandong Academy of Medical SciencesWeizhao LuShandong First Medical University & Shandong Academy of Medical SciencesHongyu LiShandong University of Science and TechnologyJianfeng Qiu ( jfqiu100@gmail.com )Shandong First Medical University & Shandong Academy of Medical Sciences https://orcid.org/00000002-8049-3743Research articleKeywords: fMRI; RSNs; ADHD; functional connectivity; ICA.Posted Date: November 4th, 2019DOI: https://doi.org/10.21203/rs.2.16761/v1License: This work is licensed under a Creative Commons Attribution 4.0 International License.Read Full LicenseVersion of Record: A version of this preprint was published on September 18th, 2020. See the publishedversion at https://doi.org/10.1186/s12868-020-00589-x.Page 1/20
AbstractBackground:ADHD is one of the most common psychiatric disorders in children and adolescents. Alteredfunctional connectivity has been associated with ADHD symptoms. This study aimed to investigateabnormal changes in the functional connectivity of resting-state brain networks (RSNs) amongadolescent patients with different subtypes of ADHD. Methods: The data were obtained from the ADHD200 Global Competition, including fMRI data from 88 ADHD patients (56 patients of ADHD-Combined,ADHD-C and 32 patients of ADHD-Inattentive, ADHD-I) and 67 Typically-Developing Controls (TD-C).Group ICA was utilized to research aberrant brain functional connectivity within different subtypes ofADHD. Results: Compared with TD-C group, the clusters of decreased functional connectivity were locatedin the left inferior occipital gyrus (p 0.0041) and right superior occipital gyrus (p 0.0011) of DAN,supplementary motor area (p 0.0036) of ECN, left supramarginal gyrus (p 0.0081) of SN, middletemporal gyrus (p 0.0041) and superior medial frontal gyrus (p 0.0055) of DMN in ADHD-C group. In theADHD-I group, decreased functional connectivity was found in the right superior parietal gyrus (p 0.0017)of DAN and left middle temporal gyrus (p 0.0105) of DMN. The decreased functional connectivity ofADHD-C group was found in superior temporal gyrus (p 0.0062) of AN, inferior temporal gyrus(p 0.0016) of DAN, dorsolateral superior frontal gyrus (p 0.0082) of DMN compared to ADHD-I group. Allthe clusters surviving at p 0.05 (AlphaSim correction). Conclusion: The results suggested that decreasedfunctional connectivity within the DMN and DAN was responsible, at least in part, for the symptom ofinattention in ADHD-I patients. Similarly, we believed that the impaired functional connectivity withinnetworks may contribute to the manifestations of ADHD-C patients, including inattention,hyperactivity/impulsivity, and unconscious movements.BackgroundAttention-deficit/ hyperactivity disorder (ADHD) emerges as a common contributor toneurodevelopmental disorders, as well as frequent psychological and behavioral problems amongchildren (1). The global prevalence of ADHD is about 5.29%. According to the previous studies, anyvariation in prevalence estimates was caused by the methodological characteristics of differentresearches, instead of the discrepancies in the actual distribution of ADHD (2). There are a great numberof adolescent ADHD patients in the world, thus it is very important for the management and treatment ofADHD patients. ADHD is mainly characterized by symptoms of inattention, impulsivity, andhyperactivity.The current practice in the diagnosis of ADHD is mainly according to the levels ofsymptoms listed in DSM-IV (3) and is usually conducted by the parents or teachers, which is subjective.Typically, ADHD can be categorized into three subtypes: hyperactive-impulsivity (ADHD-HI), persistentinattention (ADHD-I), and a combination of both (ADHD-C) (4, 5). This disorder is often accompanied bylearning difficulties or conduct disorders (6, 7), which can greatly affect the interpersonal skills andacademic performance of patients who suffer from it. Many studies have pointed out that the subjectivediagnosis is difficult to draw a line between normal level and the level of ADHD symptoms that needPage 2/20
treatment (8). Thus, the researches of the objective diagnosis of ADHD are of great significance. And theresearches of ADHD have become a hot topic in medicine and psychology in recent years.In previous studies, resting-state functional MRI (rs-fMRI) has been widely used to examine the brain ofADHD patients (9, 10).In studies of brain function using rs-fMRI,abnormalities were found in theprefrontal cortex, anterior cingulated cortex, putamen, temporal cortex, and cerebellum (11, 12).The rsfMRI has become a research hotspot among more and more scientists, it has achieved obvious results inmany fields, such as neuroscience, spiritual science, biological science, and statistics, and it is helpful forthe diagnosis and treatment of ADHD (13, 14).A growing literature shows that communicationabnormalities among and within neural networks may underlie ADHD (15). Rs-fMRI can effectivelyidentify such network abnormalities, and it's unconstrained yet reliable. In rs-fMRI experiments, subjectsare awake and are asked to simply rest while lying in the MRI scanner, so brain activity can be considered‘spontaneous’ rather than stimulus- or task-driven. As previously mentioned, most researchers focused onDMN, while less attention was paid to other brain networks or differences between two types of ADHD.So, we speculated that auditory network(AN), dorsal attention network (DAN), executive control network(ECN), salience network (SN), and sensorimotor network (SMN) are also related to ADHD, and wecompared the differences in the functional connectivity (FC) of six resting-state brain networks (RSNs)between two ADHD subtypes.In the present study, the Group ICA, a data-driven approach, was adopted to extract the components (16).Independent component analysis (ICA) is a widely used method for the statistical analysis of fMRI data(17, 18). Without any prior information, this method can effectively determine the functionalcharacteristics of mutually correlated brain components (19).We hope to find out the differences in theseRSNs among patients with different subtypes of ADHD by comparing the FC of the six RSNs between thethree groups.We speculate that the symptoms of ADHD patients are associated with abnormal FC ofthese RSNs.Methods2.1 SubjectsPublic fMRI data were downloaded from the ADHD-200 GlobalCompetition(http://fcon 1000.projects.nitrc.org/indi/adhd200/index.html) and selected exclusively fromthe New York University (NYU)Child Study Center. In accordance with HIPAA guidelines and 1000Functional Connectomes Project protocols, all datasets are anonymous, with no protected healthinformation included. For both ADHD and TD subjects, the inclusion criteria included: an age of 7–17years, no history of neurological disease, and no diagnosis of either schizophrenia or affective disorder,an image covering at least 95% of the brain, and an IQ score 80, and head movement is less than 2.0.Subjects were enrolled if they were right-handed and the information was complete (e.g., age, Verbal IQ, orPerformance IQ). Finally, fMRI data from a total of 155 volunteers aged between 7 and 17 were collected,including 67 Typically-Developing Controls (TD-C), 56 ADHD-C patients and 32 ADHD-I patients (thePage 3/20
number of ADHD-HI group was too small to be studied). IBM SPSS software (Armonk, NY, v. 22.0) wasused for statistical analysis. One-way analysis of variance was performed on age, ADHD index, verbal IQ,performance IQ, and Full IQ, and chi-square test was used to evaluate the difference of gender among 3groups, a p-value of 0.05 was considered statistically significant, as shown in Table 1. The symptoms ofADHD were assessed using the Conners Parent Rating Scale-Revised, Long version (CPRS-LV).The fMRI data were acquired using a single-shot echo-planar imaging (GRE-EPI) sequence with thefollowing imaging parameters: repetition time (TR) 2000 ms; echo time (TE) 15 ms; flip angle (FA) 90o;FOV read 240 mm; slice thickness 4 mm; number of slices 33; and voxelsize 3 3 4 mm3, time points 176, acquisition matrix 80 80.2.2 Data preprocessingThe original data of fMRI were preprocessed by using a public toolbox named DPABI (for DataProcessing & Analysis of Brain Imaging, http://rfmri.org/dpabi). The preprocessing steps were as follows:1) Remove the first 10 volumes to ensure that the BOLD signal was stable; 2) Slice Timing, correct thedifference due to the acquisition time between slices in the volume; 3) head motion correction; 4)Normalization, the data were registered to the EPI standard template and resampled to 3.0*3.0*3.0mm3,5) spatial smoothing with a 6 mm full width at half maximum (FWHM) Gaussian kernel (20). Subjectswhose head movement exceeded 2.0mm were excluded.2.3 ICA and Determine RSNsWe conducted group independent component analysis (ICA) using Group ICA/IVA of fMRI Toolbox (GIFT,http://mialab.mrn.org/software/). We chose ICA because of its effectiveness at separating signal fromnoise (21). Six independent components (ICs) were selected as corresponding to major RSNs. The usedgroup ICA approach and tests with simulation data are described in detail in publications by the researchgroup of Dr. Calhoun (22, 23, 24). This toolbox implements a group approach comprising estimation ofthe independent components (ICs) on concatenated data and followed by a computation of the subjectspecific spatial maps and time courses (25). Usually, there are three main steps: (a) compression of thedata; (b) estimation of the ICs in an aggregate dataset; (c) back reconstruction of the ICs.Regarding the data reduction, the dimensionality of the data was reduced using principal componentsanalysis (PCA). The number of independent hemodynamic sources was estimated using the minimallength description criterion (MLD), indicating 20 ICs for our functional dataset, which is sufficient tocapture the most frequently observed large-scale resting-state networks (26). Then, using the Infomaxalgorithm, which was repeated 20 times in the ICASSO to obtain a more reliable estimation result,maximally independent components were estimated, and the data were transformed into a linear mixingmatrix and 20 ICs. The individual ICs were back reconstructed by multiplying the section of datacorresponding to each subject by that mixing matrix. The ICs were then transformed to z score values,which provide an index of the degree of synchronization of the BOLD signal in that voxel with the timecourse of the relevant component.Page 4/20
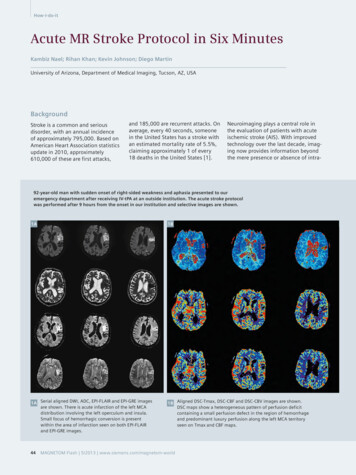
The RSNs components were subsequently selected via an automated process that defines thecomponents that most closely matched the RSNs for each individual subject, based on spatial correlationanalyses with the RSNs templates. All templates represent regions that have repeatedly been implicatedin the RSNs.There were six RSNs of our interest, including auditory network (AN), dorsal attention network (DAN),default mode network (DMN), executive control network (ECN), salience network (SN), and sensorimotornetwork (SMN). All RSN templates were created by virtue of WFU PickAtlas(https://www.nitrc.org/projects/wfu pickatlas/) in the SPM toolbox based on centroid coordinates andradii. The component with the largest correlation coefficient was selected as the RSN we interested in.Totally, six components were identified. In order to verify whether the 6 ICs of each group were zero, a onesample t-test was performed and according to the settings in the previous study (27), we set a thresholdof p 0.05. As shown in Figure 1.2.4 Statistical AnalysisAccording to the number of the original subjects, the selected ICs (z-score value) were reclassified intothree groups. The Resting-State fMRI Data Analysis Toolkit plus V1.2 (RESTplus V1.2,http://restfmri.net/forum/RESTplusV1.2) was the toolbox of our choice for statistical analysis. In order toverify whether the six ICs differed between the three groups, Analysis of Variance (ANOVA) on ICs(AlphaSim correction, P 0.05) was performed with the result of one-sample t-test as an explicit mask,where age and gender were controlled as covariates. The differences between the groups of ICs wereobtained by two-sample t-test (AlphaSim correction, P 0.05, Cluster 10) with the result of ANOVA as anexplicit mask. Similarly, age and gender were eliminated as covariates. Finally, a Spearman correlationanalysis was performed between the ADHD index and mean signals of ICs that we delineated as ROIs.Results3.1 ANOVA showed differences between the three groupsThe ANOVA results for all ICs were shown in Figure 2 and Table 2, it shows the brain regions where theremay be differences between the six ICs in the three groups of subjects.The regions depicted in red-yellowshowed in Fig 2 indicated that there were differences in RSNs between the three groups. The F values andp values of the most significant difference in each RSN were shown in Table 2.As shown in Fig 2, brainregions with significant differences appeared in superior temporal gyrus of AN,superior parietal gyrus andoccipital lobe of DAN, middle temporal gyrus and superior medial frontal gyrus of DMN, supplementarymotor area of ECN, precentral gyrus of SMN, as well as supramarginal gyrus of SN.3.2 Comparison between groupsThe results of two-sample t-test were shown in Table 3, which shows the differences between the groupsof 6 ICs.Page 5/20
3.2.1 The differences between ADHD-C and TD-CCompared with the TD-C group, decreased FC was found in DAN, ECN, SN, and DMN of the ADHD-C group(shown in Figure 3). The clusters of weaker connectivity were located in the left inferior occipital gyrus(p 0.0041) and right superior occipital gyrus (p 0.0011) of DAN, supplementary motor area (p 0.0036)of ECN, left supramarginal gyrus (p 0.0081) of SN, middle temporal gyrus (p 0.0041) and superiormedial frontal gyrus (p 0.0055) of DMN, with all areas surviving at p 0.05 (AlphaSim correction).However, the RSNs with considerably enhanced FC in ADHD-C were not observed.3.2.2 The differences between ADHD-I and TD-CAccording to the areas shown in Figure 4, decreased FC was found in the ADHD-I patients in comparisonto TD-C group, including the right superior parietal gyrus (p 0.0017) of DAN and the left middle temporalgyrus (p 0.0105) of DMN. In contrast, stronger FC was observed within three RSNs, including thesupramarginal gyrus (p 0.0027) of AN, the precentral gyrus (p 0.0024) of SMN and the medial frontalgyrus (p 0.0265) of DMN.3.2.3 The differences between ADHD-C and ADHD-ICompared to ADHD-I group, the weaker FC was mainly distributed in the superior temporal gyrus (0.0062)of AN, inferior temporal gyrus (p 0.0016) of DAN, as well as dorsolateral superior frontal gyrus(p 0.0082) of DMN. However, an increase in the FC was found in middle temporal gyrus (p 0.0051) ofDMN, as illustrated in Figure 5.3.3 Correlation AnalysisThe above results have demonstrated a significant area of FC abnormalities in RSNs in ADHD patients. ASpearman correlation analysis was performed between ADHD index and mean signals of ICs that wedelineated as ROIs, in order to verify whether the ADHD index of the two groups of ADHD patients wasassociated with FC abnormalities. All the correlation analysis was performed in the ADHD-C and ADHD-Igroup. Opposite relationship with ADHD index was only found in the left supplementary motor area ofECN in the ADHD-C group (r -0.267, p 0.047). And there was no significant difference in this result (p 0.05) after a multiple comparison correction.DiscussionIn this research, the Group ICA was performed and both subtypes of ADHD patients showed impaired FCin major RSNs compared with TD-C. We found that the FC of the DAN, ECN, SN, and DMN wassignificantly reduced in ADHD-C patients, including the right inferior occipital gyrus and the superioroccipital gyrus of DAN, supplementary motor area of ECN, left supramarginal gyrus of SN, middletemporal gyrus and superior medial frontal gyrus of DMN.Page 6/20
Many previous studies have demonstrated that there were abnormal functional connections within theDMN of ADHD patients, especially the temporal lobe (28, 29, 25). DMN is a commonly used brain networkin fMRI studies and is considered to be associated with a wide range of neuropsychiatric diseases (30). Inour study, compared with TD-C group, both subtypes of ADHD patients showed reduced FC in theoccipital lobe of DAN and the middle temporal gyrus of DMN. However, in the superior medial frontalgyrus of DMN, the two groups performed inversely. Although people believed the opposite trend in DMNand DAN activity (31, 32), Matthew L. Dixon proved that there is no anticorrelation between somesubsystems and DMN (33). These could explain our findings that reduced FC occurred simultaneously inDAN and DMN. There were also differences in FC between the two groups of ADHD subtypes. Patientswith ADHD-C showed more reduced FC, such as inferior temporal gyrus of DAN and superior frontal gyrusof DMN. Only a portion of the middle temporal gyrus of DMN has shown an enhanced FC. The oneexplanation of the difference may be the diverse clinical symptoms between the two subtypes of ADHDpatients. DMN activates more when people remain silent or rest state (30). While DAN is routinelyactivated when people perform attention-demanding cognitive tasks (34). Thus, we speculated thatabnormal changes in FC exhibited by DMN and DAN may be related to attention deficit in ADHD patients,which has been proven by some previous research (35, 36).When comparing the ADHD-I to the TD-C group, we found that there were a few regions showingenhanced FC, such as supramarginal gyrus of AN and precentral gyrus of SMN. Previous studies havefound that patients with ADHD were more sensitive to sound, which may be related to the enhanced FC inAN (5). Jean-Arthur has reported that ADHD patients had perceptual inundation (37). To our bestknowledge, there are few studies focused on the changes of AN and SMN. And few voxels in theseregions were found in our study, which may be due to differences in sample size. Thus, we have not mademore discussions about these regions.Daniel von Rhein proved that SN plays a role in supervision and decisionwhen the brain processesexternal stimulus (27). The main functions of the SN are to integrate information from differentmodalities such as sensory information and bodily states in order to establish goal-directed behavior andto process emotion-related information. Combined with our findings, the reduced FC of the SN in ADHD-Cpatients just confirmed the conclusion of Daniel von Rhein (27). In addition, it has been demonstratedthat the ECN participated in multiple advanced cognitive tasks and played an important role in adaptivecognitive control (38). The decreased FC in ECN may explain why ADHD-C patients fail to control theiremotions and exhibit impulsive aggression or other conduct disorders (39, 40). Two subtypes of ADHDpatients also differ in FC of ECN. In the ADHD-C group, superior frontal gyrus of ECN showed weaker FC.We speculate that this change may explain why ADHD-C patients are more hyperactive than ADHD-Ipatients.ConclusionsIn conclusion, group ICA was interrelated analytical methods employed in the present study for evaluatingFC of ADHD in adolescents. We found these major RSNs in both subtypes of ADHD patients showed FCPage 7/20
changes compared with TD-C group, and there were also differences in FC between the two subtypes ofADHD patients. Our study is good at understanding the abnormal changes in the resting state network ofdifferent subtypes of adolescent ADHD patients, which is helpful for the management of adolescentADHD patients. In the future, the researches combined multi-model imaging, such as structural MRI,diffusion tensor imaging and fMRI, were necessary to comprehensively investigate the brain changes inadolescents with ADHD. These further researches will contribute to the management and treatment ofADHD in adolescents.LimitationsIn this study, one of the limitations of our study was the absence of any psychological assessment ofcognitive parameters associated with ADHD. And there was a big difference in the number of the threegroups, which was likely to have an impact on the results of statistical analysis. On the other hand, thesix RSN templates were created by WFU PickAtlas in the SPM toolbox directory based on centroidcoordinates and radii. There must be a certain difference between our templates and the actualanatomical RSNs, which would affect the accuracy of results.AbbreviationsADHD: attention-deficit/ hyperactivity disorderADHD-C: ADHD-CombinedADHD-HI: ADHD-Hyperactive-impulsivityADHD-I: ADHD-InattentiveAN: auditory networkDAN: dorsal attention networkDMN: default mode networkDSM-IV: the fourth edition of the Diagnostic and Statistical Manual of Mental DisordersECN: executive control networkFA: flip angleFC: functional connectivityFOV: field of viewHIPAA: Health Insurance Portability and Accountability ActPage 8/20
ICA: independent component analysisMRI: magnetic resonance imagingROI: region of interestrs-fMRI: resting-state functional MRIRSNs: resting-state brain networksSMN: sensorimotor networkSN: salience networkTD-C: typically-developing controlsTE: echo timeTR: repetition timeDeclarationsEthics approval and consent to participate:In accordance with HIPAA guidelines and 1000 FunctionalConnectomes Project protocols, all datasets are anonymous, with no protected health informationincluded.Consent for publication: Not applicable.Availability of data and material: The datasets analysed during the current study are available in the[ADHD-200 Global Competition] repository, [http://fcon mpeting interests: The authors declare that they have no competing interests.Funding: This study was supported by grants from National Key Research and Development Program(2016YFC0103400) and J. Qiu was supported by the Taishan Scholars Program of Shandong Province.The funders had no role in study design, data analysis, decision to publish, or preparation of themanuscript.Authors' contributions: HYZ and YZ were major contributors in writing the manuscript. HYL and JFQconceived and designed the experiments.The other authors played an important role in data analysis.Allauthors read and approved the final manuscript.Acknowledgements: We thank the ADHD-200 Consortium and the ADHD-200 Global Competitionorganizers for their work and sharing their data generously.Thanks for the support of National KeyPage 9/20
Research and Development Program (2016YFC0103400), and J. Qiu was supported by the TaishanScholars Program of Shandong Province.References1Polanczyk G, de Lima MS, Horta BL, Biederman J, Rohde LA. The worldwide prevalence of ADHD:a systematic review and metaregression analysis. Am J Psychiatry. 2007; 164(6):942–8.2Kobel M, Bechtel N, Specht K, Klarhöfer M, Weber P, Scheffler K, Opwis K, Penner IK. Structural andfunctional imaging approaches in attention deficit/hyperactivity disorder: does the temporal lobe play akey role? Psychiatry Res. 2010;183(3):230-6. doi: 10.1016/j.pscychresns.2010.03.010. Epub 2010 Aug 10.3American Psychiatric Association. (1994). Diagnostic and Statistical Manual of Mental Disorder,4th Edn (Washington, DC: American Psychiatric Press; ).4Smith SM, Fox PT, Miller KL, Glahn DC, Fox PM, et al. Correspondence of the brain's functionalarchitecture during activation and rest. Proc. Natl. Acad. Sci. U.S.A. 2009;1060, 13040–13045. doi:10.1073/pnas.0905267106. Epub 2009 Jul 20.5Allen EA, Erhardt EB, Wei Y, Eichele T, Calhoun VD. Capturing inter-subject variability with groupindependent component analysis of fMRI data: a simulation study. Neuroimage. 2012 Feb 15;59(4):414159. doi: 10.1016/6Hoekzema E, Carmona S, Ramos-Quiroga JA, Richarte Fernández V, Bosch R, Soliva JC, Rovira M,Bulbena A, Tobeña A, Casas M, Vilarroya O. An independent components and functional connectivityanalysis of resting state fMRI data points to neural network dysregulation in adult ADHD. Hum BrainMapp. 2014 Apr;35(4):1261-72. doi: 10.1002.7ox MD, Snyder AZ, Vincent JL, Corbetta M, Van Essen DC, Raichle ME. The human brain isintrinsically organized into dynamic, anticorrelated functional networks. Proc Natl Acad Sci USA. 2005;102:9673–9678.8Dai Dai, Jieqiong Wang, Jing Hua, and Huiguang He. Classification of ADHD children throughmultimodal magnetic resonance imaging. Front Syst Neurosci. 2012; 6: 63. doi: 10.3389.9Tang C, Wei Y, Zhao J, Nie J.Different Developmental Pattern of Brain Activities in ADHD: A Studyof Resting-State fMRI.Dev Neurosci. 2018;40(3):246-257. doi: 10.1159/000490289.10Bos DJ, Oranje B, Achterberg M, Vlaskamp C1, Ambrosino S, de Reus MA, van den Heuvel MP,Rombouts SARB,Durston S. Structural and functional connectivity in children and adolescents with andwithout attention deficit/hyperactivity disorder.J Child Psychol Psychiatry. 2017 Jul;58(7):810-818. doi:10.1111/jcpp.12712. Epub 2017 Mar 10.Page 10/20
11Cao Q., Zang Y., Sun L., Sui M., Long X., Zou Q., Wang Y. (2006). Abnormal neural activity inchildren with attention deficit hyperactivity disorder: a resting-state functional magnetic resonanceimaging study. Neuroreport 17, 1033–1036. 10.1097/01.wnr.0000224769.92454.5d.12Tian L., Jiang T., Wang Y., Zang Y., He Y., Liang M., Sui M., Cao Q., Hu S., Peng M., Zhuo Y. (2006).Altered resting-state functional connectivity patterns of anterior cingulate cortex in adolescents withattention deficit hyperactivity disorder. Neurosci. Lett. 400, 39–43. 10.1016/j.neulet.2006.02.022.13Yoo JH, Kim D, Choi J, Jeong B. Treatment effect of methylphenidate on intrinsic functional brainnetwork in medication-naïve ADHD children: A multivariate analysis.Brain Imaging Behav. 2018Apr;12(2):518-531. doi: 10.1007/s11682-017-9713-z.14Silk TJ, Malpas C, Vance A, Bellgrove MA. The effect of single-dose methylphenidate on restingstate network functional connectivity in ADHD.Brain Imaging Behav. 2017 Oct;11(5):1422-1431. doi:10.1007/s11682-016-9620-8.15Shafritz, K.M., Marchione, K.E., Gore, J.C., Shaywitz, S.E., Shaywitz, B.A., 2004. The effects ofmethylphenidate on neural systems of attention in attention deficit/ hyperactivity disorder. AmericanJournal of Psychiatry 161, 1990–1997.16Beckmann CF, De Luca M, Devlin JT, Smith SM. Investigations into resting-state connectivity usingindependent component analysis. Philos Trans R Soc London. 2005;360(1457):1001–1013.17von Rhein D, Beckmann CF, Franke B, Oosterlaan J, Heslenfeld DJ, Hoekstra PJ, Hartman CA,Luman M, Faraone SV, Cools R, Buitelaar JK1, Mennes M. Network-level assessment of reward-relatedactivation in patients with ADHD and healthy individuals. Hum Brain Mapp. 2017;38(5):2359-2369. doi:10.1002/hbm.23522. Epub 2017 Feb 8.18Fox MD, Raichle ME. Spontaneous fluctuations in brain activity observed with functional magneticresonance imaging. Nat Rev Neurosci. 2007 Sep;8(9):700-11.19van de Ven VG, Formisano E, Prvulovic D, Roeder CH, Linden DE. Functional connectivity asrevealed by spatial independent component analysis of fMRI measurements during rest. Hum BrainMapp. 2004;22(3):165-78.20Shuo Miao, Junxia Han. Reduced Prefrontal Cortex Activation in Children with AttentionDeficit/Hyperactivity Disorder during Go/No-Go Task: A Functional Near-Infrared Spectroscopy Study.Front Neurosci. 2017; 11: 367. doi: 10.3389.21Elton A, Alcauter S, Gao W. Network connectivity abnormality profile supports a categoricaldimensional hybrid model of ADHD. Hum Brain Mapp. 2014 Sep;35(9):4531-43. doi: 10.1002.22Allen EA, Erhardt EB, Wei Y, Eichele T, Calhoun VD. Capturing inter-subject variability with groupindependent component analysis of fMRI data: a simulation study. Neuroimage. 2012 Feb 15;Page 11/20
59(4):4141-59. doi: 10.101623Calhoun VD, Adali T, Pearlson GD, Pekar JJ. A method for making group inferences fromfunctional MRI data using independent component analysis. Hum Brain Mapp. 2001 Nov;14(3):140-51.24Erhardt EB, Rachakonda S, Bedrick EJ, Allen EA, Adali T, Calhoun VD. Comparison of multi-subjectICA methods for analysis of fMRI data. Hum Brain Mapp. 2011 Dec; 32(12):2075-95. doi:10.1002/hbm.21170. Epub 2010 Dec 15.25Matthew L. Dixona, Jessica R. Andrews-Hannab, R. Nathan Sprengc, Zachary C. Irvingd, CaitlinMillsa, ManeshGirna, Kalina Christoff. Interactions between the default network and dorsal attentionnetwork vary across default subsystems, time, and cognitive states. NeuroImage Volume 147, 15February 2017, Pages 632-649.26Mueller A,Candrian G,Kropotov JD,Ponomarev VA,Baschera GM. Classification of ADHD patientson the basis of independent ERP components using a machine learning system. Nonlinear Biomed Phys.2010 Jun 3; 4 Suppl 1: S1. doi: 10.1186/1753-4631-4-S1-S1.27Valera EM, Faraone SV, Murray KE, Seidman LJ. Meta-analysis of structural imaging findings inattention-deficit/hyperactivity disorder. Biol Psychiatry. 2007; 610, 1361–1369.28De Martino F, Gentile F, Esposito F, Balsi M, Di Salle F, Goebel R, et al. Classification of fMRIindependent components using IC-fingerprints and support vector machine classifiers. NeuroImage. 2007;34(1):177–194. doi: 10.1016/j.neuroimage.2006.08.041.29Akansha Mohan, BA Aaron J. Roberto, MD, Abhishek Mohan, BS Aileen Lorenzo, MD, KathrynJones, MD, PhD, Martin J. Carney, BS, Luis Liogier-Weyback, MD,fSoonjo Hwang, MD, and Kyle A.B.Lapidus, MD, PhD. The Significance of the Default Mo
ADHD patients (9, 10).In studies of brain function using rs-fMRI,abnormalities were found in the prefrontal cortex, anterior cingulated cortex, putamen, temporal cortex, and cerebellum (11, 12).The rs-fMRI has become a research hotspot among more and more scientists, it has achieved obvious results in