Transcription
Aberrant Functional Connectivity in Resting StateNetworks of ADHD Patients Revealed byIndependent Component AnalysisHuayu ZhangShandong University of Science and TechnologyYue ZhaoShandong University of Science and Technology and Shandong First Medical University & ShandongAcademy of Medical SciencesWeifang CaoShandong First Medical University & Shandong Academy of Medical SciencesDong CuiShandong First Medical University & Shandong Academy of Medical SciencesQing JiaoShandong First Medical University & Shandong Academy of Medical SciencesWeizhao LuShandong First Medical University & Shandong Academy of Medical SciencesHongyu LiShandong University of Science and TechnologyJianfeng Qiu ( jfqiu100@gmail.com )Shandong First Medical University & Shandong Academy of Medical Sciences https://orcid.org/00000002-8049-3743Research articleKeywords: fMRI, RSNs, ADHD, functional connectivity, ICAPosted Date: May 13th, 2020DOI: https://doi.org/10.21203/rs.2.16761/v2License: This work is licensed under a Creative Commons Attribution 4.0 International License.Read Full LicenseVersion of Record: A version of this preprint was published on September 18th, 2020. See the publishedversion at https://doi.org/10.1186/s12868-020-00589-x.Page 1/20
AbstractBackground: ADHD is one of the most common psychiatric disorders in children and adolescents. Alteredfunctional connectivity has been associated with ADHD symptoms. This study aimed to investigateabnormal changes in the functional connectivity of resting-state brain networks (RSNs) amongadolescent patients with different subtypes of ADHD.Methods: The data were obtained from the ADHD-200 Global Competition, including fMRI data from 88ADHD patients (56 patients of ADHD-Combined, ADHD-C and 32 patients of ADHD-Inattentive, ADHD-I)and 67 typically developing controls (TD-C). Group ICA was utilized to research aberrant brain functionalconnectivity within the different subtypes of ADHD.Results: In comparison with the TD-C group, the ADHD-C group showed clusters of decreased functionalconnectivity in the left inferior occipital gyrus (p 0.0041) and right superior occipital gyrus (p 0.0011)of the dorsal attention network (DAN), supplementary motor area (p 0.0036) of the executive controlnetwork (ECN), left supramarginal gyrus (p 0.0081) of the salience network (SN), middle temporal gyrus(p 0.0041), and superior medial frontal gyrus (p 0.0055) of the default mode network (DMN), while theADHD-I group showed decreased functional connectivity in the right superior parietal gyrus (p 0.0017)of the DAN and left middle temporal gyrus (p 0.0105) of the DMN. In comparison with the ADHD-Igroup, the ADHD-C group showed decreased functional connectivity in the superior temporal gyrus (p 0.0062) of the AN, inferior temporal gyrus (p 0.0016) of the DAN, and the dorsolateral superior frontalgyrus (p 0.0082) of the DMN. All the clusters surviving at p 0.05 (AlphaSim correction).Conclusion: The results suggested that decreased functional connectivity within the DMN and DAN wasresponsible, at least in part, for the symptom of inattention in ADHD-I patients. Similarly, we believed thatthe impaired functional connectivity within networks may contribute to the manifestations of ADHD-Cpatients, including inattention, hyperactivity/impulsivity, and unconscious movements.BackgroundAttention-deficit/ hyperactivity disorder (ADHD) has emerged as a common contributor toneurodevelopmental disorders as well as frequent psychological and behavioral problems amongchildren (1). The global prevalence of ADHD is about 5.29%. According to the previous studies, anyvariation in the prevalence estimates can be attributed to the methodological characteristics of differentstudies instead of discrepancies in the actual distribution of ADHD (2). There are a great number ofadolescent ADHD patients in the world; thus, management and treatment of ADHD patients is veryimportant. ADHD is mainly characterized by symptoms of inattention, impulsivity, and hyperactivity.Diagnosis of ADHD is mainly based on the levels of symptoms listed in DSM-IV (3) and is usuallyconducted by parents or teachers, which is subjective. Typically, ADHD can be categorized into threesubtypes: hyperactive-impulsivity (ADHD-HI), persistent inattention (ADHD-I), and a combination of both(ADHD-C) (4, 5). This disorder is often accompanied by learning difficulties or conduct disorders (6, 7),Page 2/20
which can greatly affect the interpersonal skills and academic performance of the patients. Many studieshave pointed out that the subjective diagnoses make it difficult to draw a line between the normal leveland the level of ADHD symptoms that need treatment (8). Thus, studies on objective diagnosis of ADHDare of great significance, and research on ADHD has become a major topic of interest in medicine andpsychology in recent years.In previous studies, resting-state functional MRI (rs-fMRI) was widely used to examine the brain of ADHDpatients (9, 10). In rs-fMRI studies of brain function, abnormalities were found in the prefrontal cortex,anterior cingulate cortex, putamen, temporal cortex, and cerebellum (11, 12). rs-fMRI has become aresearch hotspot that is being increasingly used to achieve obvious results in many fields, such asneuroscience, spiritual science, biological science, and statistics, and it has been shown to be helpful forthe diagnosis and treatment of ADHD (13, 14). A growing body of literature shows that communicationabnormalities among and within neural networks may underlie ADHD (15). rs-fMRI can effectivelyidentify such network abnormalities, and it is unconstrained by limitations yet reliable for this purpose. Inrs-fMRI experiments, subjects are awake and are asked to simply rest while lying in the MRI scanner, sobrain activity can be considered “spontaneous” rather than stimulus- or task-driven. As previouslymentioned, most researchers focused on the default mode network (DMN), while less attention was paidto other brain networks or differences between the two types of ADHD. Therefore, we speculated that theauditory network (AN), dorsal attention network (DAN), executive control network (ECN), salience network(SN), and sensorimotor network (SMN) are also related to ADHD, and we compared the differences in thefunctional connectivity (FC) of six resting-state brain networks (RSNs) between two ADHD subtypes.In the present study, group independent component analysis (ICA), a data-driven approach, was adoptedto extract the components (16). ICA is a widely used method for statistical analysis of fMRI data (17, 18).Without any prior information, this method can effectively determine the functional characteristics ofmutually correlated brain components (19). We hope to identify the differences in these RSNs amongpatients with different subtypes of ADHD by comparing the FCs of the six RSNs among the three groups.We speculate that the symptoms of ADHD patients are associated with abnormal FCs of these RSNs.Methods2.1 SubjectsPublic fMRI data were downloaded from the ADHD-200 Global i/adhd200/index.html) and selected exclusively from the New YorkUniversity (NYU) Child Study Center. In accordance with HIPAA guidelines and 1000 FunctionalConnectomes Project protocols, all datasets are anonymous, with no protected health informationincluded. For both ADHD and TD subjects, the inclusion criteria were as follows: age of 7–17 years, nohistory of neurological disease, and no diagnosis of either schizophrenia or affective disorder, an imagecovering at least 95% of the brain, an IQ score 80, and head movement less than 2.0. Subjects wereenrolled if they were right-handed and their information was complete (e.g., age, Verbal IQ, orPage 3/20
Performance IQ). Finally, fMRI data from a total of 155 volunteers aged between 7 and 17 years werecollected, including 67 typically developing controls (TD-C), 56 ADHD-C patients, and 32 ADHD-I patients(the number of ADHD-HI patients was too small to be studied). IBM SPSS software (Armonk, NY, v. 22.0)was used for statistical analysis. One-way analysis of variance was performed with age, ADHD index,verbal IQ, performance IQ, and Full IQ, and the chi-squared test was used to evaluate the differences ingender among the three groups. A p-value of 0.05 was considered statistically significant, as shown inTable 1. The symptoms of ADHD were assessed using the Conners Parent Rating Scale-Revised, Longversion (CPRS-LV) (20).The fMRI data were acquired using a single-shot echo-planar imaging (GRE-EPI) sequence with thefollowing imaging parameters: repetition time (TR) 2000 ms; echo time (TE) 15 ms; flip angle (FA) 90 ; FOV reading 240 mm; slice thickness 4 mm; number of slices 33; and voxel size 3 3 4mm3, time points 176, and acquisition matrix 80 80.2.2 Data preprocessingThe original fMRI data were preprocessed using a public toolbox named DPABI (for Data Processing &Analysis of Brain Imaging, http://rfmri.org/dpabi). The preprocessing steps were as follows: 1) removethe first 10 volumes to ensure that the BOLD signal was stable; 2) slice timing, correct the difference dueto acquisition times between slices in the volume; 3) head motion correction; 4) normalization, registerthe data to the EPI standard template and resample it to 3.0 3.0 3.0 mm3; and 5) spatial smoothingwith a 6-mm full width at half maximum (FWHM) Gaussian kernel (21). Subjects whose head movementexceeded 2.0 mm were excluded.2.3 ICA and determination of RSNsWe conducted group ICA using the Group ICA/IVA function of the fMRI Toolbox (GIFT,http://mialab.mrn.org/software/). We chose ICA because of its effectiveness at separating signal fromnoise (22). Six independent components (ICs) were selected as corresponding to major RSNs. The usedgroup ICA approach and tests with simulation data are described in detail in publications by the researchgroup of Dr. Calhoun (5, 23, 24). This toolbox implements a group approach consisting of estimation ofthe independent components (ICs) on concatenated data, which is followed by a computation of subjectspecific spatial maps and time courses (25). Usually, there are three main steps: (a) compression of thedata; (b) estimation of the ICs in an aggregate dataset; (c) back reconstruction of the ICs.For data reduction, the dimensionality of the data was reduced using principal component analysis(PCA). The number of independent hemodynamic sources was estimated using the minimal lengthdescription criterion (MLD), indicating 20 ICs for our functional dataset, which is sufficient to capture themost frequently observed large-scale resting-state networks (26). Then, using the Infomax algorithm,which was repeated 20 times in the ICASSO to obtain a more reliable estimation result, maximallyindependent components were estimated, and the data were transformed into a linear mixing matrix and20 ICs. The individual ICs were back-reconstructed by multiplying the section of data corresponding toPage 4/20
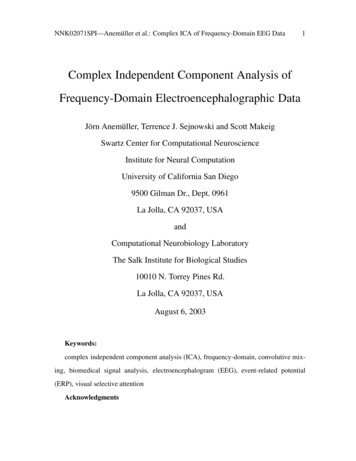
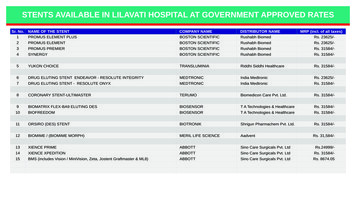
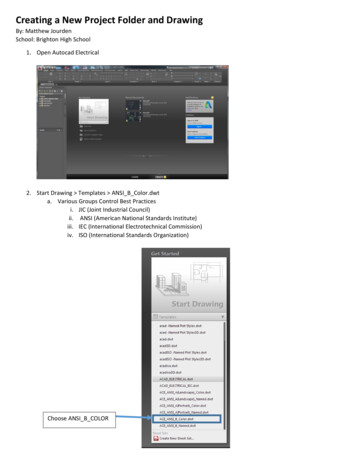
each subject by that mixing matrix. The ICs were then transformed to z-score values, which provide anindex of the degree of synchronization of the BOLD signal in that voxel with the time course of therelevant component.The RSN components were subsequently selected via an automated process that defines thecomponents that most closely matched the RSNs for each individual subject, based on spatial correlationanalyses with the RSNs templates. All templates represent regions that have repeatedly been implicatedin the RSNs.There were six RSNs of interest, namely, the AN, DAN, DMN, ECN, SN, and SMN. All RSN templates werecreated with WFU PickAtlas (https://www.nitrc.org/projects/wfu pickatlas/) in the SPM toolbox based oncentroid coordinates and radii. The component with the largest correlation coefficient was selected as theRSN we were interested in. A total of six components were identified. Figure 1 shows the templates of thesix RSNs and the selected corresponding ICs that had the highest spatial correlation with the template. Inorder to verify whether the six ICs of each group were zero, a one-sample t-test was performed andaccording to the settings in the previous study (27), we set a threshold of p 0.05, as shown in Figure 2.2.4 Statistical AnalysisOn the basis of the number of original subjects, the selected ICs (z-score value) were reclassified intothree groups. The Resting-State fMRI Data Analysis Toolkit plus V1.2 (RESTplus V1.2,http://restfmri.net/forum/RESTplusV1.2) was the toolbox of our choice for statistical analysis. In order toverify whether the six ICs differed among the three groups, analysis of variance (ANOVA) on ICs(AlphaSim correction, P 0.05) was performed with the result of the one-sample t-test serving as anexplicit mask, where age and gender were controlled as covariates. The differences between the groupsof ICs were obtained by two-sample t-test (AlphaSim correction, P 0.05, cluster 10) with the result ofANOVA serving as an explicit mask. Similarly, age and gender were eliminated as covariates. Finally, aSpearman correlation analysis was performed between the ADHD index and mean signals of ICs that wedelineated as ROIs.Results3.1 ANOVA showed differences between the three groupsThe ANOVA results for all ICs are shown in Figure 3 and Table 2, indicating the brain regions where theremay be differences between the six ICs in the three groups of subjects. The regions depicted in red-yellowshown in Figure 3 indicate differences in RSNs between the three groups. The F values and p values ofthe most significant differences in each RSN are shown in Table 2. As shown in Figure 3, brain regionswith significant differences appeared in the superior temporal gyrus of the AN, superior parietal gyrus andoccipital lobe of the DAN, middle temporal gyrus and superior medial frontal gyrus of the DMN,supplementary motor area of the ECN, precentral gyrus of the SMN, as well as supramarginal gyrus of theSN.Page 5/20
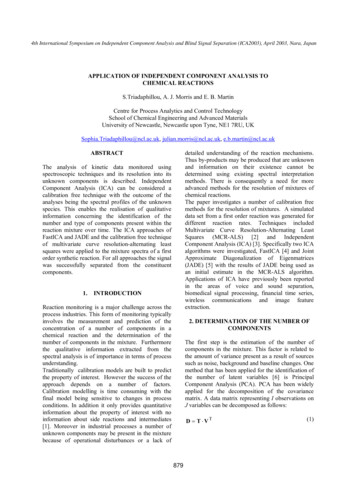
3.2 Comparisons between groupsThe results of the two-sample t-test are presented in Table 3, which shows the differences between thegroups of 6 ICs.3.2.1 The differences between ADHD-C and TD-CIn comparison with the TD-C group, the ADHD-C group showed decreased FC in the DAN, ECN, SN, andDMN (shown in Figure 4). The clusters of weaker connectivity were located in the left inferior occipitalgyrus (p 0.0041) and right superior occipital gyrus (p 0.0011) of DAN, supplementary motor area (p 0.0036) of ECN, left supramarginal gyrus (p 0.0081) of SN, and middle temporal gyrus (p 0.0041) andsuperior medial frontal gyrus (p 0.0055) of DMN, with the differences for all areas at p 0.05 (AlphaSimcorrection). However, RSNs with considerably enhanced FC were not observed in ADHD-C.3.2.2 The differences between ADHD-I and TD-CFigure 5 indicates that ADHD-I patients showed decreased FC in comparison to the TD-C group in a fewareas, namely, the right superior parietal gyrus (p 0.0017) of DAN and the left middle temporal gyrus (p 0.0105) of DMN. In contrast, stronger FC was observed within three RSNs, including the supramarginalgyrus (p 0.0027) of AN, the precentral gyrus (p 0.0024) of SMN, and the medial frontal gyrus (p 0.0265) of DMN.3.2.3 The differences between ADHD-C and ADHD-IIn comparison with the ADHD-I group, the ADHD-C group showed weaker FC mainly in the superiortemporal gyrus (p 0.0062) of AN, inferior temporal gyrus (p 0.0016) of DAN, as well as dorsolateralsuperior frontal gyrus (p 0.0082) of DMN. However, an increase in the FC was found in the middletemporal gyrus (p 0.0051) of DMN, as illustrated in Figure 6.3.3 Correlation AnalysisThe above results have demonstrated a significant area of FC abnormalities in RSNs in ADHD patients. ASpearman correlation analysis was performed between ADHD index and the mean signals of ICs that wedelineated as ROIs, in order to verify whether the ADHD indices of the two groups of ADHD patients wereassociated with FC abnormalities. All correlation analyses were performed in the ADHD-C and ADHD-Igroups. An inverse relationship with the ADHD index was only found for the left supplementary motorarea of ECN in the ADHD-C group (r -0.267, p 0.047). The results showed no significant difference (p 0.05) after a multiple comparison correction.DiscussionIn this study, group ICA was performed and both subtypes of ADHD patients showed impaired FCs inmajor RSNs in comparison with TD-C. We found that the FCs of the DAN, ECN, SN, and DMN werePage 6/20
significantly reduced in ADHD-C patients, including the right inferior occipital gyrus and the superioroccipital gyrus of DAN, supplementary motor area of ECN, left supramarginal gyrus of SN, and middletemporal gyrus and superior medial frontal gyrus of DMN.Many previous studies have demonstrated abnormal functional connections within the DMN of ADHDpatients, especially the temporal lobe (25, 28, 29). DMN is a commonly used brain network in fMRIstudies and is considered to be associated with a wide range of neuropsychiatric diseases (30). In ourstudy, in comparison with the TD-C group, both subtypes of ADHD patients showed reduced FC in theoccipital lobe of DAN and the middle temporal gyrus of DMN. However, in the superior medial frontalgyrus of DMN, the two groups performed inversely. Although DMN and DAN activity were believed toshow opposite trends (31, 32), Matthew L. Dixon demonstrated that there is no anticorrelation betweensome subsystems and DMN (33). These could explain our findings that reduced FC occurredsimultaneously in DAN and DMN. We also observed differences in FCs between the two groups of ADHDsubtypes. Patients with ADHD-C showed more reduced FC, such as the inferior temporal gyrus of DANand superior frontal gyrus of DMN. Only a portion of the middle temporal gyrus of DMN has shown anenhanced FC. One explanation for the difference may be the diverse clinical symptoms between the twosubtypes of ADHD patients. DMN shows greater activation during periods of silence or in a resting state(30). In contrast, DAN is routinely activated during attention-demanding cognitive tasks (34). Thus, wespeculated that abnormal changes in FC exhibited by DMN and DAN may be related to the attentiondeficit in ADHD patients, which has been proven by some previous studies (35, 36).When comparing the ADHD-I to the TD-C group, we found a few regions showing enhanced FC, such asthe supramarginal gyrus of AN and the precentral gyrus of SMN. Previous studies have shown thatpatients with ADHD were more sensitive to sound, which may be related to the enhanced FC in AN (5).Jean-Arthur reported that ADHD patients had perceptual inundation (37). To the best of our knowledge,few studies have focused on the changes in AN and SMN, and few voxels in these regions were found inour study, which may be due to differences in sample size. Thus, we have not provided additionaldiscussions about these regions.Daniel von Rhein revealed that SN plays a role in supervision and decision when the brain processesexternal stimuli (27). The main functions of the SN are to integrate information from different modalitiessuch as sensory information and bodily states in order to establish goal-directed behavior and to processemotion-related information. Our findings showing reduced FC of the SN in ADHD-C patients confirmedthe conclusions proposed by Daniel von Rhein (27). In addition, the ECN has been shown to participate inmultiple advanced cognitive tasks and play an important role in adaptive cognitive control (38). Thedecreased FC in ECN may explain why ADHD-C patients fail to control their emotions and exhibitimpulsive aggression or other conduct disorders (39, 40). Two subtypes of ADHD patients also differ inFC of ECN. In the ADHD-C group, the superior frontal gyrus of ECN showed weaker FC. We speculate thatthis change may explain why ADHD-C patients are more hyperactive than ADHD-I patients.ConclusionsPage 7/20
In conclusion, group ICA allowed the use of interrelated analytical methods for evaluating FCs of ADHD inadolescents in this study. We found that these major RSNs in both subtypes of ADHD patients showed FCchanges in comparison with the TD-C group, and FC differences were also observed between the twosubtypes of ADHD patients. Our study elucidates the abnormal changes in the RSNs of different subtypesof adolescent ADHD patients, which may prove helpful for the management of adolescent ADHDpatients. In the future, studies employing a multimodal imaging approach using techniques such asstructural MRI, diffusion tensor imaging and fMRI, will be necessary to comprehensively investigate thebrain changes in adolescents with ADHD. These further studies will contribute to the management andtreatment of ADHD in adolescents.LimitationsOne of the limitations of our study was the absence of any psychological assessment of the cognitiveparameters associated with ADHD. Moreover, the participant numbers in the three groups weresubstantially different, which was likely to have an impact on the results of statistical analysis. Inaddition, the six RSN templates were created by WFU PickAtlas in the SPM toolbox directory based oncentroid coordinates and radii. The differences between our templates and the actual anatomical RSNswould have also affected the accuracy of our results.AbbreviationsADHD: attention-deficit/ hyperactivity disorderADHD-C: ADHD-CombinedADHD-HI: ADHD-Hyperactive-impulsivityADHD-I: ADHD-InattentiveAN: auditory networkDAN: dorsal attention networkDMN: default mode networkDSM-IV: the fourth edition of the Diagnostic and Statistical Manual of MentalDisordersECN: executive control networkFA: flip angleFC: functional connectivityPage 8/20
FOV: field of viewHIPAA: Health Insurance Portability and Accountability ActICA: independent component analysisMRI: magnetic resonance imagingROI: region of interestrs-fMRI: resting-state functional MRIRSNs: resting-state brain networksSMN: sensorimotor networkSN: salience networkTD-C: typically-developing controlsTE: echo timeTR: repetition timeDeclarationsEthics approval and consent to participate: In accordance with HIPAA guidelines and 1000 FunctionalConnectomes Project protocols, all datasets are anonymous, with no protected health informationincluded.Consent for publication: Not applicableAvailability of data and material: The datasets analysed 329 during the current study are available in the[ADHD-200 Global Competition] repository, [http://fcon mpeting interests: The authors declare that they have no competing interests.Funding: This study was supported by grants from National Key Research and Development Program(2016YFC0103400) and J. Qiu was supported by the Taishan Scholars Program of Shandong Province.This work was also supported by Academic Promotion Programme of Shandong First Medical UniversityNo.2019QL009. The funders had no role in study design, data analysis, decision to publish, or preparationof the manuscript.Authors' contributions: HYZ and YZ were major contributors in writing the manuscript. HYL and JFQconceived and designed the experiments. The other authors played an important role in data analysis. Allauthors read and approved the final manuscript.Page 9/20
Acknowledgements: We thank the ADHD-200 Consortium and the ADHD-200 Global Competitionorganizers for their work and sharing their data generously. Thanks for the support of National KeyResearch and Development Program (2016YFC0103400), and J. Qiu was supported by the TaishanScholars Program of Shandong Province (TS201712065). This work also was supported by Academicpromotion programme of Shandong First Medical University No. 2019QL009.References1Polanczyk G, de Lima MS, Horta BL, Biederman J, Rohde LA. The worldwide prevalence of ADHD:a systematic review and metaregression analysis. Am J Psychiatry. 2007; 164(6):942–8.2Kobel M, Bechtel N, Specht K, Klarhöfer M, Weber P, Scheffler K, Opwis K, Penner IK. Structural andfunctional imaging approaches in attention deficit/hyperactivity disorder: does the temporal lobe play akey role? Psychiatry Res. 2010;183(3):230-6. doi: 10.1016/j.pscychresns.2010.03.010. Epub 2010 Aug 10.3American Psychiatric Association. (1994). Diagnostic and Statistical Manual of Mental Disorder,4th Edn (Washington, DC: American Psychiatric Press; ).4Smith SM, Fox PT, Miller KL, Glahn DC, Fox PM, et al. Correspondence of the brain's functionalarchitecture during activation and rest. Proc. Natl. Acad. Sci. U.S.A. 2009;1060, 13040–13045. doi:10.1073/pnas.0905267106. Epub 2009 Jul 20.5Allen EA, Erhardt EB, Wei Y, Eichele T, Calhoun VD. Capturing inter-subject variability with groupindependent component analysis of fMRI data: a simulation study. Neuroimage. 2012 Feb 15;59(4):414159. doi: 10.1016/6Hoekzema E, Carmona S, Ramos-Quiroga JA, Richarte Fernández V, Bosch R, Soliva JC, Rovira M,Bulbena A, Tobeña A, Casas M, Vilarroya O. An independent components and functional connectivityanalysis of resting state fMRI data points to neural network dysregulation in adult ADHD. Hum BrainMapp. 2014 Apr;35(4):1261-72. doi: 10.1002.7ox MD, Snyder AZ, Vincent JL, Corbetta M, Van Essen DC, Raichle ME. The human brain isintrinsically organized into dynamic, anticorrelated functional networks. Proc Natl Acad Sci USA. 2005;102:9673–9678.8Dai Dai, Jieqiong Wang, Jing Hua, and Huiguang He. Classification of ADHD children throughmultimodal magnetic resonance imaging. Front Syst Neurosci. 2012; 6: 63. doi: 10.3389.9Tang C, Wei Y, Zhao J, Nie J. Different Developmental Pattern of Brain Activities in ADHD: A Studyof Resting-State fMRI. Dev Neurosci. 2018;40(3):246-257. doi: 10.1159/000490289.10Bos DJ, Oranje B, Achterberg M, Vlaskamp C1, Ambrosino S, de Reus MA, van den Heuvel MP,Rombouts SARB, Durston S. Structural and functional connectivity in children and adolescents with andPage 10/20
without attention deficit/hyperactivity disorder. J Child Psychol Psychiatry. 2017 Jul;58(7):810-818. doi:10.1111/jcpp.12712. Epub 2017 Mar 10.11Cao Q., Zang Y., Sun L., Sui M., Long X., Zou Q., Wang Y. (2006). Abnormal neural activity inchildren with attention deficit hyperactivity disorder: a resting-state functional magnetic resonanceimaging study. Neuroreport 17, 1033–1036. 10.1097/01.wnr.0000224769.92454.5d.12Tian L., Jiang T., Wang Y., Zang Y., He Y., Liang M., Sui M., Cao Q., Hu S., Peng M., Zhuo Y. (2006).Altered resting-state functional connectivity patterns of anterior cingulate cortex in adolescents withattention deficit hyperactivity disorder. Neurosci. Lett. 400, 39–43. 10.1016/j.neulet.2006.02.022.13Yoo JH, Kim D, Choi J, Jeong B. Treatment effect of methylphenidate on intrinsic functional brainnetwork in medication-naïve ADHD children: A multivariate analysis. Brain Imaging Behav. 2018Apr;12(2):518-531. doi: 10.1007/s11682-017-9713-z.14Silk TJ, Malpas C, Vance A, Bellgrove MA. The effect of single-dose methylphenidate on restingstate network functional connectivity in ADHD. Brain Imaging Behav. 2017 Oct;11(5):1422-1431. doi:10.1007/s11682-016-9620-8.15Shafritz, K.M., Marchione, K.E., Gore, J.C., Shaywitz, S.E., Shaywitz, B.A., 2004. The effects ofmethylphenidate on neural systems of attention in attention deficit/ hyperactivity disorder. AmericanJournal of Psychiatry 161, 1990–1997.16Beckmann CF, De Luca M, Devlin JT, Smith SM. Investigations into resting-state connectivity usingindependent component analysis. Philos Trans R Soc London. 2005;360(1457):1001–1013.17von Rhein D, Beckmann CF, Franke B, Oosterlaan J, Heslenfeld DJ, Hoekstra PJ, Hartman CA,Luman M, Faraone SV, Cools R, Buitelaar JK1, Mennes M. Network-level assessment of reward-relatedactivation in patients with ADHD and healthy individuals. Hum Brain Mapp. 2017;38(5):2359-2369. doi:10.1002/hbm.23522. Epub 2017 Feb 8.18Fox MD, Raichle ME. Spontaneous fluctuations in brain activity observed with functional magneticresonance imaging. Nat Rev Neurosci. 2007 Sep;8(9):700-11.19van de Ven VG, Formisano E, Prvulovic D, Roeder CH, Linden DE. Functional connectivity asrevealed by spatial independent component analysis of fMRI measurements during rest. Hum BrainMapp. 2004;22(3):165-78.20Conners CK, Sitarenios G, Parker JDA, Epstein JN. The Revised Conners' Parent Rating Scale(CPRS-R): Factor Structure, Reliability, and Criterion Validity. Journal of Abnormal Child Psychology1998;26(4):257-268.21Shuo Miao, Junxia Han. Reduced Prefrontal Cortex Activation in Children with AttentionDeficit/Hyperactivity Disorder during Go/No-Go Task: A Functional Near-Infrared Spectroscopy Study.Page 11/20
Front Neurosci. 2017; 11: 367. doi: 10.3389.22Elton A, Alcauter S, Gao W. Network connectivity abnormality profile supports a categoricaldimensional hybrid model of ADHD. Hum Brain Mapp. 2014 Sep;35(9):4531-43. doi: 10.1002.23Calhoun VD, Adali T, Pearlson GD, Pekar JJ. A method for making group inferences fromfunctional MRI data using independent component analysis. Hum Brain Mapp. 2001 Nov;14(3):140-51.24Erhardt EB, Rachakonda S, Bedrick EJ, Allen EA, Adali T, Calhoun VD. Comparison of multi-subjectICA methods for analysis of fMRI data. Hum Brain Mapp. 2011 Dec; 32(12):2075-95. doi:10.1002/hbm.21170. Epub 2010 Dec 15.25Matthew L. Dixona, Jessica R. Andrews-Hannab, R. Nathan Sprengc, Zachary C. Irvingd, CaitlinMillsa, Manesh Girna, Kalina Christoff. Interactions between the default network and dorsal attentionnetwork vary across default subsystems, time, and cognitive states. NeuroImage Volume 147, 15February 2017, Pages 632-649.26Mueller A,Candrian G,Kropotov JD,Ponomarev VA,Baschera GM. Classification of ADHD patientson the basis of independent ERP components using a machine learning system. Nonlinear Biomed Phys.2010 Jun 3; 4 Suppl 1: S1. doi: 10.1186/1753-4631-4-S1-S1.27Valera EM, Faraone SV, Murray KE, Seidman LJ. Meta-analysis o
Methods: The data were obtained from the ADHD-200 Global Competition, including fMRI data from 88 ADHD patients (56 patients of ADHD-Combined, ADHD-C and 32 patients of ADHD-Inattentive, ADHD-I) and 67 typically developing controls (TD-C). Group ICA was utilized to research aberrant brain functional connectivity within the different subtypes of .