Transcription
The Air Cavity, f -holes and Helmholtz Resonanceof a Violin or ViolaJohn Coffey, Cheshire, UK.2013Key words: Helmholtz air resonance, violin, viola, f -holes, acoustic modelling, LISA FEA program1IntroductionIf the man-in-the-street were asked ‘Why are there two slots in the top of a violin?’ he might answer‘To let the sound out’. Is he correct? If so, is this all there is to it? Although the shape, size andposition of the two f -holes have been established through centuries of practice, we can still ask howimportant they are to the quality of sound produced, and whether other holes in other places wouldwork just as well.This is the fifth article in a series describing my personal investigations into the acousticsof the violin and viola. Previous articles have used experiment and finite element analysis with theLISA and Strand7 programs to investigate the normal modes of vibration of the wooden componentsof these stringed instruments, starting with single free flat plates. In these studies the wood wasconsidered to be in vacuum as far as its vibrations are concerned. This present article considers theair inside the belly of the instrument, its vibration in and out of the two f -holes, and its interactionwith the enclosing wooden box.Pioneering studies of the physics of the violin by Carleen Hutchins, Frederick Saunders andseveral others, reviewed briefly in §4, have described a series of air resonances in a violin, viola or’cello termed A0, A1, A2, etc. On a violin A0, the lowest, is at about 270 Hz and A1 at about 470Hz. All except A0 correspond to standing waves inside the cavity, similar to those in an organ pipe.By contrast, at A0 the instrument acts much like a classic Helmholtz resonator in which a plug of airvibrates in and out of each f -hole, with the air inside acting as a spring, expanding and contractingin volume. A Helmholtz resonance is also produced by blowing across the neck of a wine bottle. Thepitch of the note depends on the volume of the air reservoir and (unlike an organ pipe) not on itslength per se. Of course, the air in a violin is only set in motion through the vibration of the woodenbox structure, so there must be coupling between the air and the thin wooden walls. A0 is describedas crucial for strengthening the loudness of notes on the lowest two strings (G and D on violin, Cand G on viola) since the lowest wood resonance is typically a musical fifth higher.To orient us and show the scope of the topic, I start in §2 with some experimental measurements on a simplified model of a violin – a wooden box with only one flexible plate and only one holeinto the cavity, driven electro-mechanically by a sinusoidal force from a signal generator. Listeningwith an external microphone, we obtain amplitude-frequency curves which map the sound radiatedas the frequency is swept. These curves have a rich structure and together they pose a challenge toanalytical theory and numerical modelling, to explain their many peaks and troughs. Some may will1
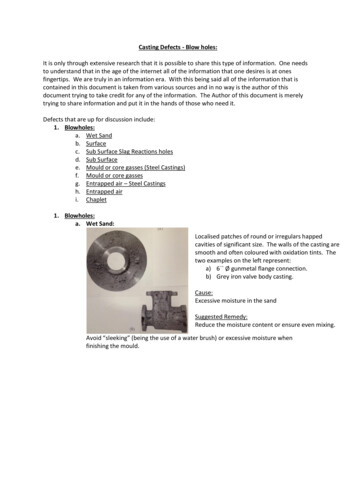
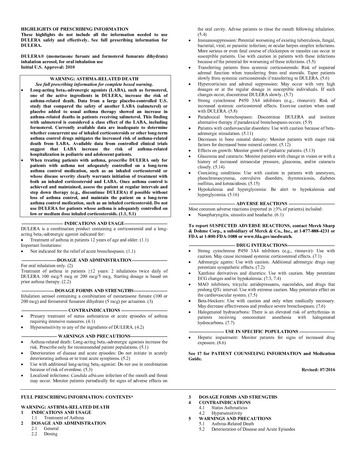
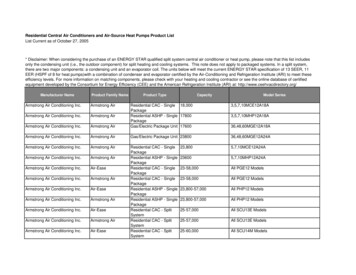
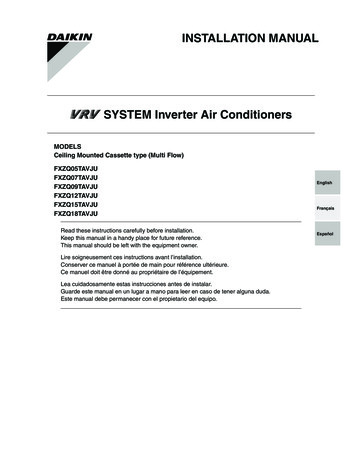
be due primarily to the normal modes of the wooden plates, some to the air cavity, and some maydepend in frequency and amplitude on coupling between wood and air.From these amplitude-frequency spectra we pick out the Helmholtz resonance, which is thecentral topic of this article. I hope to quantify the wider complexities in future articles. In §3 Idescribe my own experiments to observe and measure the Helmholtz and other air resonances inviolins and violas. There is a large literature on acoustic resonators dating back to Helmholtz’soriginal papers of the 1880s and Lord Rayleigh’s theoretical analysis in volume II of his monumental‘Theory of Sound’. The literature broadly falls into two categories:1. studies of the importance of A0 and other resonances on the musical tone and loudness ofviolins,2. studies of how the frequency of any Helmholtz resonator, not necessarily a violin, is determinedby the volume and shape of the cavity and the area, height and shape of the neck opening.The brief review in §4 deals with category 1, mainly the work of Carleen Hutchins and FrederickSaunders on the tone of violins. Category 2 studies are considered in the later sections of this paper,from §5 onwards. In §5 I derive the classic Helmholtz frequency formula for the case where thecavity has rigid walls. Most traditional calculations assume a simple shape of opening and neck ofthe Helmholtz resonator. I have examined a range of shapes with the LISA finite element programwhich can solve the relevant Helmholtz acoustic wave equation assuming rigid walls. These start in§6 with the acoustically simple case of a wine bottle. §7 describes a sequence of experimental andcorresponding FEA studies of a rectangular plywood box with a volume about that of a violin intowhich apertures of various sizes and shapes are cut. Finally §8 discusses the coupling between theair cavity and flexible elastic walls, presenting experimental results to show that flexible walls canlower A0 to at least 65% of its value when the walls are rigid.2‘Letting the sound out’I start by describing the last set of experiments I carried out for this article because it sets the scenefor all the subsequent discussion. Acoustic measurements were made on a wooden box which I willcall Box C; it will be referred to in later sections, where further details are given. It is the cuboidalbox in Figure 1 with roughly the dimensions of a violin, being internally 340 mm by 160 mm by 45mm. It was initially made of 2 91 mm thick 3-plywood but then clad on all sides except the backwith thick MDF1 board to make those faces almost rigid. A window had been cut in the MDF of thetop plate to leave a small area of the 3-ply exposed, and into this had been cut a slot about 53 mmlong and 14 mm wide, through into the cavity. Thus the MDF is clear of the aperture by about 15mm all round, and the thickness of the plate at and immediately around the aperture is only 2 91mm. At a later stage I lengthened and widened this single slot to about 61 mm by 28 mm (Figure1). The box is a highly simplified model of a violin.2.1The observed amplitude-frequency responseThe box was driven into oscillation and the radiated sound recorded using the arrangement inFigure 2. The electromagnetic exciter, which had been used in previous experiments described inwww.mathstudio.co.uk, was positioned in the centre of the flexible back plate and held lightly withadhesive tape to stop it meandering sideways. The box was placed flat on soft furnishings, exciterunderneath, aperture on top and, for the first set of measurements, was padded around with cushions1Medium density fibreboard, 13 or 19 mm thick2
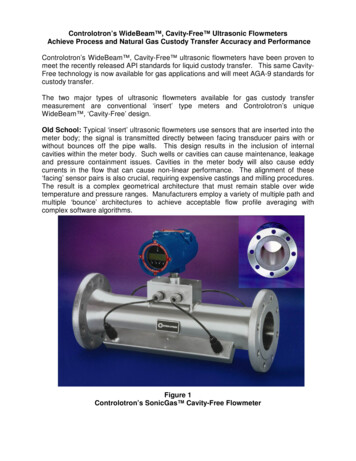
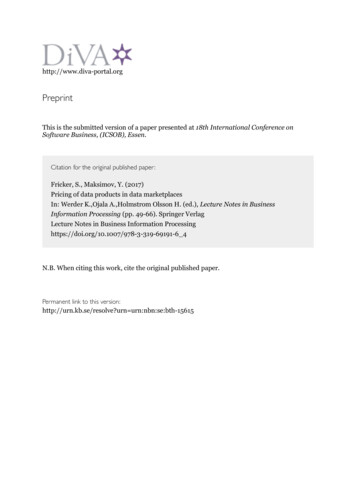
Figure 1: The wooden box, clad in MDF, with a cut-out around the aperture (61 by 28 mm) in thetop plywood plate. The electromagnetic exciter has been placed on top, though it was applied tothe bottom plate of 2 91 mm thick plywood. Not my finest piece of woodwork!Figure 2: External microphone records sound radiated from box or violin when the wooden structureis driven by an electromagnetic vibrator.to minimise sound leakage from back to front. The high quality capacitance audio microphone wasplaced about 30 cm above the aperture in the box’s top, and the signal recorded as the vibrator wasdriven with either a steady sinusoidal vibration, or else a linearly swept sine wave.Figure 3 shows the envelope of amplitude recorded by the microphone as the frequency sweepsslowly from 50 to 1200 Hz. The linearly swept frequency means that the time axis is equivalent tofrequency. The upper green curve is with the hole open, the lower inverted yellow curve with itclosed by covering it with a block of MDF. This did not make an air tight seal, but overlapped theMDF cut-out by about 3 cm. Each such recording was subsequently played through the WaveSpectraor NCH WavePad Fourier spectrum analysis software to determine the frequencies at the peaks inamplitude. The accuracy of this is about 5 Hz, the uncertainty arising from the width of timewindow over which the digital Fourier transform is performed. The precision of some peaks was3
refined to 1 Hz in a further measurement in which a continuous sine wave was stepped through theresonance, 1 Hz at a time, under manual control. Here are a few observations:1. Nominally there should be no sound with the hole closed. The sound recorded must comefrom leakage from the back plate through the cushions and/or from leakage around the MDFcovering block.2. By and large the sound level with the aperture closed is significantly less than with the holeopen. So, to answer our opening question, Yes, the hole does let out the sound from the backplate.3. There is a range between about 700 and 800 Hz where the sound is very low, but is louder withthe hole closed. Very odd!4. The Open curve has a large peak at 156 Hz completely absent from the Closed curve. This isthe Helmholtz resonance, A0.5. The Open curve also has a broad peak at about 410 Hz which is also absent from the Closedcurve.6. The Open curve has another narrow major peak at 1040 Hz. This is mirrored in the Closedcurve but moved slightly to lower frequency. Closing the hole has not completely extinguishedit.7. Both curves have a broad peak between about 550 and 700 Hz.Figure 3: Signal received at external microphone when flexible back plate of rectangular box isexcited at frequencies from 50 to 1200 Hz, with the 14 mm wide hole in the top plate either open orclosed. (The Closed graph is inverted.)4
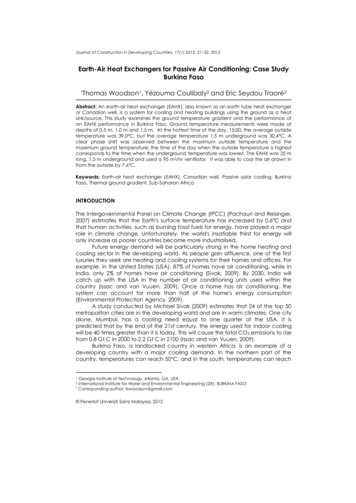
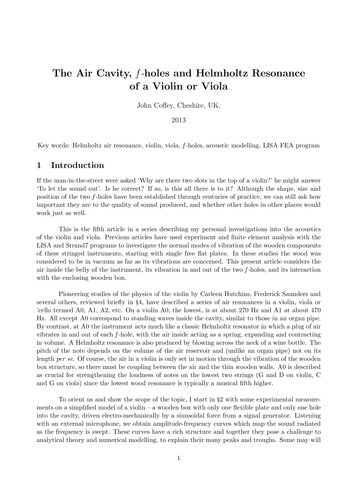
On the premise that measuring the amplitude-frequency response under different conditionsof the air cavity might give some clues as to the functioning of the cavity and aperture, I carried outa second set of measurements on Box C with the 14 mm wide aperture. I removing all the cushionsexcept the one supporting the box, leaving everything else as it was. With the cushions removed wehear more sound direct from the flexible back plate where the driving force is applied. The cavitywas changed in turn by covering it with the MDF block, sealing it with modelling clay (Plasticine)and filling the box with light polystyrene balls (‘bean bag filling’). The four amplitude-frequencycurves in Figure 4 were collected with the same driving amplitude and same microphone gain so asto be directly comparable.1. The A0 resonance at 156 Hz is suppressed by any method of closing the hole.2. The modelling clay would give the closest seal, so the spike at about 680 Hz in the secondgreen curve, for the MDF block covering the hole, must be to do with air leaking from underthe block. Similar peaks are seen in the two curves on the left.3. The large wide peak centred at 920 Hz when the cavity is filled with polystyrene balls hasno counterpart in the other three curves, so must be something to do with modifying theresonances and/or transmission of sound through the box. The balls are so light that they aremost unlikely to apply any constraint directly onto the back plate.The third set of measurements explored further the effect of filling the cavity with polystyreneballs. I also enlarged the aperture to about double its width and recorded the curves in Figure 5 onthe same scale while I filled the cavity in stages with the balls. The second off bottom curve is forthe cavity full to capacity but the aperture otherwise unobstructed. The bottom curve is for the boxFigure 4: Four amplitude-frequency spectra, 50 to 1200 Hz, recorded under the same conditions,showing the effect of closing the air cavity by covering the 14 mm wide aperture with a woodenblock, sealing it with modelling clay, and filling the cavity with small polystyrene balls. Orangecurves are inverted.5
full of polystyrene and the aperture tightly covered with a plug of modelling clay. Again let us notethe salient points without yet trying to explain them:1. Widening the hole has moved the A0 Helmholtz resonance to 180 or 181 Hz. It gradually diesin amplitude as the air is displaced from the cavity.2. Similarly the peak at 573 Hz, the left of two twins in the top panel of Figure 5, fades away asthe box is filled.3. However, the right twin peak, at 685 Hz, persists so long as the aperture is open.4. The large peak at 1040 Hz (top panel) persists in a modified state as the cavity is filled; itbroadens and moves to lower frequencies.Figure 5: Amplitude received at external microphone over range 50 -1200 Hz from box increasinglyfilled with polystyrene balls then capped tight closed. Enlarged aperture 61 by 28 mm.6
5. The smaller peak at 1130 Hz does much the same.6. Completely sealing the hole quietens frequencies above about 700 Hz, but has the strange effectof making the sounds louder from 300 to 700 Hz. Very odd!So here in Figures 3, 4 and 5 we have a wide view of the phenomena, giving us plenty to think about.2.2Elementary acoustic characteristics of the boxI am not going to try to explain all the features of Figures 3, 4 and 5 in this article. However, toorient ourselves, let us note some elementary properties of Box C with its two sizes of aperture.I used the LISA finite element program to model the normal modes of the air cavity whenit is fully closed (no aperture). LISA has the facility to solve Helmholtz’s equation as explained in§6.2. Using a velocity of sound of 341 5 m/sec the predicted natural frequencies are at (Hz)502,1005,1068,1180,1467,1508,(1)1848.These are readily understood as standing wave modes as follows. Let a be the long dimension of thebox and b its width. The listed frequencies correspond to the following ratios of wavelength λ to boxdimension:a λ,2a λ,b λ,2a λλ& b ,22a λ & b λ,2a 3λ,2a 3λλ& b .22To match these predictions with experiment I set up the arrangement in Figure 6. A 6 mmdiameter electret microphone on two fine wires was placed inside the cavity through a small hole inthe side of the box, and sealed. The microphone’s output was input to a computer and digitisedvia the sound card at 44 1 kHz (CD quality) using the
be due primarily to the normal modes of the wooden plates, some to the air cavity, and some may depend in frequency and amplitude on coupling between wood and air. From these amplitude-frequency spectra we pick out the Helmholtz resonance, which is the central topic of this article. I hope to quantify the wider complexities in future articles. In §3 I describe my own experiments to observe .