Transcription
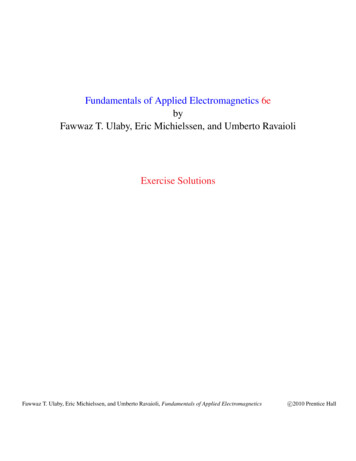
Normal and AbnormalExercise ResponsePotential MeasurementsSigns and symptomsHeart rate and blood pressureEKGCardiac output, stroke volumeVO2Anaerobic thresholdO2 pulseSystolic time intervalSkin temperatureWall motionHeart soundsNot just HR and BP!!Signs and SymptomsHeart Rate and BloodPressureNormal Responseflush skin, moistshortness of breathe, local muscular fatigueAbnormal Response (CAD)cool, clammy skinperipheral cyanosisdizziness, ataxia, nausea, confusionangina during exercise, disappears inrecoveryNormal Peak Blood PressuresACSM Fig 6-1Abnormal HR and BPresponses HR responsepoor conditioning, dysrhythmia HR responseconduction defect, ischemia, LV dysfunction BP response ( 225/90)future hypertensive SBP (exercise-induced hypotension)valve disease, CAD, LV dysfunction1
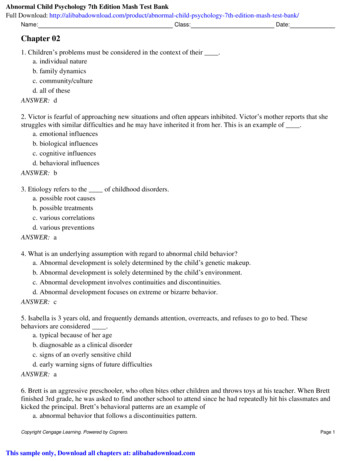
CAD HR and BP ex responseDelta Heart RateDifference between resting and maximalHR responseThe lower the delta HR, the higher themortalityPressure Pulse Product(Double Product)Double Product and coronary arteryocclusionSBP x HRIndex ofmyocardialoxygenconsumptionCardiac Output, StrokeVolumeInvasive measures: Swan-Ganz catheter isintroduced into the pulmonary arteryCardiac Output vs. WorkRateThompson 01, pg 5Flow sensor: direct FickThermistor: thermal dilutionNon-invasive measures: rebreathingtechniques, continuous-wave Doppler2
Normal Stroke VolumeResponseEDV and ESV during exerciseSV EDV -ESVIn upright position, SV increases initially with exerciseCardiac ContractilityEjection FractionEF EDV - ESV / EDV resting value about 60% exercise value, increases to 80-85%ESVvolume of blood left in the heart aftercontractionWhy are VO2measurements obtained?VO2 measurement is more reliable thanestimates from cycle or treadmill eqnsPeak VO2 is most accurate measurementof functional capacity and index of overallcardiopulmonary healthHeart and lung diseases will be evidentfrom gas exchange abnormalitiesIncrease SV with exercise is due to EDV and ESVCAD CO, HR, and SVresponsesCAD patients may have constriction incoronary arteriesConstriction causes ischemia and pump fnCardiac output may not rise normallySV may not increase normallyHR response may be blunted (independentof drugs) and may even decreaseOxygen ConsumptionThe most notable result of CAD is VO2maxvariable response (depends on amount ofmyocardium involved and severity ofischemia) VO2 at submaximal levels of exerciseoxygen kinetics are slowermore reliance on anaerobic energyproduction during exercise3
Maximal Exercise O2variablesSubjectCADNormalAthleteVO2HR SVCO a-vO2ml/minbpml/min150030005600175 50 8.8 17.0190 100 19.0 15.8180 180 32.5 17.0ml/bml/dlRoberts 97, pg 109Roberts 97, pg 106Anaerobic threshold orventilatory thresholdNormal AT responseAT has been described as the breakpt inVe associated with lactate accumulationand muscle anaerobiosisAT probably reflects a balance betweenlactate production and removalExercise beyond AT is associated withmetabolic acidosis, hyperventilation, andreduced capacity to perform workAT response in CADAT 40%VO2max is below 95%confidence for sedentary subjects AT is assoc with CAD and is a sign of acondition that limits O2 flow to musclesOther tests are needed to differentiatewhether problem is cardiovascular,respiratory or metabolicWasserman86, pg 35O2 pulseO2 pulse VO2/HRO2 pulse SV x a-vO2 differenceWith exercise, O2 pulse increases due to a-v O2 difference and SV (upright)In CAD, the rise in O2 pulse is bluntedbecause SV is reduced4
OAD obstr airwaysdiseaseHD heart diseaseSkin TemperaturesSkin temperatures measured on the chestThermistorsThermoscanDuring angina, a cold area develops overthe heart due to vasoconstrictionAppears about 1 min before painWasserman 86, pg 37Systolic Time IntervalsMeasure byPhonocardiogramCarotid pulse sensorBallistocardiogramProlonged STI could indicate coronaryinsufficiency, decreased ventricular function,increased TPR, abnormal wall motionsHeart Sounds1. A-V valves close at onsetof systole, bloodrumbling (lub)2. Aortic then pulmonicvalves close at onset ofdiastole (dub)3. Rapid filling in earlydiastole, sound occurswith decreasedventricular distensibility4. Atrial contractionBad Heart SoundsSound 1, should be loud and powerfulMitral murmur, prolapsed mitral leaflet (10% of pop)Sound 2, splitting may be LBBB and decreased right orleft ventricle functionAortic murmur, aortic stenosisSound 3, associated with poor ventricular functionSound 4, common in ischemic heart disease ormyocardial disease.Conclusions:The predictive value of exercise testingis improved by considering exerciseresponses in addition to EKGReduced VO2maxBlunted hemodynamic responseLowered ATLowered O2 pulseProlonged STIUnusual sounds or palpations5
Bad Heart Sounds aSound 1, should be loud and powerful Mitral murmur, prolapsed mitral leaflet (10% of pop) aSound 2, splitting may be LBBB and decreased right or left ventricle function Aortic murmur, aortic stenosis aSound 3, associated with poor ventricular function aSound 4, common in ischemic heart disease or myocardial disease. Conclusions:


![[Unlocked] Chapter 16: Psychological Disorders](/img/28/chap16-20psy.jpg)