Transcription
Applied Biosystems Standard Curve AnalysisModuleUSER GUIDEPublication Number MAN0014819Revision B.0For Research Use Only. Not for use in diagnostic procedures.
The information in this guide is subject to change without notice.DISCLAIMERTO THE EXTENT ALLOWED BY LAW, LIFE TECHNOLOGIES AND/OR ITS AFFILIATE(S) WILL NOT BE LIABLE FOR SPECIAL, INCIDENTAL, INDIRECT,PUNITIVE, MULTIPLE, OR CONSEQUENTIAL DAMAGES IN CONNECTION WITH OR ARISING FROM THIS DOCUMENT, INCLUDING YOUR USE OF IT.REVISION HISTORY: History of Pub. no. MAN0010504RevisionDateB.0March 2015A.0September 2015DescriptionSoftware user interface updatesDocument releaseNOTICE TO PURCHASER: DISCLAIMER OF LICENSE: Purchase of this software product alone does not imply any license under any process,instrument or other apparatus, system, composition, reagent or kit rights under patent claims owned or otherwise controlled by Life TechnologiesCorporation, either expressly, or by estoppel.Corporate entity: Life Technologies Corporation Carlsbad, CA 92008 USA Toll Free in USA 1 800 955 6288TRADEMARKS: All trademarks are the property of Thermo Fisher Scientific and its subsidiaries unless otherwise specified. 2016 Thermo Fisher Scientific Inc. All rights reserved.
Contents CHAPTER 1 Getting Started . . . . . . . . . . . . . . . . . . . . . . . . . . . . . . . . . . . . . . . . . . . . . 6About the software . . . . . . . . . . . . . . . . . . . . . . . . . . . . . . . . . . . . . . . . . . . . . . . . . . . . . . . . . . . . . . 6Analysis workflow . . . . . . . . . . . . . . . . . . . . . . . . . . . . . . . . . . . . . . . . . . . . . . . . . . . . . . . . . . . . . . . 7Compatible Real-Time PCR System Data . . . . . . . . . . . . . . . . . . . . . . . . . . . . . . . . . . . . . . . . . . . 8System requirements . . . . . . . . . . . . . . . . . . . . . . . . . . . . . . . . . . . . . . . . . . . . . . . . . . . . . . . . . . . . 9About the software interface . . . . . . . . . . . . . . . . . . . . . . . . . . . . . . . . . . . . . . . . . . . . . . . . . . . . . 10Best practices and tips for using the software . . . . . . . . . . . . . . . . . . . . . . . . . . . . . . . . . . . . . 10 CHAPTER 2 Manage experiment data . . . . . . . . . . . . . . . . . . . . . . . . . . . . . . . . 11Create a project and add experiment data . . . . . . . . . . . . . . . . . . . . . . . . . . . . . . . . . . . . . . . . . 11Manage projects and experiment data . . . . . . . . . . . . . . . . . . . . . . . . . . . . . . . . . . . . . . . . . . . . 12Share experiments, folders, and projects . . . . . . . . . . . . . . . . . . . . . . . . . . . . . . . . . . . . . . . . . 13About experiment data/files . . . . . . . . . . . . . . . . . . . . . . . . . . . . . . . . . . . . . . . . . . . . . . . . . . . . . 15 CHAPTER 3 Set up the project . . . . . . . . . . . . . . . . . . . . . . . . . . . . . . . . . . . . . . . . . 16Manage samples and targets . . . . . . . . . . . . . . . . . . . . . . . . . . . . . . . . . . . . . . . . . . . . . . . . . . . . 16Import sample information from design files . . . . . . . . . . . . . . . . . . . . . . . . . . . . . . . . . . . . . . 17Import target information from AIF files . . . . . . . . . . . . . . . . . . . . . . . . . . . . . . . . . . . . . . . . . . 17 CHAPTER 4 Edit experiment properties . . . . . . . . . . . . . . . . . . . . . . . . . . . . . . 18Review and edit the plate setups . . . . . . . . . . . . . . . . . . . . . . . . . . . . . . . . . . . . . . . . . . . . . . . . . 19Apply samples and targets . . . . . . . . . . . . . . . . . . . . . . . . . . . . . . . . . . . . . . . . . . . . . . . . . . . . . . 19Specify and assign tasks . . . . . . . . . . . . . . . . . . . . . . . . . . . . . . . . . . . . . . . . . . . . . . . . . . . . . . . . 20Specify and assign standards . . . . . . . . . . . . . . . . . . . . . . . . . . . . . . . . . . . . . . . . . . . . . . . . . . . . 21Apply plate setup information using a template file . . . . . . . . . . . . . . . . . . . . . . . . . . . . . . . . . 23Template files . . . . . . . . . . . . . . . . . . . . . . . . . . . . . . . . . . . . . . . . . . . . . . . . . . . . . . . . . . . . . . . . . 24Applied Biosystems Standard Curve Analysis Module3
Contents CHAPTER 5 Review the quality data and results . . . . . . . . . . . . . . . . . . . . . 26Specify a master standard curve and/or inter-plate controls . . . . . . . . . . . . . . . . . . . . . . . . . 26Configuring the analysis settings . . . . . . . . . . . . . . . . . . . . . . . . . . . . . . . . . . . . . . . . . . . . . . . . . 30Reviewing amplification and quality data . . . . . . . . . . . . . . . . . . . . . . . . . . . . . . . . . . . . . . . . . . 32About the quality data summary . . . . . . . . . . . . . . . . . . . . . . . . . . . . . . . . . . . . . . . . . . . . . . . . . 34Omit wells from the analysis . . . . . . . . . . . . . . . . . . . . . . . . . . . . . . . . . . . . . . . . . . . . . . . . . . . . 35 CHAPTER 6 Export the results . . . . . . . . . . . . . . . . . . . . . . . . . . . . . . . . . . . . . . . . 36Export the analyzed data from a project . . . . . . . . . . . . . . . . . . . . . . . . . . . . . . . . . . . . . . . . . . . 36Export project data as a slide presentation . . . . . . . . . . . . . . . . . . . . . . . . . . . . . . . . . . . . . . . . 37Export plots for presentation and publication . . . . . . . . . . . . . . . . . . . . . . . . . . . . . . . . . . . . . . 38Export data for use in other projects . . . . . . . . . . . . . . . . . . . . . . . . . . . . . . . . . . . . . . . . . . . . . . 39 CHAPTER 7 Screens and plots . . . . . . . . . . . . . . . . . . . . . . . . . . . . . . . . . . . . . . . . . 41Amplification Plot . . . . . . . . . . . . . . . . . . . . . . . . . . . . . . . . . . . . . . . . . . . . . . . . . . . . . . . . . . . . . . 42Multicomponent Plot . . . . . . . . . . . . . . . . . . . . . . . . . . . . . . . . . . . . . . . . . . . . . . . . . . . . . . . . . . . 43Standard Curve Plot . . . . . . . . . . . . . . . . . . . . . . . . . . . . . . . . . . . . . . . . . . . . . . . . . . . . . . . . . . . . 44Well Table . . . . . . . . . . . . . . . . . . . . . . . . . . . . . . . . . . . . . . . . . . . . . . . . . . . . . . . . . . . . . . . . . . . . . 46 CHAPTER 8 Quality flags . . . . . . . . . . . . . . . . . . . . . . . . . . . . . . . . . . . . . . . . . . . . . . . 48AMPNC (Amplification in negative control) quality flag . . . . . . . . . . . . . . . . . . . . . . . . . . . . . . 49AMPSCORE (Low signal in linear phase) quality flag . . . . . . . . . . . . . . . . . . . . . . . . . . . . . . . . 49BADROX (Bad passive reference signal) quality flag . . . . . . . . . . . . . . . . . . . . . . . . . . . . . . . . 50BLFAIL (Baseline algorithm failed) quality flag . . . . . . . . . . . . . . . . . . . . . . . . . . . . . . . . . . . . . 50CQCONF (Calculated confidence in the Cq value is low) quality flag . . . . . . . . . . . . . . . . . . . 51CRTAMPLITUDE (Broad Cq Amplitude) quality flag . . . . . . . . . . . . . . . . . . . . . . . . . . . . . . . . . 51CRTNOISE (Cq Noise) quality flag . . . . . . . . . . . . . . . . . . . . . . . . . . . . . . . . . . . . . . . . . . . . . . . . . 51CTFAIL (Cq algorithm failed) quality flag . . . . . . . . . . . . . . . . . . . . . . . . . . . . . . . . . . . . . . . . . . 51DRNMIN (Detection of minimum DRn due to abnormal baseline) quality flag . . . . . . . . . . . 52EXPFAIL (Exponential algorithm failed) quality flag . . . . . . . . . . . . . . . . . . . . . . . . . . . . . . . . . 52HIGHSD (High standard deviation in replicate group) quality flag . . . . . . . . . . . . . . . . . . . . . 53 LOWROX (Low ROX Intensity) quality flag . . . . . . . . . . . . . . . . . . . . . . . . . . . . . . . . . . . . . . . . . 54MTP (Melt curve analysis shows more than one peak) quality flag . . . . . . . . . . . . . . . . . . . . 54NOAMP (No amplification) quality flag . . . . . . . . . . . . . . . . . . . . . . . . . . . . . . . . . . . . . . . . . . . . 54NOISE (Noise higher than others in plate) quality flag . . . . . . . . . . . . . . . . . . . . . . . . . . . . . . . 55NOSAMPLE (No sample assigned to well) quality flag . . . . . . . . . . . . . . . . . . . . . . . . . . . . . . . 55NOSIGNAL (No signal in well) quality flag . . . . . . . . . . . . . . . . . . . . . . . . . . . . . . . . . . . . . . . . . 55OFFSCALE (Fluorescence is offscale) quality flag . . . . . . . . . . . . . . . . . . . . . . . . . . . . . . . . . . . 56OUTLIERRG (Outlier in replicate group) quality flag . . . . . . . . . . . . . . . . . . . . . . . . . . . . . . . . . 574Applied Biosystems Standard Curve Analysis Module
ContentsPRFDROP (Passive reference signal changes significantly near the Cq/Ct) quality flag . . 57PRFLOW (Average passive reference signal is below the threshold) quality flag . . . . . . . . 58SPIKE (Noise spikes) quality flag . . . . . . . . . . . . . . . . . . . . . . . . . . . . . . . . . . . . . . . . . . . . . . . . . 59THOLDFAIL (Thresholding algorithm failed) quality flag . . . . . . . . . . . . . . . . . . . . . . . . . . . . . 59 APPENDIX A Documentation and support . . . . . . . . . . . . . . . . . . . . . . . . . . . . 61Customer and technical support . . . . . . . . . . . . . . . . . . . . . . . . . . . . . . . . . . . . . . . . . . . . . . . . . 61Limited product warranty . . . . . . . . . . . . . . . . . . . . . . . . . . . . . . . . . . . . . . . . . . . . . . . . . . . . . . . 61Glossary . . . . . . . . . . . . . . . . . . . . . . . . . . . . . . . . . . . . . . . . . . . . . . . . . . . . . . . . . . . . . . . . . . . 62Applied Biosystems Standard Curve Analysis Module5
1Getting Started About the software . . . . . . . . . . . . . . . . . . . . . . . . . . . . . . . . . . . . . . . . . . . . . . . . . . . . 6Analysis workflow . . . . . . . . . . . . . . . . . . . . . . . . . . . . . . . . . . . . . . . . . . . . . . . . . . . . 7Compatible Real-Time PCR System Data . . . . . . . . . . . . . . . . . . . . . . . . . . . . . . . . . 8System requirements . . . . . . . . . . . . . . . . . . . . . . . . . . . . . . . . . . . . . . . . . . . . . . . . . . 9About the software interface . . . . . . . . . . . . . . . . . . . . . . . . . . . . . . . . . . . . . . . . . . . 10Best practices and tips for using the software . . . . . . . . . . . . . . . . . . . . . . . . . . . . . 10The Applied Biosystems Analysis Software is a secure web application for analysisof data generated on Thermo Fisher Scientific real-time PCR instruments. Thesoftware provides project-based analysis of real-time and end-point data for a varietyof quantitative and qualitative PCR applications.About the softwareThe Standard Curve (SC) module of the Applied Biosystems Analysis Softwareperforms absolute quantification analysis of standard curve experiments run onThermo Fisher Scientific real-time qPCR instruments. The standard curve method isused to determine the absolute target quantity in samples. With the standard curvemethod, the Applied Biosystems Analysis Software measures amplification of thetarget in samples and in a standard dilution series. Data from the standard dilutionseries are used to generate the standard curve. Using the standard curve, the softwareinterpolates the absolute quantity of target in the samples.Required experiment componentsThe following components are required to perform a standard curve analysis andmust be present on all experiments added to the project: Samples – The sample in which the quantity of the target is unknown. Standard – A sample that contains known standard quantities; used inquantitation experiments to generate standard curves. Standard dilution series – A set of standards containing a range of knownquantities. The standard dilution series is prepared by serially diluting standards. Replicates – The total number of identical reactions containing identical samples,components, and volumes. Negative Controls – Wells that contain water or buffer instead of sampletemplate. No amplification of the target should occur in negative control wells.6Applied Biosystems Standard Curve Analysis Module
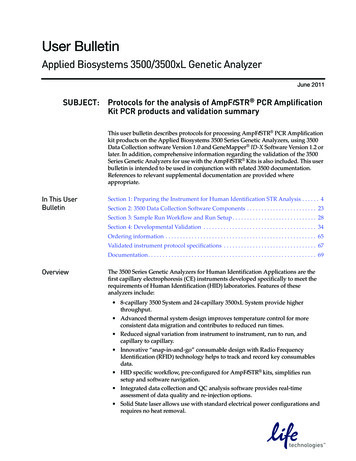
Chapter 1 Getting StartedAnalysis workflow1Analysis workflowThe following figure shows the general workflow for analyzing standard curveprojects using the Applied Biosystems Analysis Software.STARTqCreate a projectqImport and add experiment dataq(Optional) Add and define samples and targetsqReview/edit the sample, target, task, and standard configurations ofthe experimentsqReview the results of the analysis and adjust the settings (if necessary)qPublish the project dataqFINISHApplied Biosystems Standard Curve Analysis Module7
1Chapter 1 Getting StartedCompatible Real-Time PCR System DataCompatible Real-Time PCR System DataThe Applied Biosystems Analysis Software can import and analyze data generatedby any of the supported instruments listed in the following table. The softwareversions listed in the table represent only those tested for use with the AppliedBiosystems Software. Data generated by versions other than those listed can beimported and analyzed by the software, but are not supported by Thermo FisherScientific.IMPORTANT! The Applied Biosystems Analysis Software can import and analyzedata from unsupported versions of the instrument software; however, we cannotguarantee the performance of the software or provide technical support for theanalyses.Real-Time PCR SystemSupported softwareversion(s)Applied Biosystems 7900 HT Fast Real-Time PCRSystemv2.4 or later Applied Biosystems 7500 and 7500 Fast RealTime PCR System Applied Biosystems StepOne and StepOnePlusReal-Time PCR Systemv2.0.5 or later Applied Biosystems QuantStudio 12K Flex RealTime PCR SystemApplied Biosystems QuantStudio 5 Real-TimePCR SystemApplied Biosystems QuantStudio 6 Flex RealTime PCR SystemApplied Biosystems QuantStudio 7 Flex RealTime PCR System8.sdsv1.4.1 or laterApplied Biosystems ViiA 7 Real-Time PCRSystemApplied Biosystems QuantStudio 3 Real-TimePCR SystemFileextensionv2.0.1, v2.1, or laterv1.1 or laterv1.1.1 or later.edsv1.0 or laterv1.0 or laterApplied Biosystems Standard Curve Analysis Module
Chapter 1 Getting StartedSystem requirements1System requirementsThe following table summarizes the system requirements for the user environment.Applied Biosystems Analysis Software performance may vary based on your systemconfiguration.CategoryWeb BrowserRequirement Apple Safari 8 Browser Google Chrome Browser Version 21 or later Microsoft Internet Explorer Browser Version 10 or later Mozilla Firefox Browser Version v10.0.12 or laterOperatingSystemNetworkConnectivity Windows XP, Vista, 7, or 8 Macintosh OS 8 or laterAn internet connection capable of 300kbps/300kbps (upload/download)or better.If your network employs a firewall that restricts outbound traffic, itmust be configured to allow outbound access toapps.lifetechnologies.com on HTTPS-443.Applied Biosystems Standard Curve Analysis Module9
1Chapter 1 Getting StartedAbout the software interfaceAbout the software interfaceThe Applied Biosystems Software features a simple interface for analyzingexperiment data and includes the following buttons/icons in many of the screens andplots:45678931021111212345Analysis Modules – Click to analyze the current projectusing the selected module.(Data Manager) – Click to view the Data Manager,which can be used to view, add, or remove data from thecurrent project.(Project Manager) – Click to view the ProjectManager, which can be used to modify the current projector open another.(Account Management Menu) – Click to manage yourapplication licenses or storage.Project name – The name of the current project.Note: Clickto close the project.Project tabs – Click to view the settings, data, or plot(s)for the current project.7(Notifications) – Click to view important informationand notifications for the current project. The digit withinthe icon indicates the number of messages.(Help) – Click to access help topics relevant to thecurrent settings, data, or plot that you are viewing.9(Profile Menu) – Click to change your profile settingsor to log out of the Applied Biosystems Software.10 Analyze – Click to analyze the project after you havemade a change.11(Zoom) – Click to magnify the related table or plot tofill the screen.8Note: Once expanded, click(Close) to collapse theplot or table to its original size.12 Actions – Click to select from a list of actions that pertainto the related table or plot.6Best practices and tips for using the softwareThe Applied Biosystems Analysis Software provides a variety of useful userinterface elements that will enable you to better organize your data for analysis andpresentation. This topic describes the essentials of the user interface and how to bestuse them.Perform the following actions to help ensure optimal performance of the AppliedBiosystems Software: Refresh your browser regularly Clear your browser cache10Applied Biosystems Standard Curve Analysis Module
2Manage experiment data Create a project and add experiment data . . . . . . . . . . . . . . . . . . . . . . . . . . . . . . . . 11Manage projects and experiment data . . . . . . . . . . . . . . . . . . . . . . . . . . . . . . . . . . . 12Share experiments, folders, and projects . . . . . . . . . . . . . . . . . . . . . . . . . . . . . . . . . 13About experiment data/files . . . . . . . . . . . . . . . . . . . . . . . . . . . . . . . . . . . . . . . . . . . 15Use the Data Manager screen to add and remove experiments to and from yourproject. The screen displays all experiments associated with the current project. Youcan also use the Data Manager to upload new .eds and .sds files or view the details ofindividual experiments already added to the project.Create a project and add experiment data1. Click(Manage Projects) to view the Dashboard.2. Create the project:New Project.a. Clickb. In the Create Project dialog box, enter a name for the project, select thefolder within which you want to place the project, then click OK.Note: The project name cannot exceed 50 characters and cannot include anyof the following characters: / \ * ? " : ; & % @ ( ) !Applied Biosystems Standard Curve Analysis Module11
2Chapter 2 Manage experiment dataManage projects and experiment data3. From the Manage Data screen, add any additional experiment data to the project.To importexperiment datastored on Action1. Click Import from local.2. From the Open dialog box, select one or more experimentfiles (.sds or .eds), then click Open.Your computerNote: Ctrl- or Shift-click to select multiple files.Wait for the Applied Biosystems Software to upload theselected data.3. Click Close prompted that the import is complete.1. Click Import from Thermo Fisher Cloud.Thermo FisherCloud2. Select one or more experiment files (.sds or .eds) fromthe table, then click Add.3. When you are done adding files to the queue, click OK.4. Click Close prompted that the import is complete.4. Repeat step 3 until your project contains all of the desired experiment data.5. Click the appropriate analysis module on the left side of the screen to begin theanalysis.Manage projects and experiment dataUse the Manage Data screen to add and remove experiment data to/from your project: Add experiment data to your project:a. While viewing your project, clickside of the screen.(Manage Data) from the bar on the leftb. From the Manage Data screen, add any additional experiment data to theproject.To importexperiment datastored on Action1. Click Import from local.Your computer2. From the Open dialog box, select one or moreexperiment files (.sds or .eds), then click Open.Note: Ctrl- or Shift-click to select multiple files.1. Click Import from Thermo Fisher Cloud.Thermo FisherCloud2. Select one or more experiment files (.sds or .eds)from the table, then click Add.3. When you are done adding files to the queue, click OK.12Applied Biosystems Standard Curve Analysis Module
Chapter 2 Manage experiment dataShare experiments, folders, and projects2c. Wait for the Applied Biosystems Software to import the selected data.When you are prompted that the upload is complete, click Close. Delete projects, experiments, or folders:a. Select the experiments from the Files in this project table that you want toremove.b. From the Manage Data screen, select Actions4Delete.c. When prompted, click OK to remove the experiment(s) from your project.Note: Click the appropriate analysis module on the left side of the screen to return tothe analysis.Share experiments, folders, and projectsThe Applied Biosystems Analysis Software allows you to share any data(experiments, folders, and projects) with other users that have access to the software.Sharing data with other users grants them different access to the data depending onthe type of object shared: Projects – Sharing a project with other users grants them read/write access to theunlocked project.IMPORTANT! A project is locked (preventing access) when it is open (in use) byany user with shared access to the project. For example, User A shares a projectwith two colleagues (User B and User C), User B opens the project and beginsdata analysis (the project is locked and unavailable to Users A and C) until User Bcloses the project at which time it is available again to all three users. Experiments – Sharing experiment files with other users grants them full accessto the data, allowing them to import the data to their own projects or downloadthe experiment data file. Folders – Sharing a folder with another user grants access to the contents of thefolder (projects, experiments, and subfolders).To share projects, experiments, and subfolders with another user: Share an experiment, folder, or project:(Home), then clickAll Files to view your data.a. Clickb. From the Home Folder screen, select the check box to the left of the object(display(project, experiment, or folder) that you want to share, then clickdetails).Applied Biosystems Standard Curve Analysis Module13
2Chapter 2 Manage experiment dataShare experiments, folders, and projectsc. Enter the email address of the user with whom you want to share theselected object, then click .The user is notified via email that you have shared with them and the shared itemwill appear in their Home Folder.IMPORTANT! To share multiple files:1. Select the desired objects (projects, experiments, and subfolders) from theHome Folder screen, then click Actions4Share.2. In the Share Files dialog box, enter the email address of the user with whomyou want to share the selected objects, then click Share. Un-share a file, folder, or project:(Home), then clicka. ClickAll Files to view your data.b. Select the shared object, then click the display detailsicon.c. In the details pane, select the Shared With tab, then click un-share adjacentto the email address of the user from which you want to remove sharingprivileges.The selected users are notified via email that you are no longer sharing thespecified file with them and the shared file(s) will no longer appear in theirHome Folder.14Applied Biosystems Standard Curve Analysis Module
Chapter 2 Manage experiment dataAbout experiment data/files2About experiment data/filesThe Applied Biosystems Analysis Software can import and analyze experiment files(.eds and .sds) that are generated by a variety of Thermo Fisher Scientific real-timeqPCR instruments. Every consumable run on a Thermo Fisher Scientific real-timeqPCR instrument requires the creation of one or more experiment files that store theassociated data. Each experiment file is a virtual representation of a specificconsumable (plate, array, or chip) that contains data for all aspects of the qPCRexperiment.Experiment files contain the following information: Target information and arrangement on the plate Sample information and arrangement on the plate Method parameters for the runFile compatibilityThe Applied Biosystems Software can import data the following experiment fileformats generated by Applied Biosystems real-time qPCR instruments:IMPORTANT! The Applied Biosystems Analysis Software can import and analyzedata from unsupported versions of the instrument software; however, we cannotguarantee the performance of the software or provide technical support for theanalyses.Real-Time PCR SystemSupported softwareversion(s)Applied Biosystems 7900 HT Fast Real-Time PCRSystemv2.4 or later Applied Biosystems 7500 and 7500 Fast RealTime PCR SystemApplied Biosystems StepOne and StepOnePlus Real-Time PCR SystemApplied Biosystems ViiA 7 Real-Time PCRSystemApplied Biosystems QuantStudio 12K Flex RealTime PCR SystemApplied Biosystems QuantStudio 3 Real-TimePCR SystemApplied Biosystems QuantStudio 5 Real-TimePCR SystemApplied Biosystems QuantStudio 6 Flex RealTime PCR SystemApplied Biosystems QuantStudio 7 Flex RealTime PCR SystemApplied Biosystems Standard Curve Analysis ModuleFileextension.sdsv1.4.1 or laterv2.0.5 or laterv2.0.1, v2.1, or laterv1.1 or laterv1.1.1 or later.edsv1.0 or laterv1.0 or later15
3Set up the project Manage samples and targets . . . . . . . . . . . . . . . . . . . . . . . . . . . . . . . . . . . . . . . . . . . 16Import sample information from design files . . . . . . . . . . . . . . . . . . . . . . . . . . . . . 17Import target information from AIF files . . . . . . . . . . . . . . . . . . . . . . . . . . . . . . . . 17After importing one or more experiments (.eds or .sds files) into your HRM project,use the Overview screen to set up the project.Manage samples and targetsThe Applied Biosystems Analysis Software populates the Overview screen with thesamples and targets present in the experiments added to the project. If necessary, youcan add, edit, or remove the samples and targets as needed before the analysis. Create a new sample or target:a. From the Samples or Targets table in the Overview screen,click Actions4Add.b. In the New Sample/Target dialog box, enter a name for the new sample ortarget (up to 256 characters), then edit the properties of the newsample/target.c. Click OK. Update an existing sample or target by editing the entry directly in the table.Note: Alternately, select a sample or target from the table, thenselect Actions4Assign/Update. Delete a sample or target:a. From the Samples or Targets table in the Overview screen, select the sampleor target of interest, then click Actions4Delete.b. In the confirmation dialog box, click OK to delete the sample or target.16Applied Biosystems Standard Curve Analysis Module
Chapter 3 Set up the projectImport sample information from design files3Import sample information from design filesThis Applied Biosystems Analysis Software Analysis Module does not supportsample import by design file. To populate your project with samples, enter themdirectly into the Samples list in the Overview screen. For more information onentering sample information, see “Manage samples and targets“ on page 16.Import target information from AIF filesFor convenience, the Applied Biosystems Software can import target informationdirectly from assay information files (.aif), which are supplied with assaysmanufactured by Thermo Fisher Scientific. AIF are tab-delimited data files providedon a CD shipped with each assay order. The file name includes the number from thebarcode on the plate.1. From the Targets table in the Overview screen, click Actions4Import AIF File.2. Locate the .aif file with the target information, then click Open.If the import is successful, the target is populated to the appropriate table. If a targetof the same target name is already present in the project, it is overwritten with theinformation from the AIF.Note: Assay/target name matching is not case sensitive.Applied Biosystems Standard Curve Analysis Module17
4Edit experiment properties Review and edit the plate setups . . . . . . . . . . . . . . . . . . . . . . . . . . . . . . . . . . . . . . . 19Apply samples and targets . . . . . . . . . . . . . . . . . . . . . . . . . . . . . . . . . . . . . . . . . . . . 19Specify and assign tasks . . . . . . . . . . . . . . . . . . . . . . . . . . . . . . . . . . . . . . . . . . . . . . . 20Specify and assign standards . . . . . . . . . . . . . . . . . . . . . . . . . . . . . . . . . . . . . . . . . . 21Apply plate setup information using a template file . . . . . . . . . . . . . . . . . . . . . . . 23Template files . . . . . . . . . . . . . . . . . . . . . . . . . . . . . . . . . . . . . . . . . . . . . . . . . . . . . . . . 24After populating your project with samples, targets, and controls, use the Plate Setupscreen to make changes to the plate setups of the experiments added to your project.The editor can be used to edit sample, target, task, and control assignments to correctmissing or incorrect settings.18Applied Biosystems Standard Curve Analysis Module
Chapter 4 Edit experiment propertiesReview and edit the plate setups4Review and edit the plate setupsAfter configuring your project with all necessary samples and targets, use the PlateSetup screen to review the experiments for problems that can prevent the analysis ofthe project. The Applied Biosystems Analysis Software displays plate configurationerrors that can prohibit analysis in the margin beneath each image of the relatedexperiment. Before you can analyze your project, you must use the Plate Setup screento address them.To review the plate setup information for your project:1. Select Plate Setup to display Plate Setup screen.2. From the Plate Setup screen, review the experiment records for errors.3. If errors are present, click the experiment record of interest and address theproblem that is preventing the analysis of the file.Note: The software displays plate configuration problems that will preventanalysis of an experiment beneath the image of the related plate.
data from unsupported versions of the instrument software; however, we cannot guarantee the performance of the software or provide technical support for the analyses. Real-Time PCR System Supported software version(s) File extension Applied Biosystems 7900 HT Fast Real-Time PCR System v2.4 or later.sds Applied Biosystems 7500 and 7500 .