Transcription
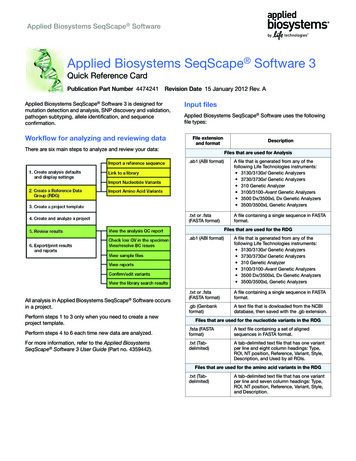
Applied Biosystems SeqScape SoftwareApplied Biosystems SeqScape Software 3Quick Reference CardPublication Part Number 4474241Revision Date 15 January 2012 Rev. AApplied Biosystems SeqScape Software 3 is designed formutation detection and analysis, SNP discovery and validation,pathogen subtyping, allele identification, and sequenceconfirmation.Workflow for analyzing and reviewing dataInput filesApplied Biosystems SeqScape Software uses the followingfile types:File extensionand formatThere are six main steps to analyze and review your data:DescriptionFiles that are used for Analysis.ab1 (ABI format)A file that is generated from any of thefollowing Life Technologies instruments: 3130/3130xl Genetic Analyzers 3730/3730xl Genetic Analyzers 310 Genetic Analyzer 3100/3100-Avant Genetic Analyzers 3500 Dx/3500xL Dx Genetic Analyzers 3500/3500xL Genetic Analyzers.txt or .fsta(FASTA format)A file containing a single sequence in FASTAformat.Files that are used for the RDGAll analysis in Applied Biosystems SeqScape Software occursin a project.Perform steps 1 to 3 only when you need to create a newproject template.ab1 (ABI format)A file that is generated from any of thefollowing Life Technologies instruments: 3130/3130xl Genetic Analyzers 3730/3730xl Genetic Analyzers 310 Genetic Analyzer 3100/3100-Avant Genetic Analyzers 3500 Dx/3500xL Dx Genetic Analyzers 3500/3500xL Genetic Analyzers.txt or .fsta(FASTA format)A file containing a single sequence in FASTAformat.gb (Genbankformat)A text file that is dowloaded from the NCBIdatabase, then saved with the .gb extension.Files that are used for the nucleotide variants in the RDGPerform steps 4 to 6 each time new data are analyzed.fsta (FASTAformat)A text file containing a set of alignedsequences in FASTA format.For more information, refer to the Applied BiosystemsSeqScape Software 3 User Guide (Part no. 4359442).txt (Tabdelimited)A tab-delimited text file that has one variantper line and eight column headings: Type,ROI, NT position, Reference, Variant, Style,Description, and Used by all ROIs.Files that are used for the amino acid variants in the RDG.txt (Tabdelimited)A tab-delimited text file that has one variantper line and seven column headings: Type,ROI, NT position, Reference, Variant, Style,and Description.
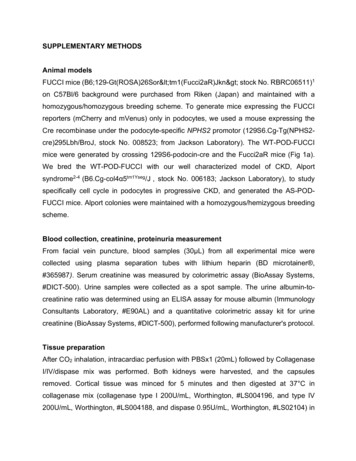
SeqScape Software 3 Quick Reference CardStep 1: Create analysis defaults and displaysettings3. Create default display settings:a. Select the Display Settings tab, then click New.1. Select Tools SeqScape Manager.2. Create default analysis settings:a. Select the Analysis Protocols tab, then click New.b. Complete the tabs by specifying a name and selectinga basecaller, mixed base settings, clear range, andfilter settings.c. Click OK.b. Complete the tabs to specify a name and displaycharacteristics for quality values, electropherograms,and views.c. Click Save.Step 2: Create an RDG1. In SeqScape Manager, select the Reference Data Grouptab, then click New.2. Select the tabs in succession to name the RDG, import thereference sequences, define layers and ROIs, link allelelibraries (optional), designate the start codon, import NTand AA variants, and select the variant display styles.d. In the SeqScape Manager main window, select theAnalysis Defaults tab, then click New.e. Complete the tabs to specify your settings, then clickSave.3. Click OK.Page 2
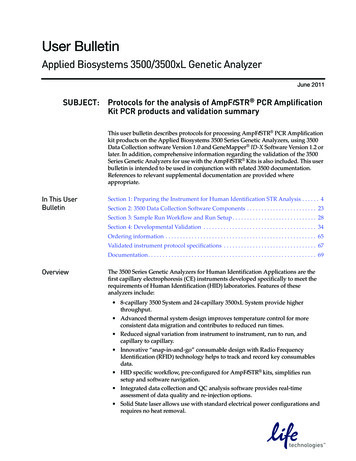
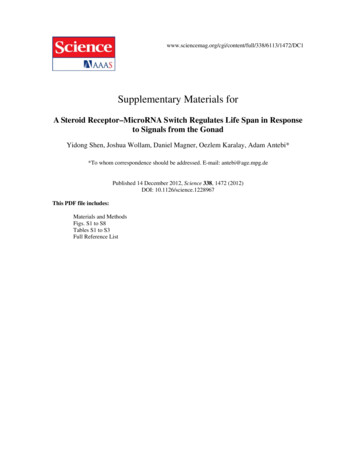
SeqScape Software v3 Quick Reference CardStep 3: Create a project template2. Add samples to the project automatically:(This requires that you have a common text delimiter ineach sample file name or sample name, and that all thesamples to be imported automatically are stored in asingle folder.)1. In SeqScape Manager, select the Project Templates tab,then select New.a. Click(Import Samples To Project).b. Enter a delimiter in the Specimen name delimiter field.c. If you use the sample name, deselect the Use samplefile name check box.d. Select the folder containing the sample files to add.e. Click Auto Add. The specimens are created and thesamples are imported automatically.2. Enter a name for the new template, then, in the drop-downlists, select the same RDG, analysis defaults, and displaysettings files that you created in the previous steps.3. Click OK.4. Close SeqScape Manager.Specimen nameDelimiterSample nameStep 4: Create and analyze a project1. Create a project:a. Click(New Project).f. When you finish adding samples, click OK.3. Clickb. Enter a new name in the Project Name field, select theproject template that you created in “Step 3:Create aproject template”, then click New.Page 3(Analyze Samples).
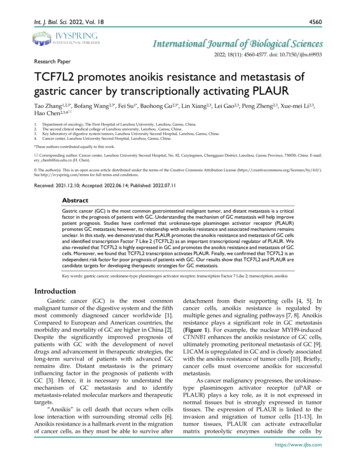
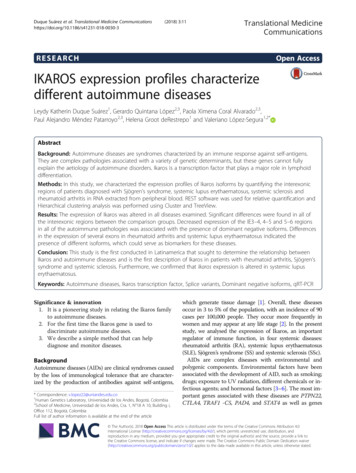
SeqScape Software 3 Quick Reference CardStep 5: Review the resultsSegmentDouble-click the header to arrange itemsin ascending or descending order1. Open the project of interest, then select the project namein the navigation pane.2. Select a layer in the Active Layer drop-down list.3. Check for analysis failures:a. Click(Report Manager), then select Analysis QCReport.Ctrl drag to reorder columnsc. Select a segment, then select the Assembly tab toview the segment sequence assembly.b. If blue diamonds, yellow triangles, or red circlesappear, check the data quality and analysis settings.Sample quality valuesc. Correct the analysis settings, then reanalyze the data ifnecessary.Consensus quality valuesd. Select a sample, then select the desired tab to view thesample results. Electropherogram data is shownbelow.4. Review the data in the project:a. Select a layer, then observe bases with low qualityvalues. Verify the basecalls of the consensussequence.ProjectQuality valuesSampleb. Select a segment, then select the Layout tab to viewthe segment sequence layout.Page 4Quality values
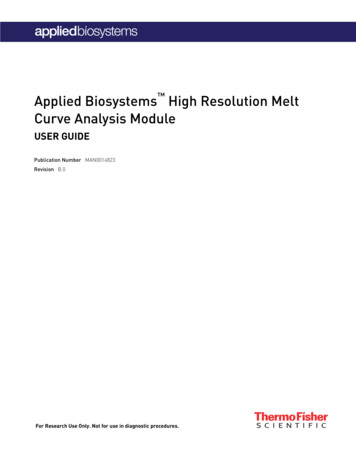
SeqScape Software v3 Quick Reference Card5. Adjust the clear range by the number of bases:7. Review the Mutations and AA Variants reports to verify oredit variants: Fewer than 50 bases: Select the clear range widget,then click and drag the widget between two bases thatrepresent the new location. The 5’ widget ‘[‘ and the 3’widget ‘]’ are shown below, circled in red.a. Select the project name in the navigation pane, thenselect a layer in the Active Layer drop-down list.b. Click(Report Manager), then select eitherMutations Report or AA Variant Report.c. Select Window Tile.d. Click a hyperlink (blue text) in the report, then view thedata in the project view.5′ (CR start) widgetHyperlinks to Project view3′ (CR end) widgetRight-click to show/hide columns More than 50 bases: Place the pointer between twobases that represent the new location, right-click, thenselect the item in the shortcut menu to set the start orend of the clear range.Original widget positionNew widget position6. Edit results by changing, deleting, and adding bases oradding and deleting spaces in a specimen consensus orsample sequence. The changes shown below were doneeither automatically by the consensus-calling algorithm, ormanually by the user.Consensus sequence8. Review other reports of interest.9. Use the Library Search report to view and edit constantposition errors, if applicable:User-edited base from A to W.Black dot indicates a varianta. Select the project name in the navigation pane, thenselect an active layer.b. Click(Report Manager), then select the LibrarySearch Report.c. Select Window Tile.d. In the Constant Position Errors table of the report,select a position (hyperlinked blue text), then view andedit the data in the Project view.10. Use the identification pane to view and edit crucialpositions, if applicable:a. Select the project name in the navigation pane, thenselect a layer in the Active Layer drop-down list.b. Select a base in the consensus sequence to populatethe identification pane.Sample sequenceRed dot indicates aconsensus caller editc. Use the split bar to adjust the height of theidentification pane.d. ClickPage 5(View Column Selector).
Step 6: Export/print the results and reportsThe # Diff column displays the number of bases thatdiffer between the consensus and the allele sequenceView column selectorAfter analysis, you can export reports automatically.1. Select Tools Options.Crucial position columne. Select a crucial position in the identification pane. Thecorresponding consensus base is selected in the viewcolumn selector in the Project view.f. View and edit the data in the Project view.Note: The crucial positions in the identification pane andthe Project view are hyperlinked to each other. Therefore,sequence edits are automatically updated in the librarysearch results in the identification pane.2. In the General tab:a. Select the Display Reports after Analysis check box,if desired.b. Select the Export Reports after Analysis check box,then select an export format in the drop-down list.c. Specify a default location to save files.d. Click OK.Note: To manually export and/or print files, refer to theinstructions in the SeqScape Software 3 User Guide.For Research Use Only. Not intended for any animal or human therapeutic or diagnostic use.Information in this document is subject to change without notice.NOTICE TO PURCHASER: PLEASE REFER TO THE SEQSCAPE PRODUCT INSERT AND PROTOCOL FOR LIMITED LABEL LICENSE OR DISCLAIMER INFORMATION.The trademarks mentioned herein are the property of Life Technologies Corporation or their respective owners. Copyright 2012, Life Technologies Corporation. All rights reserved.Headquarters5791 Van Allen Way Carlsbad, CA 92008 USAPhone 1 760 603 7200 Toll Free in USA 800 955 6288For support visit es.com
Applied Biosystems SeqScape Software uses the following file types: File extension and format Description Files that are used for Analysis.ab1 (ABI format) A file that is generated from any of the following Life Technologies instruments: † 3130/3130xl Genetic Analyzers † 3730/3730xl Genetic Analyzers † 310 Genetic Analyzer † 3100/3100 .