Transcription
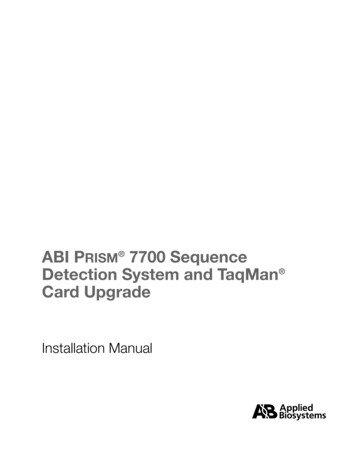
Quickstart GuideABI PRISMÒ 7700 Dissociation Curve SoftwareOverview·The ABI PRISMÒ Dissociation Curve Analysis Software is a MacintoshÒ applicationthat uses the multicomponent data exported from the SDS software v1.7 to displaythe dissociation curves for each sample.·The principle feature of the ABI PRISM Dissociation Curve Analysis Software is toprovide melting curve analysis on SYBRâ Green dye assays run on the ABI PRISM7700. However, any dye loaded on the system can be analyzed in the software.·The ABI PRISM Dissociation Curve Analysis Software is available free of charge fromthe Applied Biosystems /7700/updates.cfm·Pre-requisite: SDS software v1.7 or higher is required for proper data collection. Themost current SDS software is available free of charge from the Applied Biosystemswebsite: dates.cfm·Dissociation Curve Analysis can be conducted either at the end of a new real-timerun or it can be performed as a separate run of a previously run plate.Directions1.····Launching the SDS v 1.7:Double click the Sequence Detection v1.7 icon and launch the software.From the File menu select New Plate.Configure the New Plate as shown below.When finished with the plate configuration click OK.For Reference Only1
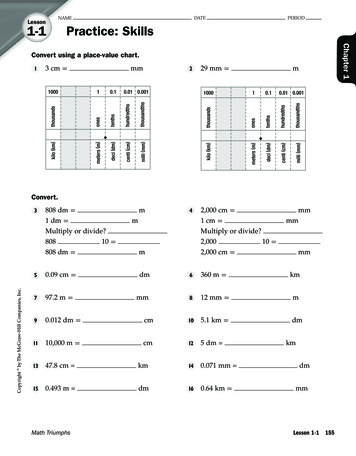
2. Disabling the Quencher: The quencher dye must be disabled when running SYBRGreen dye assays.· From the Plate Setup screen click on Sample Type Setup.· The Sample Type Setup dialog box will appear.··Click the Quencher box and change it to read “none” and unclick the box.Click OK.3. Configuring the Dissociation Curve Profile:NOTE: There are TWO methods- please choose either method 1 or method 2Method 1- Linking a dissociation curve profile to the end of a real time run.· From the Setup screen click on the Thermal Cycler Conditions.· The Thermal Cycler Conditions dialog box will appear.· Click the vertical bar after the annealing/extension step.· Click on Add Hold three times- adding three distinct stages after the real timeprofile. .· Change the temperatures and times as follows: 95 C/15 seconds, 60 C/20seconds and 95ºC/15 seconds.· Continue with Step 4.Click HereMethod 1: Linked to a real-time runFor Reference Only2
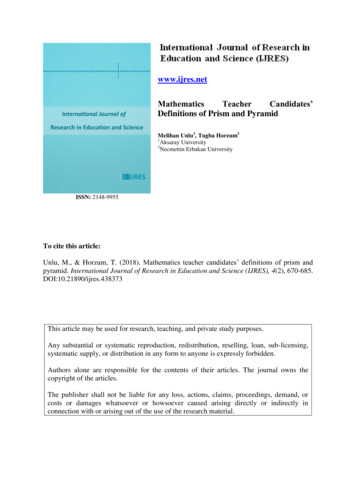
§Method 2- Creating a separate dissociation curve profile (after the PCR cyclingis completed).· From the Setup screen click on the Thermal Cycler Conditions.· The Thermal Cycler Conditions dialog box will appear.· Delete the default thermal cycling profile.· Click on Add Hold three times- adding three distinct stages.· Change the first stage to 95 C/ 15 seconds, the second stage to 60 C / 20seconds and the third stage to 95 C/ 15 seconds.· Continue with Step 4.Method 2: After the real time run is complete4. Setting the ramp time: The ramp should span the longest possible time (19:59).This provides the greatest separation of the derivative peaks during the dissociationcurve analysis and therefore maximum resolution for the run.· Click or select the ramp line connecting the annealing stage with the finaldenaturation stage. The software will highlight the selected stage in red.· Click on Set Ramp Time box.· The Ramp Time dialog box will appear.· Set the ramp time for 19:59.· Click OK.Click HereFor Reference Only3
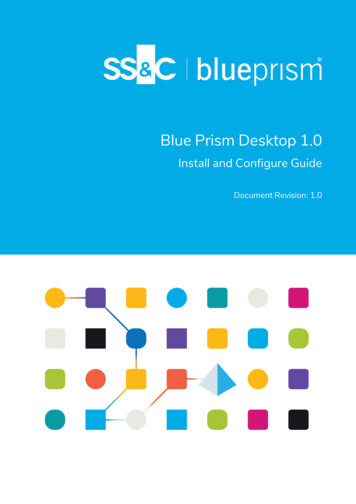
5. Setting the Data Collection Points· Click Show Data Collection.· The Data Point Collection icons will appear on the Thermal Cycler Conditions dialogbox.· Add a Data Collection icon to the ramp by clicking on the slope.· Click OK.Data CollectionIconNOTE: When linking a dissociation curve profile to the end of a real-time run make sure thereare data collection icons located on the annealing step during the cycling.6. Labeling plate:· Configure the plate document in the SYBR dye layer with the appropriate sampleinformation.7. Initiating the run:· Load the sample plate into the ABI PRISM 7700 Sequence Detection System.· Click on Show Analysis.· Click Run to start the run.For Reference Only4
8. Preparing the Data:· After the run is completed, go to the top tool bar and click on Analysis.· Scroll down to Analyze and analyze the data.· Click OK and close the Amplification Plot.NOTE: If the Amplification Plot is blank and does not close, change the Baseline Start, Stopand Threshold to 0 (zero). Click Update Calculations then click Okay and the AmplificationPlot will close.Alternatively, the Amplification Plot can be prevented from appearing by going toAnalysis and clicking Options and then Deselect Show Threshold Dialog AfterAnalysis.9. Exporting the Multicomponent Data· From the top tool bar go to File.· Scroll down to Export.· Scroll down to Multicomponent.· The Export Dialog box will appear.· Name and Export the Multicomponent Data- In this example the file was nameddata.multicomp and saved to the Desktop. The file MUST contain the suffix.multicomp.For Reference Only5
§After exporting the data, save the run and quit the SDS software.10. Dissociation Curve data analysis:· Launch the Dissociation Curve Software by double clicking on the icon.· From the top tool bar, go to File, scroll to Open.· Navigate to the saved Multicomponent data.· Open the saved Multicomponent data.·When the multicomponent data is opened, the software will automatically generate adissociation curve graph.The Red Bar can be moved horizontally and will display the temperature for the point indicated.The X-axis is temperature and the Y-axis is Derivative or Fluorescence.For Reference Only6
11. Saving the Dissociation Curve Data: The data can be exported and saved eitheras a graph image or as a report.· From the top tool bar scroll down to export Graph Image or Report.· Name and Export the data.··Graph Image exports a PICT file of the dissociation curves.Report exports a tab-delimited text file of the dissociation data.12. Additional features of the software can be found within the Help Folder containedwithin the Dissociation Curve Analysis 1.0 folder that was downloaded from the web.Double click on the start.html file to open the Help document.Copyright 2001, Applied Biosystems. All rights reserved.For Research Use Only. Not for use in diagnostic procedures.ABI PRISM and Applied Biosystems are registered trademarks of Applera Corporation or its subsidiaries in the UnitedStates and certain other countries.TaqMan is a registered trademark of Roche Molecular Systems, Inc.SYBR is a registered trademark of Molecular Probes, IncFor Reference Only7
The principle feature of the ABI PRISM Dissociation Curve Analysis Software is to provide melting curve analysis on SYBR Green dye assays run on the ABI PRISM 7700. However, any dye loaded on the system can be analyzed in the software. The ABI PRISM Dissociation Curve Analysis Software is available free of charge from the Applied Biosystems .