Transcription
Immunity, Volume 44Supplemental InformationEnteric Viruses Ameliorate Gut Inflammationvia Toll-like Receptor 3 and Toll-like Receptor 7Mediated Interferon-b ProductionJin-Young Yang, Min-Soo Kim, Eugene Kim, Jae Hee Cheon, Yong-Soo Lee, YejiKim, Su-Hyun Lee, Sang-Uk Seo, Seung-Ho Shin, Sun Shim Choi, BumseokKim, Sun-Young Chang, Hyun-Jeong Ko, Jin-Woo Bae, and Mi-Na Kweon
Supplemental Experimental ProcedureClinical ScoringThe clinical scoring of a disease activity index (DAI) that ranged from 0 to 4 was calculated based on thefollowing parameters: weight loss (0, none; 1, 1%-5%; 2, 5%-10%; 3, 10%-20%; 4, 20%), stool consistency (0,normal; 2, loose; 4, diarrhea), and gross bleeding (0, absence; 2, blood tinged; 4, presence) (Walmsley et al.,1998). DAI was calculated as follows: DAI (weight loss stool consistency gross bleeding) / 3. Colitisseverity was evaluated by an independent observer who was blinded to the treatment. Colon length as anindirect marker of inflammation was also measured.HistologyThe entire colon was removed from the cecum to the anus, opened longitudinally and rolled on a toothpick overthe full length to obtain a ‘Swiss roll’. Swiss rolls were fixed in 4% para-formaldehyde, embedded in paraffin,and stained with hematoxylin-eosin. All histological quantification was done in a blinded fashion using ascoring system described previously (Dieleman et al., 1998). In brief, three parameters were measured: severityof inflammation (0, none; 2, slight; 2, moderate; 3, severe), extent of injury (0, none; 1, mucosal; 2, mucosal andsubmucosal; 3, transmucosal), and crypt damage (0, none; 1, basal one-third damaged; 2, basal two-thirdsdamaged; 3, only surface epithelium intact; 4, entire crypt and epithelium lost). The score of each parameter wasmultiplied by a factor that reflected the percentage of tissue involvement (1, 0%-25%; 2, 26%-50%, 3, 51%75%; 4, 76%-100%), and all numbers were summed. Images were obtained using a microscope (BX51,Olympus Optical, Tokyo, Japan). To detect p50-NF- B protein in colon tissues, paraffin-embedded tissues wereimmunostained with p50-NF- B antibody and viewed under a confocal scanning laser microscope (Carl Zeiss,Göttingen, Germany). Quantification was calculated using ImageJ software (Schneider et al., 2012).Cytokine/chemokine detection assayColon tissues were weighed (200 mg/ml) and homogenized with Tris-EDTA buffer (10 mM Tris-HCl and 1 mMEDTA, pH 7.4, 0.05% sodium azide, 1% Tween-80, protease inhibitor cocktail), centrifuged at 11,000 x g for 10min at 4 C, and supernatant was collected. Cytokine from tissue homogenates was measured using theCytometric Bead Array-mouse inflammation kit (BD Pharmingen, San Diego, CA) or the MultiplexImmunoassays of ProcartaPlex Detection System (eBioscience, San Diego, CA) according to themanufacturers’ instructions and analyzed by CS1000 Autoplex Analyzer (PerkinElmer, Waltham, MA)combined with the Luminex xMAPTM analytical platform (Luminex, Austin, TX).Enumeration of fecal VLPsThe VLP samples were diluted 10-fold serially, and VLPs of AV-treated and -untreated samples were comparedat the same level of dilution. Filtrates were filtered onto a 0.02-μm Anodisc polycarbonate filter (Whatman,Maidstone, UK). Filters were stained with 10 SYBR Gold for DNA viruses and 10 SYBR Green II for RNAviruses for 15 min, washed once, and visualized using an Eclipse 50i microscope equipped with an IntensilightC-HGFI (both Nikon, Tokyo, Japan) for fluorescence. VLP images ( 1,000) were pictured from 20 to 30 copiesper sample, and VLPs were counted using an i-Solution image analyzer (InnerViewTM; Seoul, Korea). Stainedparticles 0.5 μm in diameter were regarded as VLPs; SM buffer was used as a negative control.16S rRNA gene-based bacterial community analysisThe hypervariable regions (V1–V2) of the 16S rRNA gene sequences were amplified by using PCR with Rocheadaptor primer set containing decamer multiplex identifier sequences. Each reaction contained template DNA,each primer (0.2 μM), and 2 Premix Taq (Ex Taq version 2.0; TaKaRa, Shiga, Japan). PCR conditions were asfollows: 94 C for 3 min, followed by 30 cycles at 94 C for 15 sec, 55 C for 45 sec, and 72 C for 1 min and afinal extension step at 72 C for 8 min. Five replicates were prepared, pooled, and purified using QIAquick PCRPurification kit (Qiagen, Valencia, CA). The amplicons were quantified using Picogreen (Invitrogen, Carlsbad,CA), and an equimolar amount of each sample was sequenced by use of a 454 pyrosequencing GS FLXTitanium kit (Roche Life Sciences, Branford, CT). Raw sequences containing more than one ambiguous basecall, those with errors in the barcode or primer regions, those with average quality scores 25, or those with 200 bp and 1,000 bp in length, were removed. Subsequently, the sequences were stripped of noise by using a
Denoiser program, and the reverse primer sequences were trimmed away. Chimeric sequences were excludedbased on the UCHIME algorithm using USEARCH (v7.0). The sequences were conducted to sub-sampled openreference clustering with 97% sequence identity using SortMeRNA SUMACLUST. A representative sequencefor each operational taxonomic unit (OTU) was selected and aligned with the Greengenes core set (2013-05)using PyNAST. A phylogenetic tree was constructed for the aligned sequences using FastTree. An even-depthrarefied OTU table (3,000 sequences/sample) was generated to control for sequencing effort. Taxonomicassignment was performed with UCLUST consensus taxonomy assigner. Beta-diversity was determined basedon UniFrac distances visualized with PCoA. The compositional differences by antiviral treatment weredetermined by a linear discriminant analysis using LEfSe (v1.0) (Segata et al., 2011) with a threshold of 2.0 onthe logarithmic score. Statistical significance of the community comparison between Before AV and After AVwas determined using PERMANOVA with 1,000 permutations.cDNA synthesis and real-time PCRTotal RNA was isolated from colon tissues using TRIzol, and cDNA was synthesized by Superscript II reversetranscriptase with oligo (dT) primers (all from Invitrogen). The products were used as a template for real-timePCR using Power SYBR Green PCR master mix (Applied Biosystems, Foster, CA) and primers with thefollowing sequences: S100a9, 5’-CATCATGGAGGACCTGGACA-3’ and 5’-GCTGTCACATGGCTGACCTC3’; S100a8, 5’-AAGGAAATCACCATGCCCTC-3’ and 5’-TGAGATGCCACACCCACTTT-3’; Il1b, GCTTGAAGACCCTTCC-3’ and 5’-GCAGACTGGTTTCAGGGGAT-3’. The real-time PCR wasperformed under the following conditions: 95 C (3 min), followed by 40 cycles at 95 C (15 sec), annealing (30sec), 72 C (40 sec). For detection of bacterial 16s rRNA, we isolated DNA from stool by DNA Stool Mini kit(Qiagen) and performed real-time PCR with 16s rRNA universal primers. The real-time PCR program startedwith an initial step at 95 C for 3 min, followed by 40 cycles at 95 C (10 sec) and 40 cycles at 63 C (45 sec).Gel shift assayColon tissues were weighed (200 mg/ml) and homogenized with hypotonic buffer (10 mM HEPES buffer, pH7.9, containing 0.5 mM KCl, 1.5 mM MgCl2, 0.5 mM DTT, and 0.2 mM PMSF). Cytosolic fraction wasreleased with a 10% solution of Nonidet P-40. The homogenate was centrifuged at 1,500 x g for 15 min, and theresulting nuclear pellet was resuspended in low salt buffer (20 mM HEPES buffer, pH 7.9, containing 25%glycerol, 1.5 mM MgCl2, 0.02 M KCl, 0.2 mM EDTA, 0.5 mM DTT, and 0.2 mM PMSF) and high salt buffer(20 mM HEPES buffer, pH 7.9, containing 25% glycerol, 1.5 mM MgCl 2, 0.8 M KCl, 0.2 mM EDTA, 0.5 mMDTT, and 0.2 mM PMSF) in a dropwise fashion. The nuclear extract was centrifuged for 30 min at 20,000 x g,and the supernatant was collected and used for electrophoresis. Labeled oligonucleotides (10,000 cpm) wereincubated for 30 min at room temperature, along with 10 μg of nuclear extracts, in 20 μl of binding buffer (10mM Tris-HCl, pH 7.6, 500 mM KCl, 10 mM EDTA, 50% glycerol, 100 ng of poly[dI-dC], and 1 mMdithiothreitol). The reaction mixture was analyzed by electrophoresis on a 4% polyacrylamide gel in 0.5 Trisborate buffer. An oligonucleotide containing an NF-κB-binding site within the immunoglobulin γ-chain (5'-CCGGTT AAC AGA GGG GGC TTT CCG AG-3') was used as a probe.Human TLR3/7 variants studyTo identify genetic variants of the TLR3/7 genes, all coding exons, exon-intron boundaries, the promoter region,and 5’ untranslated region the gene were sequenced in 24 randomly selected Korean IBD cases. After PCRamplification of the TLR3/7 gene fragments, products were purified using a MultiScreen384-PCR Filter Plate(Millipore and sequenced using a BigDye Terminator Cycle Sequencing Kit and an ABI 3730xl ington.edu/PolyPhred.html) was used to align the sequences and determinepolymorphisms. Finally, two selected SNPs (rs3775291 in TLR3 and rs3853839 in TLR7) based on the directsequencing were genotyped in 281 cases and 289 controls by TaqMan fluorogenic 5’ nuclease assay (AppliedBiosystems). All PCR reactions were performed in 384-well plates by a Dual 384-Well GeneAmp PCR System9700 and the endpoint fluorescence was analyzed by ABI PRISM 7900 HT Sequence Detection System (bothfrom Applied Biosystems).
Cell preparation from colon and in vitro cultureTo isolate mononuclear cells, large intestines were opened longitudinally. Contents were removed by shaking incold PBS and tissues were cut into pieces 1- to 2-cm long. Intestinal epithelial cells and mucus were removed byshaking tissues in EDTA buffer (10 mM EDTA in PBS) for 30 min at 37 . After a wash with pre-warmed PBS,tissues were dissociated by RPMI containing 10% FBS, 0.5 mg/ml collagenase D (Sigma-Aldrich, St. Louis,MO), and 100 μg/ml DNase I (Roche) twice for 30 min at 37 . The harvested cells were stained withantibodies to the following markers: MHC class II eFluor450 (clone M5/114.15.2; eBioscience, San Diego, CA),CD11c FITC (clone HL3; BD Biosciences), Ly6G PE (clone 1A8; BD Biosciences), CD11b PE-Cy7 (cloneM1/70; BD Biosciences), PDCA-1 APC (clone eBio129c; eBioscience), and Ly6C APC-Cy7 (clone HK1.4;BioLegend, San Diego, CA). The monocytes, cDCs, and pDCs sorted by FACSAria cell sorter (BDBiosciences) were counted and cultured in 384-well plates (5 104 cells/well) with LPS (1 μg/ml) or Poly [I:C](5 μg/ml) and Imiquimod (5 μg/ml), respectively.IFN- detectionIFN- from supernatants cultured for 24 hr was measured using ProcartaPlex Multiplex Immunoassays(eBioscience) according to the manufacturers’ instructions and analyzed by CS1000 Autoplex Analyzer(PerkinElmer, Waltham, MA) combined with the Luminex xMAPTM analytical platform (Luminex, Austin, TX).Murine norovirus (MNV) detectionWe performed a nested reverse transcription-PCR assay for MNV detection in the fecal samples of the micebefore and after AV cocktail treatment as described (Kitajima et al., 2009). The cDNAs synthesized from fecalVLP-derived RNA metagenomes were used as templates. The primer sets used in this study were as AAG-3’andMNV-R1:5’CATGCARACCAGGCGCATAG-3’; and inner primer set, MNV-F2: 5’-ACARTGGATGCTGAGACC-3’ andMNV-R2: 5’-CAACCACCTTGCCAGCAG-3’.Supplemental ReferencesDieleman, L.A., Palmen, M.J., Akol, H., Bloemena, E., Pena, A.S., Meuwissen, S.G., and Van Rees, E.P. (1998).Chronic experimental colitis induced by dextran sulphate sodium (DSS) is characterized by Th1 and Th2cytokines. Clin Exp Immunol 114, 385-391.Kitajima, M., Oka, T., Tohya, Y., Katayama, H., Takeda, N., and Katayama, K. (2009) Development of a broadlyreactive nested reverse transcription-PCR assay to detect murine noroviruses, and investigation of theprevalence of murine noroviruses in laboratory mice in Japan. Microbiol Immunol, 53, 531-534.Schneider, C.A., Rasband, W.S., and Eliceiri, K.W. (2012). NIH Image to ImageJ: 25 years of image analysis.Nat Methods 9, 671-675.Segata, N., Izard, J., Waldron, L., Gevers, D., Miropolsky, L., Garrett, W.S., and Huttenhower, C. (2011).Metagenomic biomarker discovery and explanation. Genome Biol 12, R60.Walmsley, R.S., Ayres, R.C., Pounder, R.E., and Allan, R.N. (1998). A simple clinical colitis activity index. Gut43, 29-32.
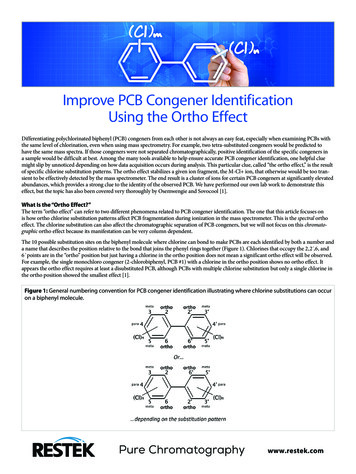
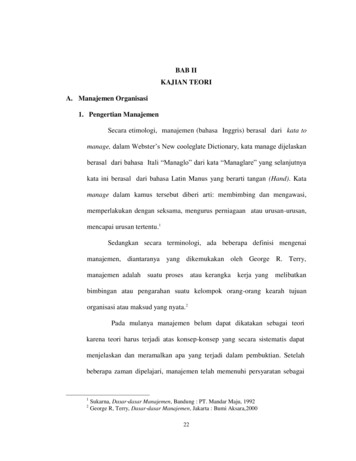
A3.0WT-DSSWT-DSS-AVWT-DSS RibavirinWT-DSS LamivudineWT-DSS WT-DSS*WT-DSS AVWT-DSS RibavirinnsWT-DSS Lamivudine*nsWT-DSS Acyclovir60708090100 110Colon Length (mm)Figure S1, related to Figure 1. Effectiveness of single anti-viral (AV) agents inmaintaining gut homeostasis.Disease activity index (DAI; A) was scored and colon length (B) measured after dextransodium sulfate (DSS) treatment following pre-treatment with three mixtures (ribavirin,lamivudine, and acyclovir) or each of them, respectively. All data are mean s.e.m. of 2independent experiments. Statistical analyses were done with two-tailed paired t-test.*P 0.05, ***P 0.001.
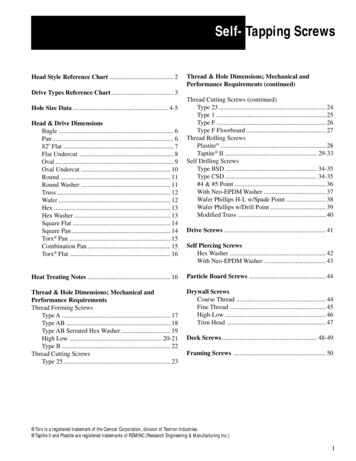
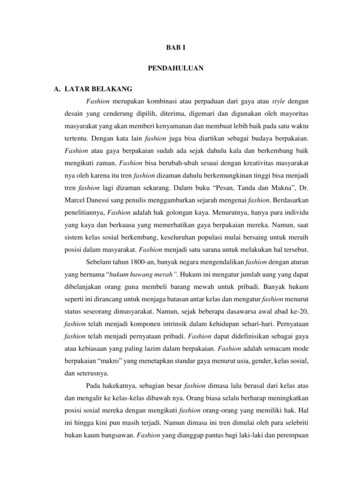
ASYBR GoldSYBR Green IIVirus-like particlesBefore AV(1/100 dilution)BAfter AV(1/5 dilution)Before AVBefore AV(1/10 dilution)After After AV(1/2 dilution)BacteriaBacteriophageMobile genetic elementVirus69.3%Before AVAfter AV11.7%14.2%3.5%5.8%9.8%5.1%75.1%74.9%Figure S2, related Figure 2. VLPs from fecal samples and biological assignment of viralcontigs in DNA and RNA metagenomes.Filtrates of fecal samples from mouse groups before and after AV were stained with SYBR Goldand Green II, and VLPs were visualized by fluorescence microscopy (A). Filtrates were dilutedserially until 100 to 300 VLPs were counted in a view. Assembled contigs from viral DNA (B)and RNA (C) metagenomes were assigned into biological entities using BLASTx searchesagainst NCBI non-redundant protein database (E-value 10-5).
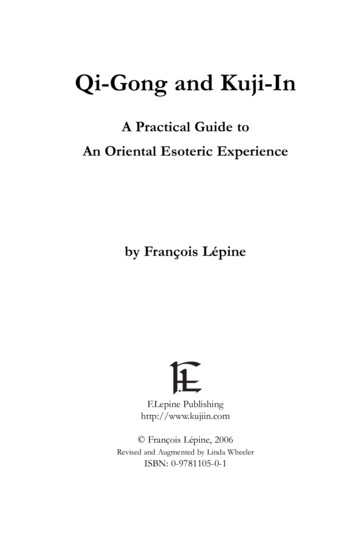
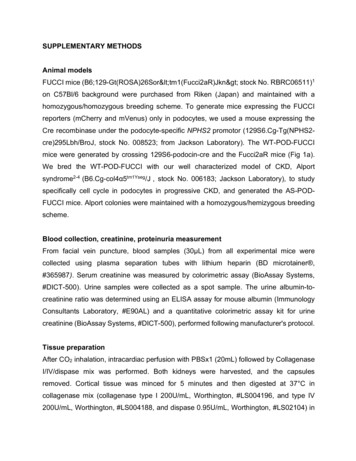
B1500C100100P 0.04310007505002508080Microviridae (%)1250Caudovirales (%)Caudovirales richnessA60406040202000Before AVAfter AVP 0.044004000080000120000160000200000Before AV After AVBefore AV After AVNumber of readsE10Shannon index8Observed speciesDn.s.642400n.s.30020010000Before AVAfter AVBefore AVAfter AVFigure S3, related Figure 2. Inflammatory bowel disease-like alterations in enteric DNAvirome of AV cocktail-treated mice.Based on the number and abundance of total contigs ( 300 bp, non-normalized), (A)Caudovirales richness, the relative abundance of (B) Caudovirales and (C) Microviridae werecompared between enteric DNA virome of the mice before and after AV cocktail treatment. (D)Biodiversity and (E) species richness of the bacterial communities in the mice before and afterAV cocktail treatment were compared. All data are mean s.d. Statistical analyses were done withone-tailed paired t-test.
AInactivated Rotavirus (RV)-D6D0D7water2.5 % DSSB2.52.0DAICWT-controlWT-RVWT-DSSWT-DSS RV1.5***WT-DSS RV0.50WTPBSWT-RVWT-DSS*1.0D80D12345660 70 80 90 100 110Colon Length (mm)8 (Days)EWT-DSS RVWT-DSSWT-DSS 9F4/8015.211.423.6WT-DSSWT-DSS RV*20100Fng /g P-11.5MIP-1a158420*0015650WT-PBSWT-RVWT-DSSWT-DSS RV1.51.00ng /g tissue2200#CD11b F4/80 cells (x104)30#CD11b Gr-1 cells (x104)Pathologic scoreCD11b101.01050.55000RANTES*WT-DSSWT-DSS RV
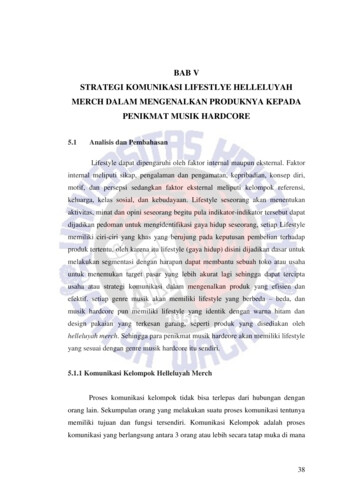
Figure S4, related Figure 3. Oral feeding of inactivated rotavirus (RV) attenuates DSSinduced colitis.BALB/c wild-type (WT) mice were treated with PBS (WT-PBS), 2.5% DSS (WT-DSS),inactivated rotavirus (WT-RV), or 2.5% DSS rotavirus (WT-DSS RV). (A) Treatmenttimelines for RV with or without 2.5% DSS. Mice were perorally administered RV for 6 daysbefore and during DSS treatment. Pathologic changes were monitored daily for 8 days. (B) DAIwas scored as described in Materials and Methods. (C) Colon length was measured 8 days afterDSS treatment. (D) Histologic changes were detected and scored in a blinded manner. Resultsshown are representative of three independent experiments, each with 6 mice per group. (E)Infiltrated leukocytes were determined by flow cytometry analysis. Absolute cell number wascalculated from percentage of cell population. (F) Amounts of cytokines and chemokines incolon homogenates of WT mice with/without DSS treatment were determined by theCytometric Bead Array assay *P 0.05, **P 0.001.
AV/DSSvs DSSTa/DSSvs DSS55180127Fold change-81:18Figure S5, related Figure 4. Comparison of gene expression levels in DSS-induced gutinflammation.Over 300 of differentially expressed genes (DEGs) (fold change 2.0) were shown on heatmap. Of that, 55 DEGs were significantly changed in a TLR3/7 signaling-dependent manner.Specifically, 27 DEGs were up-regulated in DSS-AV mice but 28 DEGs were downregulated when compared to those in DSS-Ta group (shown as log2-transformed foldchanges).
-DSSnsTlr7-/--DSSTlr3-/-Tlr7-/--DSS*60708090 100 110Colon Length (mm)Figure S6, related Figure 5. Investigation of redundancy of TLR3 and TLR7 signals inmaintaining gut homeostasis.Disease activity index (DAI: A) and colon length (B) of WT, single deficient (Tlr3 or Tlr7)and Tlr3-/-Tlr7-/- mice. All data are mean s.e.m. of 2 independent experiments. Statisticalanalyses were done with two-tailed paired t-test. *P 0.05; ns, not significant.
TLR 3 (CC, CT)TLR 3 (TT)p 0.090BCumulative probability ofavoiding use of steroidCumulative probability ofavoiding use of steroidACumulative probability ofavoiding admissionCumulative probability ofavoiding admissionCumulative probability ofavoiding surgeryCumulative probability ofavoiding surgeryTime to Surgery (month)p 0.543Time to Admission (month)Time to Admission (month)p 0.199p 0.285Time to use of corticosteroids (month)Time to use of Steroid (month)p 0.002TLR 7 (CC, GC)TLR 7 (GG)p 0.555Time to Surgery (month)Figure S7, related Figure 6. The clinical outcomes of individual effects of TLR3 (A) andTLR7 (B) genetic variations on severity of IBD in humans.Each single gene variant did not affect the cumulative corticosteroids and surgery rates, butthe cumulative admission rate differed according to TLR3 variants.
Table S1, related Figure 2. Metagenomic analysis of the fecal VLPs-derived sequence readsReadsSample IDRawread#ContigsAverageQuality-filtered Mouse High-quality16S rRNAread lengthread#read#read#gene#(bp)Total contig#Contig#Read#Coverage Normalized 2a. Contig 661,418,06081,418,052297.320: 5,345 contigsDNAb. 1,43295.0411932,613375208: 5,039 re31,481,606a. Contig assembly: 962 296.5423281,311,26298.92921,297,764251RNAb. Clustering690,000reads300250: 864 10681,005,098298.6323801,004,05699.9344990,285295
Table S2, related Figure 4A. Gene expression levels in the colonFold changeTarget IDSymbolNaïveDSSDSS -AVDSS -TaDSS/naïveDSS-AV/naïveDSS-Ta/naiveILMN 1.35ILMN 1.40ILMN 3ILMN 16ILMN 14ILMN 40ILMN 1251333Gabarap8789.092979.501111.538135.17- 3.03- 8.33-1.08ILMN 2790097Rhoc3959.31540.53217.602400.30- 3.33- 20.00-1.66ILMN 2647282Ptp4a23423.29592.17229.302234.43- 5.88- 16.66-1.53ILMN 2606746Car211827.322249.64780.557050.19- 5.26- 16.66-1.69ILMN 1246058Ppp1ca3725.15665.10183.912606.70- 5.88- 25.00-1.42ILMN 1258501Adh122003.984018.411000.8219455.07- 5.55- 22.22-1.13
Table S3, related Figure 4B. Gene expression levels in the colonFold changeTarget IDSymbolNaïveDSSDSS -AVDSS -TaDSS/naïveDSS-AV/naïveDSS-Ta/naiveGenes regulated by TLR3/7 ligationILMN 7ILMN LMN 023.31ILMN 2ILMN 75ILMN 62ILMN - 4.76ILMN 43- 4.76Genes regulated by decreased viral loadILMN N 2946520Npy167.53220.77459.96210.361.312.741.25ILMN 2725286Atp6ap21169.12988.39399.68919.85-1.19- 2.94-1.28ILMN 3060635Trpm61125.99797.28330.791156.30-1.10- 3.441.02ILMN 2725781Abcg51776.171614.85498.571302.62-1.11- 3.57-1.36ILMN 2643832Ppm1g905.19849.85230.12835.71-1.07- 4.00-1.08ILMN 2639036Hspd1803.04621.36160.36734.78-1.29- 5.26-1.09ILMN 2670751Fxyd41130.491469.72142.77867.021.30- 8.33-1.31
PCR using Power SYBR Green PCR master mix (Applied Biosystems, Foster, CA) and primers with the . (Applied Biosystems). All PCR reactions were performed in 384-well plates by a Dual 384-Well GeneAmp PCR System 9700 and the endpoint fluorescence was analyzed by ABI PRISM 7900 HT Sequence Detection System (both