Transcription
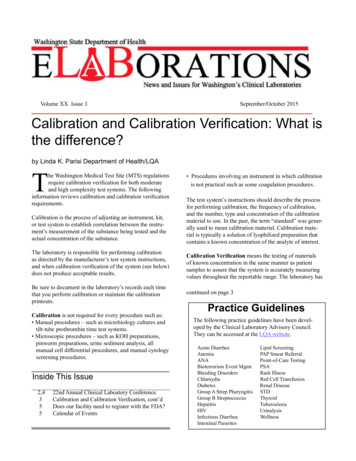
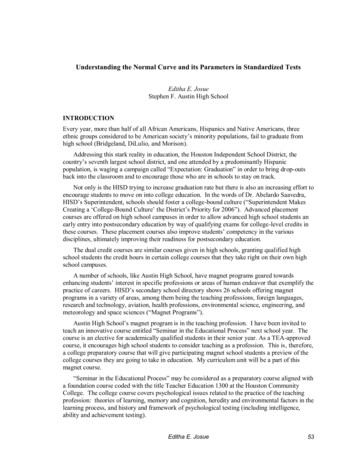
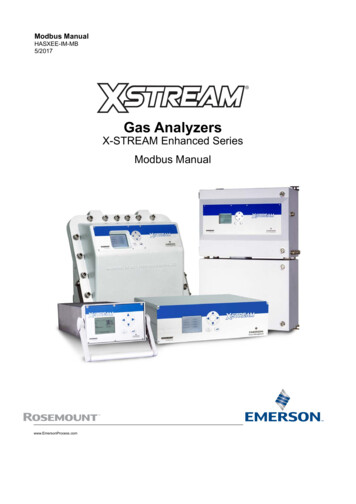
Generating calibration curve in MS Excel 20071) Graphical display (calibration curve) will allow to check visually that all your data points are on thecurve2) Simple calculation of slope and intercept3) Using function LINEST allows us to get also standard deviations and R24) Calculate unknownInitial data consist of response (signal) of different concentrations of standard and response of unknown sample1) Calibration curveTo create calibration curve go to INSERT menu and select SCATTER only with markers.You will obtain empty chart screen.
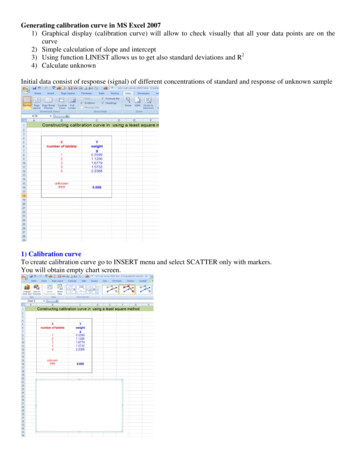
Highlight the empty chart box and click on SELECT DATA and ADDAdd appropriate data ranges for X and Y axis and click OK (twice)
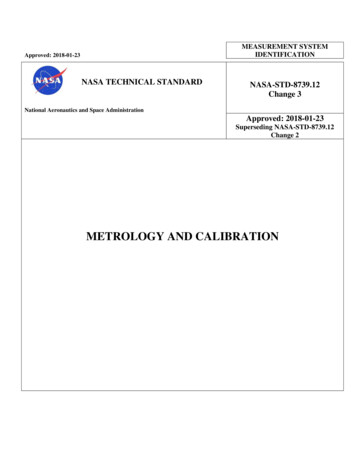
You should see chart with points to add calibration curve select the points in chart and click right see the optionADD TRENDLINE and left click on itSelect linear (trendline) and in options (top menu) select “Display equation and R2”
The result is the calibration curve, and equation.To add axis labels select chart, go to layout, click Axis titles and modify.Note a variety modification of charts can be done through menu obtained by right click
2) Simple calculation of slope and interceptTo get slope, type “ slope” and in parenthesis select range for ys and xs rangesFor the Equation Y m*X b m is slope, b is intercept, X is number of tablets, Y is weightTo get intercept type the same formula as for slope, but replace slope by intercept.Note, the slope and intercept calculated are and should be the SAME as on the chart.
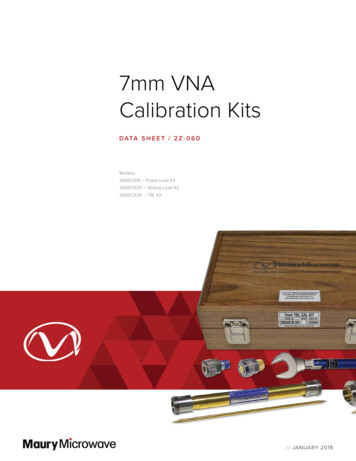
3) Using function LINEST allows us to get also standard deviations and R2Select the area 2 x 4 cells and point at menu at insert function (above B column), click on fxselect category STATISTICAL and function LINEST (you can also search for linest)Select data X and Y ranges, and type in “true” for const and stats
HIT keys CTRL SHIFT ENTER (all at the same time) and you will obtain the following dataInterceptSlopeStandard Deviation of Sloper2Standard Deviation of InterceptStandard Deviation of YFDegrees of Freedom
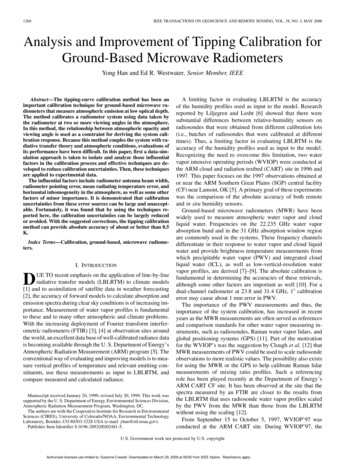
4) Calculate concentration of unknownRearrange equation for calibration curve to express X (concentration)Based on the calibration we know slope (m) and intercept (b) and we measured response y.Thus we can insert the calculated cells into the formula.
In this case, the results unknown amount of sample correspond to 2.36 tablets. You should be able to get thesame estimate from graphical display of calibration curve.
Generating calibration curve in MS Excel 2007 1) Graphical display (calibration curve) will allow to check visually that all your data points are on the curve 2) Simple calculation of slope and intercept 3) Using function LINEST allows us to get also standard deviations and R2 4) Calculate unknown