Transcription
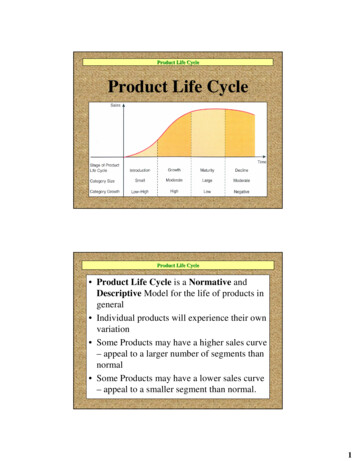
Understanding the Normal Curve and its Parameters in Standardized TestsEditha E. JosueStephen F. Austin High SchoolINTRODUCTIONEvery year, more than half of all African Americans, Hispanics and Native Americans, threeethnic groups considered to be American society‟s minority populations, fail to graduate fromhigh school (Bridgeland, DiLulio, and Morison).Addressing this stark reality in education, the Houston Independent School District, thecountry‟s seventh largest school district, and one attended by a predominantly Hispanicpopulation, is waging a campaign called “Expectation: Graduation” in order to bring drop-outsback into the classroom and to encourage those who are in schools to stay on track.Not only is the HISD trying to increase graduation rate but there is also an increasing effort toencourage students to move on into college education. In the words of Dr. Abelardo Saavedra,HISD‟s Superintendent, schools should foster a college-bound culture (“Superintendent MakesCreating a „College-Bound Culture‟ the District‟s Priority for 2006”). Advanced placementcourses are offered on high school campuses in order to allow advanced high school students anearly entry into postsecondary education by way of qualifying exams for college-level credits inthese courses. These placement courses also improve students‟ competency in the variousdisciplines, ultimately improving their readiness for postsecondary education.The dual credit courses are similar courses given in high schools, granting qualified highschool students the credit hours in certain college courses that they take right on their own highschool campuses.A number of schools, like Austin High School, have magnet programs geared towardsenhancing students‟ interest in specific professions or areas of human endeavor that exemplify thepractice of careers. HISD‟s secondary school directory shows 26 schools offering magnetprograms in a variety of areas, among them being the teaching professions, foreign languages,research and technology, aviation, health professions, environmental science, engineering, andmeteorology and space sciences (“Magnet Programs”).Austin High School‟s magnet program is in the teaching profession. I have been invited toteach an innovative course entitled “Seminar in the Educational Process” next school year. Thecourse is an elective for academically qualified students in their senior year. As a TEA-approvedcourse, it encourages high school students to consider teaching as a profession. This is, therefore,a college preparatory course that will give participating magnet school students a preview of thecollege courses they are going to take in education. My curriculum unit will be a part of thismagnet course.“Seminar in the Educational Process” may be considered as a preparatory course aligned witha foundation course coded with the title Teacher Education 1300 at the Houston CommunityCollege. The college course covers psychological issues related to the practice of the teachingprofession: theories of learning, memory and cognition, heredity and environmental factors in thelearning process, and history and framework of psychological testing (including intelligence,ability and achievement testing).Editha E. Josue53
This curriculum unit attempts to integrate some introductory statistical tools and parametersaround the concept of the normal curve as it applies to standardized tests. Standardized tests are abig part of students‟ school experience, and it would always be timely and relevant if they get tounderstand how their knowledge and skills in specific academic areas are evaluated. Discussionand readings will bring awareness on the construct and breakdown of tests into items that seek tomeasure the attainment of specific learning objectives and student expectations. A clearunderstanding of standards will improve success in tests used as evaluation tool for theirachievement of competency, which is a requirement for graduation from high school, or asassessment tool for their scholastic aptitude, which is a significant basis for admission into acollege of their choice.A simpler version of this unit will mesh well, too, in advanced classes in Algebra II or inmath skill enhancement classes that are offered in addition to the high school math core courses.At this level, the topic of statistics in standardized tests to evaluate competency and appraise thelevel of achievement in reference to a norm would be as equally eye-opening. The inclusion ofthe unit in these classes would make students aware of academic standards assessed statistically.According to brain development research, teenagers are entirely capable of abstract and morecomplex higher-order thinking tasks, but their brain is undergoing massive pruning in that partthat is responsible for goal and priority setting, planning and organization, executive decision andjudgment (Wolfe). Teenagers have the tendency to be shortsighted in terms of situating theirlives and the consequences of their actions. At this developmental stage, it is education‟s role toenable them to blossom gracefully into adulthood. The unit will provide the opportunity forpruning.The topic of normal curve will potentially bring discussions to the higher-order reflectiveexercise of looking at achievement and competency scores‟ implication in the status of ethnicpopulations in education and American society in general. Given that educational attainment is apath to greater socio-economic integration, this broader framework will hopefully strengthen theirmotivation to strive to perform well on these tests. No longer will their scores be isolatedpersonal measures of their competencies, for which it is their individual freedoms to strive orforego achieving.THE BELL CURVE: A MATHEMATICAL MODEL FOR A VARIETY OF REALWORLD PROCESSESThe Nature of the Normal Curve and the Normal Curve of NatureThe normal curve is a ubiquitous model in the subject of intelligence and achievementmeasurement, and is, therefore, a fixture, too, in an introductory course in educational psychologyor teacher education. This curriculum unit will revolve around the Bell Curve as a springboardfor the discussion of standardized tests, a topic in Austin High School‟s Magnet Program Courseentitled “Seminar in the Educational Process.” The course gives the assigned instructor a gooddegree of freedom to design the course as a parallel to a foundational course in Teacher Educationin college.The normal curve, or the Bell Curve, or Gaussian curve, is rather the graphical andmathematical representation of a discovery about the observed behavior and manifested attributeof people and things in a variety of real-world processes and phenomena. It is the graph of anormal distribution of observed scores in these situations. Because it is a graph that amazingly fitdata from observed phenomena, psychological and biological processes, and a variety of physicalattributes in things and people in the real world, the normal curve models the so-called empiricalrule on distribution (Brase 291).54Houston Teachers Institute
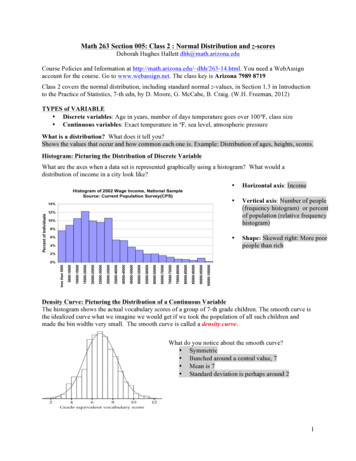
The normal curve is also called the normal density curve. The x-axis scales the scores for theobserved attribute or behavior, and the y-axis scales values obtained from the normal densityfunction formula defining normal density as a function of observed data or scores. Normaldensity function values, the y-values of the graph, correspond to the frequencies of differentscores from an observed population or sample. Frequency is the number of times a score appearsin a set of scores or observed data. When a histogram of scores versus frequency is constructed,the peak points of the bars outline a bell-shaped curve; hence, the term bell curve for the normaldistribution of scores into which this frequency histogram is converted. Figure 1 below illustratesthis relationship between a frequency histogram and the normal curve.Scores for the xvariable representingthis attribute areobtained by usingsimple measuring tools,or in the case ofpsychological attributes,for instance, from aninstrument that has beenvalidated to measure theconstruct of saidattribute. Measuringtools may includemeter-sticks for height,weighing scales forweight, a graduatedflask or cylinder forvolume, etc.Constructed instrumentsto measurepsychological attributesmay be an intelligenceScorestest, a state assessmentFigure 1test like the TAKS, or acollege admission test like the Scholastic Achievement Test. Scores may mean measurements insome industrial or sales concern such as the sizes of women‟s shoes for production and sale, orthe amount of milk production in a cattle ranch. Scores may mean tallies or counts ofoccurrences, people or things, such as the variable longevity of an industrial product, classroomsizes, number of siblings in families, etc., so that the frequency and the related normal densitywould represent the distribution of the different scores obtained through these tallies or counts.In statistics, a minimum sample size of 30 from a population that is believed to exhibit anormal distribution of the attribute or process being observed is considered to be sufficientlyrepresentative of the population itself, and can, therefore, generate the parameter values neededfor the construction of the normal curve. First, the data or scores are arranged in ascending order,averaged and scaled using a statistical formula that gives a value called the standard deviation.The standard deviation provides the scale unit for calibrating the observed scores along the xaxis. The resulting graph will plot scores against the density, corresponding to the frequencies ofthese scores.It is not the scope of this curriculum unit to discuss the mathematical intricacy and theabstract concept of the normal density function, but students who will be in this course and areEditha E. Josue55
coming from a background understanding of the concept of function, shall be made aware that aformula exists for a function whose graph is the normal curve.f ( x) 12 2e( x )2 2 2In this formula, e is a mathematical constant whose approximate value is 2.1783, and π is aconstant whose approximate value is 3.1416. The variable x represents a score, μ stands for themean of the set of data, σ for standard deviation, and σ2 for the variance of the distribution. Themean μ and standard deviation σ are constant values obtained using the whole set of populationscores on their respective formulas; they are called parameters of the population.The function formula shown above is not commonly used to evaluate the normal densityfunction; the process involves laborious work even for students in postsecondary study. Instead,statistical tables giving the areas under the standard normal curve for standard scores that can beconverted into or from any observed scores from a set whose mean and standard deviation can beeasily determined by formula. These tables are regular appendices in statistics handbooks.Calculators are also programmed to give values for mean, standard deviation, or area.To underscore an earlier description, a normal distribution of scores assumes the shape of abell. A bell is symmetric, peaks in the middle, and trails down towards the tail-ends on both sidesof the middle. A short trail down from the middle peak on either side, the bell changes the slopeof its curve. These points in opposite sides of the peak are called the inflection points. Brasedescribes the inflection points as the transition points at which the bell curve changes betweendownward and upward cupping (293). The tail-ends trail infinitely away from the middle, nevertouching the x-axis. Mathematically, the behavior of such a graph is called asymptotic and itindicates, at least conceptually, that there will endlessly be extremely lower and lower, andextremely higher and higher scores with negligible but nonzero frequency.In a normal distribution, a big proportion of the scores cluster around the middle value, calledthe median in the ascending order of scores. The middle value in the array of horizontal scores isalso called the mode of the distribution, because it is the x-coordinate of the highest point in thegraph. Using the normal density formula, the mode is that value of x or that score that will givethe maximum normal density function value, which in turn corresponds to the highest frequencyin the distribution. In everyday intuitive language, when people talk of the average as somethingthat is commonly existing, they are most probably referring to the mode. The middle value isalso called the mean, which is the mathematical average of the scores obtained by dividing thesum of the scores observed by the total number of score data. This arithmetic mean is easy toinfer from the symmetry of the curve, which has identical densities on both sides of the verticalline passing through the peak and middle point. Again, if the distribution is normal, then mostscores are proximate to the average on both sides and then would symmetrically show descendingfrequencies as they assume values farther from the average. Figure 2 below summarizes theattributes and parameters of the normal curve.56Houston Teachers Institute
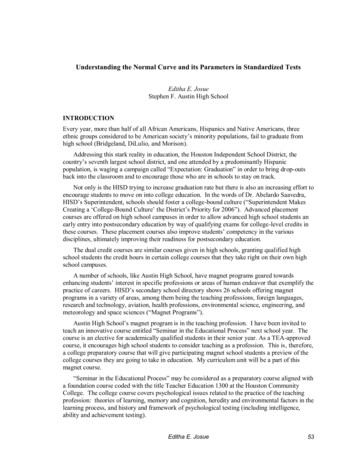
Bell or normal curves maydiffer from each other by their“peakedness” or flatness, that is,some normal curves may haveflatter peaks than others. Themathematical term for such acharacteristic of the normal curveis kurtosis, and a formuladetermines its value. The kurtosisof a normal curve is related to thespread of scores, or the deviationsof scores from the mean. Two setsFigure 2of scores on the same attributemay have the same middle value or mean, but given different standard deviations, the one withthe bigger standard deviation may show a greater spread of scores with a consequent flatter curvearound the mean, while the other will indicate a more peaked curve implying a higher frequencyof scores near the mean but a narrower spread of scores.In Figure 3, two hypothetical setsof raw scores in a test taken by twoclasses is represented by overlappingnormal curves showing the same meanof 80, but different spreads of scores,5 and 10, for the two classes.Regardless of peakedness andflatness, or with any kurtosis, the totalarea under any normal curve is alwaysequal to one. This is because the totalarea under it represents theproportions of scores added togetherfor an observed entire population, orFigure 3for a reasonably large sample that canbe accepted to represent and assumethe normal distribution character of the population from which it is taken. A shaded segment ofarea under the curve represents the proportion of scores falling within the specified range of scorevalues. Another interpretation is that the shaded area represents the proportion of the populationor sample possessing the includedrange of scores in this shaded area.Alternatively, the total area underthe curve represents the total ofprobabilities for the scores and isalways equal to one. Hence, an areasegment under the normal curve isthe probability that a specific rangeof scores will be manifested by anymember of the observed populationpicked at random. Figure 4 relatesarea to the density of scores or toFigure 4the probability of a specificobservation (score).Editha E. Josue57
As a model for the distribution of observed data, the normal curve depicts the empirical ruleof distribution. It is an empirical rule because it reflects the distribution from observed practice.This empirical rule has the following distribution of scores:1. Sixty-eight per cent, 68 %, of the scores are one standard deviation, or one scale unit,above or below the middle value or the mean.2. 95.44% of the scores are within two scale units on both sides of the middle value.3. 99.7% of the score data, practically including the whole population measured, fall withinthree standard deviations from the mean.Figure 5The scale along the horizontal axis in the normal distribution figure in Figure 5 clearly showsthe relationship between the mean μ and the standard deviation σ. Students in the course shallhave earlier gotten acquainted with the concept and computation of the mean of a data set.Knowing the mean, students get to understand the concept of variance. Computationally, thevariance is the average of the squared deviations of the scores from the mean of scores. Thesquare root of the variance will give the standard deviation of the distribution, the length of eachof the equal intervals dividing the scores. As a statistic, the standard deviation gives informationon the spread of scores of examinees. It will show how disparate or proximate these scores are.As mentioned earlier, a highly disparate set of scores would give a bell curve that has a wider butlower peak in the middle, and stretches out more widely to both tail-ends. On the other hand,using the same coordinate plane, the bell curve of a more proximate set of scores having the samemean, would have a steep peak in the middle and scale down more abruptly toward the tail-ends.Below is a summary of the formulas used in the process of constructing the bell curve for apopulation or sample of test-takers.For a set of n individual scores or observations where x 1, x2, x3 .xn, are the respectiveindividual scores or observations, the arithmetic mean or average is obtained using the formula:Mean:58μ or x ΣxnHouston Teachers Institute
If some or all of the individual observation measurements or counts exist more thanonce, then respective frequencies are taken into account in the formula for the mean:kμ or x kΣ 1 fi x i Σ 1 fi x inΣfIn this formula, n represents the total number of scores or observations, i refers to a specificscore with a specific frequency f, and k represents the number of different values of x in the set ofdata; k also refers to the number of products fixi.The notation Σ means sum and in the above formula, it denotes the sum of the products ofscores and their frequencies for the numerator part of the right side expression as well as the sumof the frequencies of the different scores.While the mean is the arithmetic average that measures the central tendency of a normallydistributed set of scores, the variance is the arithmetic average of the squared deviations of theindividual scores from the mean.Varianceσ2 Σ (x - x)2nAgain, the standard deviation determines the scale parameter for the normal curvedistribution of the set of scores or observations. Standard deviation, denoted by σ, is obtained bycomputing for the square root of the variance.σ Σ (x - x)2nThe above formula gives the population standard deviation. This is used when computingfor the standard deviation of the scores of all test-takers in a specific subject and level of theTAKS. The formula may also be used for a sample of 30 or greater number of observations fromthe population. For a sample size less than 30 (that is, if number of observations is less than 30),the formula above tends to underestimate the actual standard deviation of the population. Tocorrect for this negative bias, the sample standard deviation instead uses the more approximatevalue from the formula:σ Σ (x - x)2n-1Any normal curve may be converted into a standardized scale so that scores on two differenttests with differing scoring systems but relating to the same attribute may be compared. We mayconvert the differently scaled scores measuring the same attribute of the same population or groupinto the standard z-score using the formula below:Standard scorez x-μσwhere X is the scaled score based on a test‟s scoring system, μ is the arithmetic mean of scoresbased on that scoring system, and σ is the standard deviation of scores in that scoring system.Editha E. Josue59
In a standard normal curve, the mean is assigned the conversion value of 0, and the standarddeviation or scale interval is 1. Scores to the left of the zero mean will have negative values andscores to the right will have positive values.The Normal Curve of Standardized TestsThe Texas Assessment of Knowledge and Skills (TAKS) is a criterion-referenced test thatseeks to measure proficiencies in the areas of reading/language arts, mathematics, science, andsocial studies at Grades 3-11. Eleventh graders take the exit level TAKS the passing of which ispart of the requirement for graduation from high school. The percentage of students reaching orsurpassing the proficiency scale mark in these tests across academic areas and across grade levelsprovides the basis for a school‟s meeting or failing to meet the adequate yearly progress (AYP) asdefined in the NCLB accountability. Starting from a statistically determined baseline, thesepercentages of passing scores are evaluated against recommended yearly incremental increases(“Texas Consolidated State Application Accountability Workbook” 10-11).TAKS scores fall under three categories or levels: Did not Meet Standards, Met Standards,and Commended Performance. These categories correspond to the following levels ofproficiency: basic, proficient, advanced. Just to give an idea about the TAKS score scale, resultsin the TAKS 11th grade mathematics taken by students in 2006 indicate the proficiency level at2211 score mark, equivalent to a maximum of 27 wrong answers, and commended performancelevel starts at the 2400 mark, equivalent to at most seven wrong answers out of the total of 60 testitems. While scores signify the failure on, achievement, or surpassing of the proficiency mark,the normal curve also becomes a graphic analytical tool of information on a student‟sperformance in comparison to the population of test-takers (“Texas Assessment of Knowledgeand Skills: Raw Score Conversion Table, Mathematics - Spring 2006 Administration, ExitLevel”).For special populations who are beneficiaries of inclusion programs in regular public schools,the State-Developed Alternative Assessment (SDAA) and the Locally Determined AlternateAssessment are alternative assessment tools that replace the TAKS when the latter is deemedinappropriate to measure their gains in proficiency. Similarly, for students with limited Englishproficiency, the Reading Proficiency Tests in English (RPTE) is the standardized test deemedappropriate for assessment.The HISD has also been a participant to the Stanford and Aprenda national standardized testssponsored by the National Assessment of Educational Progress (NAEP) since 1997. TheStanford Achievement Test assesses student achievement in reading, mathematics, language,spelling, study skills, thinking skills, listening, environment/science, and social science. TheAprenda is the Spanish language version of the Stanford and is administered to Hispanic studentswith limited English proficiency. The SAT/Aprenda is a series of 11 steps that track students‟academic achievement from primary years to eleventh grade. As such, score reports also includean indicator on a test-taker‟s grade level in skills and knowledge. The Stanford AchievementTests are also norm-referenced, so that, again, the normal curve plays a key role in assessing thestate of American education, as individuals, schools, and groups are compared against thenational norm (“Glossary: Definition of Terms and Data Sources”).The Scholastic Aptitude/Assessment Test, or SAT, gives raw scores on a scale ranging from200 to 800 with a mean of 500 and a standard deviation of 100. But scores are reported inrelation to a norm group, or a similar group of test-takers, and are, therefore, converted into astandard score for college admission purposes. The SAT consists of two sections: verbal andmathematical reasoning abilities, and student‟s knowledge in specific subject areas and thestudent‟s ability to apply the knowledge (Samuda 131-133).60Houston Teachers Institute
Standardized test results are oftentimes reported along with percentiles and percentile ranks,which give information on the performance of the taker in comparison to the population of testtakers, or in accordance with the scores of a predetermined norm group that has been establishedas representative of the group of test-takers. If a particular examinee‟s score is determined to bein the 75th percentile, his or her percentile rank of 75 puts him/her in a position above 75% of theexaminees. In a normal distribution, when a student‟s or test-taker‟s score has been converted to az or standard score, his or her percentile rank among the population of test-takers may beobtained by referring to a standard or unit normal table. Such a table is normally found in theappendix section of a statistics reference book. For a start, the reader may refer to Gravetter andWallnau‟s “Statistics for the Behavioral Sciences (690 – 693).By definition, percentile ranks can be obtained for any distribution, whether normal orskewed (not symmetrical), in a set of data arranged in ascending order. The special nature of thedistribution of a normal curve makes scale scores that are assumed to be normally distributedeasily convertible into the percentile rank associated with standard scores. First, an examinee‟sscaled score is converted into a standard z score. The area to the left of this standard score,representing the probability or proportion of scores below that score, is determined using thenormal table for areas, or using a probability calculator. This probability or area is thenmultiplied by 100 to obtain the percentile rank based on an assumption of normal distribution ofachievement scores.Pr 100(Area to the left of z score)Since the percentile rank for any examinee is determined by his or her position in the rankedorder of the population of examinees, it can be obtained from a frequency table that arrangesscores, with their corresponding frequencies, in ascending order. Percentile rank for a particularscale score is obtained by adding the proportion of scores below that score to half the frequencyof that score. The sum is a fraction or decimal, which is then multiplied by 100 to give thepercentile rank. TEA‟s Student Assessment Division illustrates this procedure for obtaining thepercentile rank of a student directly from the frequency table of scaled scores for the 2003 exitlevel Grade (“Converting a TAKS Scale Score to a Percentile Rank”). The formula is worked outindependently of the mean μ and standard deviation σ:PR(x) ((f / 2 L ) / N)100x scale score of interestf frequency of the scale score of interestL cumulative frequency associated with the next lowest scale scoreN population size (number of persons tested).In a normal distribution, scores are closer around the mean and much farther apart at theextreme ends. Percentile ranks derived from a standard normal table would not be scaled onequal intervals the way the above formula based on a frequency table would generate their values.Normal table percentile ranks would show values that are more proximate around the mean andmore disparate at extreme scores. The normal curve equivalent (NCE) corrects for thismisleading ranking. The ranking according to the normal curve is modified such that thecalibrated scores along the horizontal axis are rescaled into 99 equal divisions with 50 as themiddle value and 1 and 99 as the first and last percentile ranks. The Stanford/Aprenda tests ofachievement utilize the NCE when ranking the population of examinees, because scores areinterpreted in comparison to a preexisting norm representing a nationwide population.Editha E. Josue61
Figure 6: (“Normal Curve Equivalent.” p/rdgstudy/nce.html)Performances of students in achievement and proficiency tests are always disaggregated intothe performances of subgroups of the population of test-takers, evaluated against the same criteriaof target gains and percentage of those passing proficiency. In the accountability system of theNCLB Act, these subgroups are the ethnic subpopulations (whites, African-Americans, Hispanics,Asians, Native Americans), special education populations, those with limited English proficiency(LEP), and those who fall under the definition of low socio-economic status (SES). Under theTexas state accountability system, comparison of the performance of demographic and programgroups is done on TAKS scale score averages and the percentages of students meeting standards.SAT and ACT mean scores for demographic groups are compared to the norm or to each other toassess differences and deviations from each other. The Stanford/Aprenda is likewise normreferenced.There is great concern about closing of the achievement gap among these groups. This hasalways been the ultimate standard or indicator by which the success of educational reforms isgauged. Very recently, Dr. Abelardo Saavedra, HISD‟s Superintendent, reminded allstakeholders to students‟ education, that while gains have been made in terms of the percentage ofstudents performing satisfactorily in TAKS and Stanford/Aprenda, there continues anunacceptably large achievement gap among the ethnic and disadvantaged groups that need to bebridged completely (“Achievement Gap Among Fifth-Graders in HISD Narrows”).In all these ways of assessing, the normal distribution of achievement is an underlyingassumption. This means that demographic groups and general populations follow a distributionwhere majority of the students in a group perform around a norm or central average. If a normaldistribution always depicts a set of data, what does it mean then to close the achievement gap?The integration of the mathematical concept with the goals of accountability is the challengethat students in the magnet program course will address. While the tests norm groups andcompare group averages, individual scores indicate whether students are performing at par withstandards or are performing better. The implication of a scenario where a growing number ofstudents have been meeting standards or achieving higher scores in these tests would translateinto group score means, the peaks in subpopulation normal
THE BELL CURVE: A MATHEMATICAL MODEL FOR A VARIETY OF REAL-WORLD PROCESSES The Nature of the Normal Curve and the Normal Curve of Nature The normal curve is a ubiquitous model in the subject of intelligence and achievement measurement, and is, therefore, a fixture, too, in an introducto