Transcription
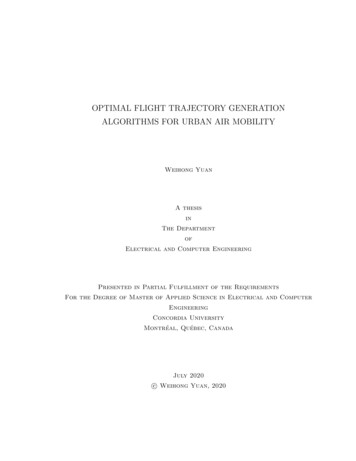
ESTIMATION OF THE OPTIMAL GUIDE CURVE FORA RESERVOIR, CASE STUDY COPA DAM, BOYACÁ1. SANABRIA J ., 2. SANTOS G., 3. SIERRA F.,. 4. GERALD A. CORZO cuelaing.edu.co ps://www.un-ihe.org/https://www.escuelaing.edu.co/
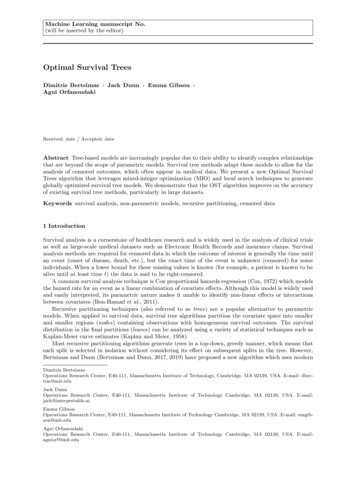
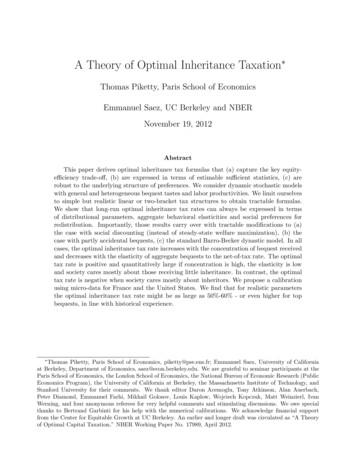
INTRODUCTIONESTIMATION OF THE OPTIMAL GUIDE CURVE FOR A RESERVOIR, CASESTUDY COPA DAM, BOYACÁThe objective of the study is the understanding of the guide curve calculation for thereservoir management releases in order to improve the storage usage which can be usedfor multi-objective purposes.La Copa reservoir, located in the upper Chicamocha river basin in Colombia was originallybuilt with the objective of mitigating floods over the valley. An irrigation district was latterestablished, with the objective of supplying water to farmers.This study presents the analysis and optimization of operational rules to minimize thelikelihood of floods and shortages for the irrigation district considering the uncertainty inthe hydrological system.2011 Flooding Conditions DownstreamLa Copa Dam2
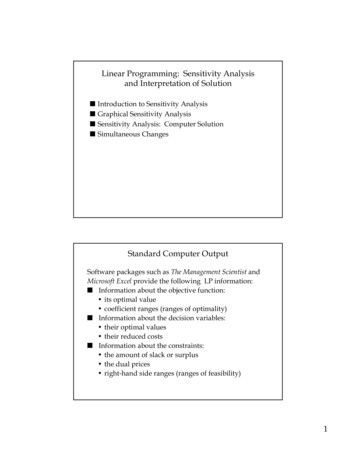
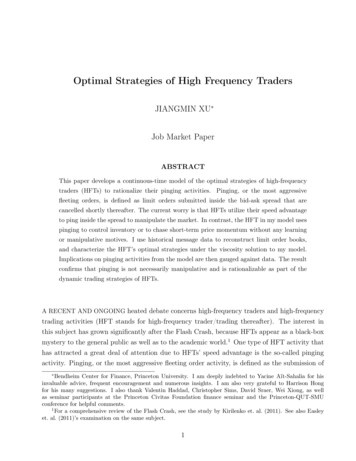
ESTIMATION OF THE OPTIMAL GUIDE CURVE FOR A RESERVOIR, CASESTUDY COPA DAM, BOYACÁGENERAL LOCATION110000011200001140000Located in Boyacá - Colombia, La Copareservoir was built in 1993 to supply thedemands of USOCHICAMOCHA irrigationsystem in the Chicamocha river basin.1140000 1120000Inundation Area: 326 Km21120000Total Storage: 70 Hm3Sources: Esri, HERE, Garmin, Intermap,increment P Corp., GEBCO, USGS,FAO, NPS, NRCAN, GeoBase, IGN,Kadaster NL, Ordnance Survey, EsriJapan, METI, Esri China (Hong Kong),(c) OpenStreetMap contributors, and theGIS User CommunityStorage for irrigation: 34.5 Hm3Storage for flooding: 5 Hm3ConvencionesLaguna 500000La Copa ReservoirEmbalse 100000RASk.tif1100000High : 2541.8202.5510110000015Sources: Esri, HERE, Garmin, Intermap, increment PCorp., GEBCO, USGS, FAO, NPS,GeoBase,LowNRCAN,: 2533.91IGN, Kadaster NL, Ordnance Survey, Esri Japan,METI, Esri China (Hong Kong), (c) OpenStreetMapKilometerscontributors, and the GIS User AlineamientoCommunity, Sources:20Esri, Garmin, USGS, NPS11200001100000ValueSources: Esri, HERE, Garmin, Intermap,increment P Corp., GEBCO, USGS,FAO, NPS, NRCAN, GeoBase, IGN,Kadaster NL, Ordnance Survey, EsriJapan, METI, Esri China (Hong Kong),3
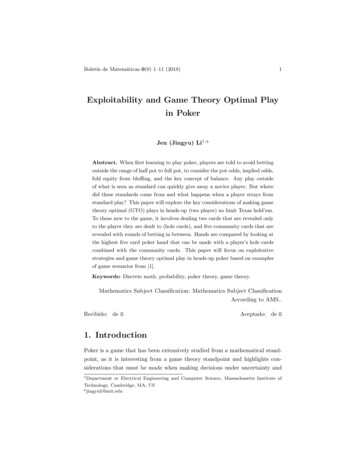
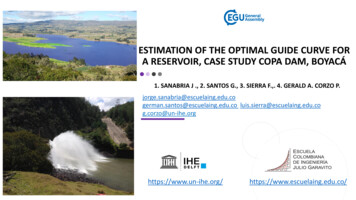
PROBLEM DESCRIPTION1. Flooding Boundary 2011yearESTIMATION OF THE OPTIMAL GUIDE CURVE FOR A RESERVOIR,CASE STUDY COPA DAM, BOYACÁ12. Dam Release (HowellBunger Valves)3. Detail Dam Embankment4. General View BoundaryReservoir Extent2344
PROBLEM DESCRIPTIONESTIMATION OF THE OPTIMAL GUIDE CURVE FOR A RESERVOIR, CASESTUDY COPA DAM, BOYACÁOperation of a reservoir must address one or more objectives, those are mainlyrelated to flood control and water supply. While flood control objective requires themost storage capacity available in the reservoir for high runoff volumes, water supplyobjective requires the reservoir to be as full as possible in order to provide the waterdemands.Thus, a methodology was developed aimed to find and optimized guide curve takinginto account both flood control and water supply objectives.Trough a case study, a reservoir simulation model was constructed for a either acritical wet year and a critical dry year. In order to select the appropriate set point forthe case study, a set of methodologies where tested and compared.The releases calculated by the decision scheme for the suitable set point werehydrodynamically modelled downstream to validate the reduction of the flood risksfor the wet year.5
PROBLEM DESCRIPTIONESTIMATION OF THE OPTIMAL GUIDE CURVE FOR A RESERVOIR, CASESTUDY COPA DAM, BOYACÁGuide curve is the Setpoint to bereached by the decision scheme atany time step of the simulationperiod.Operation rules are the constraintsin the simulation model e.g (fullbank discharge downstream)Basin partially instrumented, a dailyinflow discharges are constructedusing semi-distributed model.Flow Chart of the Operational Water Management Simulation in the Reservoir6
ESTIMATION OF THE OPTIMAL GUIDE CURVE FOR A RESERVOIR, CASESTUDY COPA DAM, BOYACÁCOMPONENTS IN THEOPTIMIZATION PROBLEM Objective Function: Minimize the sum of the excess and shortage volumes expected in theyear.OF 𝑚i𝑛 (𝑉𝑒𝑥𝑐𝑒𝑠𝑠 𝑉𝑠ℎ𝑜𝑟𝑡𝑎𝑔𝑒 ൯ Decision Variables: For the case study are the releases from the dam Constraints: Physical and environmental restrictive conditions for the variables in thereservoir:Operational Zone: Maximum and minimum water levelsBankfull Discharges: Maximum downstream flows before floodingMinimum Discharge: Echological flow in the stream Setpoint as a guide curve: Calculated by using different methodologies7
DECISION SCHEMESMODELLED DS based in the comparison of guidecurve level (setpoint) from theactual month with respect to thereservoir level at end of theprecedent month. DS based in the comparison of guidecurve level (setpoint) from theactual month with respect to thereservoir level at the beginning ofthe precedent month. DS for the reservoir water levelprediction at the end of the actualmonth by using both maximumrelease and the maximum bankfulldischarge downstream.ESTIMATION OF THE OPTIMAL GUIDE CURVE FOR A RESERVOIR, CASESTUDY COPA DAM, BOYACÁGuide curveE.g. For February, the purpouse is conservation, given that the level at thebeggining of the precedent month is lower than the level at the actual monthDead ElevationSpillwayMax LevelSelected GCWet year operationMaximum DischargeMinimum DischargeE.g. For April, the purpouse is flood control, given that the level at thebeggining of the march is lower than the level at the actual monthDecision Scheme for Maximum Discharges in Hec-ResSim8
PHYSICAL PROCESSESMODELLEDESTIMATION OF THE OPTIMAL GUIDE CURVE FOR A RESERVOIR, CASESTUDY COPA DAM, BOYACÁHydrological SimulationThe dam inflow daily discharges werecalculated with an Hec-Hms hydrologicalmodel.Reservoir ProtocolOperation (GuideCurves Testing)2D Hydrodinamical FloodTesting DownstreamThe reservoir operation was simulatedwith HecResSim model.The downstream river condition for themanaged releases was tested with HecRas 2DAdapted From Stream Corridor Restoration, 2001.9
HYDROLOGIC MODELLINGESTIMATION OF THE OPTIMAL GUIDE CURVE FOR A RESERVOIR, CASESTUDY COPA DAM, BOYACÁAcontinuoussemi-distributedhydrological model was created forthe basin in the year 2011, whichwas an abnormal rainy.SMA (Soil Moisture Accounting) lossmethodology was selected.The model was calibrated with dailydischarge measurements.La Reforma Discharge StationThe upstream dam catchment is partially instrumented, the calibrated model allows to estimatethe daily discharges in the whole upstream reservoir catchment.10
HYDRAULIC MODELLINGESTIMATION OF THE OPTIMAL GUIDE CURVE FOR A RESERVOIR, CASESTUDY COPA DAM, BOYACÁTo understand the effects of the criticaldischarges, a 2D hydraulic model wasbuilt downstream the dam.Hec-Ras 2D Model was executed for the45 days analysis period, where peakdischarges occurred.River flood conditions were observeddownstream the dam.Flooding Conditions Modelled Downstream Dam withoutOperation11
RESERVOIR OPERATIONMODELLINGESTIMATION OF THE OPTIMAL GUIDE CURVE FOR A RESERVOIR, CASESTUDY COPA DAM, BOYACÁZone Flood ControlThe output discharges from thehydrological model were used todesign the reservoir operationmodel.Conservation ZoneHec-ResSim ReservoirManagement Software was used totest the reservoir guide curvesperformance.A set of different guide curves werecreated using differentmethodologies.Hec-ResSim SchematicHec-ResSim Results12
GUIDE CURVECONSTRUCTIONESTIMATION OF THE OPTIMAL GUIDE CURVE FOR A RESERVOIR, CASESTUDY COPA DAM, BOYACÁMETHODOLOGIES FOR GUIDECURVE CONSTRUCTION Using the guide curvesoftware calculation CEH-ECI(2008) Calculating the awaiting andreserve volumes required ineach month using statisticalanalysis Using optimization methodsMES Guide CurveMontecarlo method𝑉𝑓 𝑉𝑖 𝐴 𝐷 𝑁 0.0864Where,𝑉𝑓 𝑅𝑒𝑠𝑒𝑟𝑣𝑜𝑖𝑟 𝑣𝑜𝑙𝑢𝑚𝑒 𝑝𝑟𝑒𝑐𝑒𝑑𝑒𝑛𝑡 𝑚𝑜𝑛𝑡ℎ 𝑀𝑚3𝑉𝑖 𝑅𝑒𝑠𝑒𝑟𝑣𝑜𝑖𝑟 𝑣𝑜𝑙𝑢𝑚𝑒 𝑎𝑡 𝑡ℎ𝑒 𝑒𝑛𝑑 𝑜𝑓 𝑡ℎ𝑒 𝑎𝑐𝑡𝑢𝑎𝑙 𝑚𝑜𝑛𝑡ℎ 𝑀𝑚3𝐴 𝑀𝑒𝑎𝑛 𝑚𝑜𝑛𝑡ℎ𝑙𝑦 ��� 𝑚𝑒𝑎𝑛 𝑟𝑒𝑙𝑒𝑎𝑠𝑒𝑠 𝑎𝑡 𝑡ℎ𝑒 𝑎𝑐𝑡𝑢𝑎𝑙 𝑚𝑜𝑛𝑡ℎ𝑠𝑁 𝑛𝑢𝑚𝑏𝑒𝑟 𝑜𝑓 𝑚𝑜𝑛𝑡ℎ 𝑑𝑎𝑦𝑠The given equation is a regressive calculation of the monthly volumes needed to ensurethe required releases of the reservoir.The objective is the calculation of the volumen at the end of the previous month to supplythe monthly demands using the affluences and the expected volume at the end of themonth.13
GUIDE CURVECONSTRUCTIONESTIMATION OF THE OPTIMAL GUIDE CURVE FOR A RESERVOIR, CASESTUDY COPA DAM, BOYACÁMETHODOLOGIES FOR GUIDECURVE CONSTRUCTIONDead ElevationSpillway Using the guide curvesoftware calculation CEH-ECI(2008)Maximum leve Calculating the awaiting andreserve volumes required ineach month using statisticalanalysis Using optimization methodsMES Guide CurveMontecarlo methodGuide Curve CEH-ECICG (EAAB-ESP, 2008) is a software which has capabilities in guide curve construction formonthly reservoir operation by using historic hydrological series (precipitation, discharges,evaporation and infiltration) and basic information from the reservoir as elevation, volume andboundary areas.14
ESTIMATION OF THE OPTIMAL GUIDE CURVE FOR A RESERVOIR, CASESTUDY COPA DAM, BOYACÁGUIDE CURVECONSTRUCTIONMETHODOLOGIES FOR GUIDECURVE CONSTRUCTION𝑞𝑖,𝑗 𝑋ഥ𝑗 𝜌𝑖,𝑗 1 𝑆𝑗𝑞𝑖,𝑗 1 𝑋ത𝑗 1 𝑍𝑖,𝑗 𝑆𝑗 1 𝜌𝑖,𝑗 1𝑆𝑗 12Where: Using the guide curvesoftware calculation CEH-ECI(2008) Calculating the awaiting andreserve volumes required ineach month using statisticalanalysis Using optimization methods𝑋ഥ𝑗 : Mean historic discharges for month j under consideration.𝑋ത𝑗 1 : Mean historic discharges for month j-1 under consideration.𝜌𝑖,𝑗 1 : First order correlation coefficient between the values in succesive months.𝑆𝑗 : Standard deviation for the historical discharges in j month.𝑆𝑗 1 : Standard deviation for the historical discharges in j-1 month.𝑞𝑖,𝑗 : Discharges at j month of the year i for the generated discharge sequence.𝑞𝑖,𝑗 1 : Discharges at j-1 month of the year i for the generated discharge sequence.𝑍𝑖,𝑗 : Random variable normally distributed applied to the j month for the i year.Thomas & Fiering ModelMES Guide CurveMontecarlo methodHistoric discharge records can be extended using the principle of presistence which indicatesthe high probability of low flow followed by a low flow due to the storage effect.15
ESTIMATION OF THE OPTIMAL GUIDE CURVE FOR A RESERVOIR, CASESTUDY COPA DAM, BOYACÁGUIDE CURVECONSTRUCTIONMETHODOLOGIES FOR GUIDECURVE CONSTRUCTION Using the guide curvesoftware calculation CEH-ECI(2008) Calculating the awaiting andreserve volumes required ineach month using statisticalanalysis Using optimization methodsMES Guide CurveMontecarlo methodGuide curve Awaiting and reservevolumeswerecalculated using theshownequations,and then related tolevels at the reservoirin accordance to itsshapeDead ElevationSpillwayMaximum levelReserve levelAwaiting levelGuide curve𝑸𝐦𝐢𝐧 𝑸𝒆𝒒 𝑸𝒔𝒖𝒑𝒑𝒍𝒚𝑸𝑴𝒂𝒙 𝒐𝒖𝒕𝒇𝒍𝒐𝒘 𝑸𝒎𝒂𝒙𝒔𝒕𝒓𝒆𝒂𝒎 ��𝒊𝒕 (𝑸𝒎𝒊𝒏 �� ) 𝑻𝑽𝒆𝒙𝒄𝒆𝒔𝒔 (𝑸𝒊𝒏𝒇𝒍𝒐𝒘𝒅𝒂𝒎 𝑸𝑴𝒂𝒙 𝒐𝒖𝒕𝒇𝒍𝒐𝒘 ) 𝑻Where:Where:𝑉𝑑𝑒𝑓𝑖𝑐𝑖𝑡 : Volume shortage to ensure the mínimumdischarge en dry periods (Mm3)𝑄m𝑖𝑛 : Minimum monthly discharge 𝑒𝑑 : Monthly inflow average discharge to thereservoir (m3/s)𝑇: Time monthly period in seconds𝑉𝑒𝑥𝑐𝑒𝑠𝑠 : Excess volumen for storage (Mm3)𝑄max𝑠𝑡𝑟𝑒𝑎𝑚 : Maximum bankfull discharge downstream (m3/s)𝑄𝑖𝑛𝑓𝑙𝑜𝑤 : Monthly Average discharges from the affluent streamsbetween the dam and the interest site (m3/s)𝑄𝑖𝑛𝑓𝑙𝑜𝑤𝑑𝑎𝑚 : Monthly average máximum discharges to the reservoir(m3/s)𝑇: Time monthly period in secondsGuide Curve Awaiting – Reserve for Minimum VolumesGuide Curve Awaiting – Reserve for Maximum Volumes16
GUIDE CURVECONSTRUCTIONESTIMATION OF THE OPTIMAL GUIDE CURVE FOR A RESERVOIR, CASESTUDY COPA DAM, BOYACÁMETHODOLOGIES FOR GUIDECURVE CONSTRUCTION Using the guide curvesoftware calculation CEH-ECI(2008)Guide curveDead ElevationSpillwayMaximum level Calculating the awaiting andreserve volumes required ineach month using statisticalanalysis Using optimization methodsMES Guide CurveMontecarlo methodMES Guide CurveMinimum Excess and Shortage guide curve was created by defining the objective function andthe optimal parameters like water levels for each month of the year, it can be constructed areservoir guide curve, with twelve decision variables. The optimization methods are simple buteffective, which find the minimum or maximum value of a real function creating variations inthe optimization parameters considering the restrictions for these values.17
GUIDE CURVECONSTRUCTIONESTIMATION OF THE OPTIMAL GUIDE CURVE FOR A RESERVOIR, CASESTUDY COPA DAM, BOYACÁMETHODOLOGIES FOR GUIDECURVE CONSTRUCTION5000 data series Using the guide curvesoftware calculation CEH-ECI(2008) Calculating the awaiting andreserve volumes required ineach month using statisticalanalysis Using optimization methodsMES Guide CurveMonte Carlo methodMonte Carlo MethodThis method creates a set of random values which can be evaluated in order to estimatethe optimal value by a high number of simulations. This method uses the Markov ChainMonte Carlo (MCMC) Algorithms.18
GUIDE CURVECONSTRUCTIONESTIMATION OF THE OPTIMAL GUIDE CURVE FOR A RESERVOIR, CASESTUDY COPA DAM, BOYACÁMETHODOLOGIES FOR GUIDECURVE CONSTRUCTION Using the guide curvesoftware calculation CEH-ECI(2008)Dead Elevation Calculating the awaiting andreserve volumes required ineach month using statisticalanalysisSpillwayMaximum level Using optimization methodsMES Guide CurveMonte Carlo methodMonte Carlo Method19
GUIDE CURVECONSTRUCTIONESTIMATION OF THE OPTIMAL GUIDE CURVE FOR A RESERVOIR, CASESTUDY COPA DAM, BOYACÁGuide curveMonthly variation of each guide curvecalculated using differentmethodologiesThe guide curves were tested withHec-ResSim in order to verify It’sperformance. An average failurepercentage was calculated for eachcurve to select the optimal forflooding conditions. The minimumexcess and shortage guide curve wasselected as the best for the casestudy.SpillwayMaximum levelGC Awaiting/ReserveGC CEH-ECIMES Guide CurveGC Montecarlo 2Using this guide curve were calculatedthe flood conditions downstreamusing the hydrodynamical model.20
RESERVOIR OPERATIONMODELLINGESTIMATION OF THE OPTIMAL GUIDE CURVE FOR A RESERVOIR, CASESTUDY COPA DAM, BOYACÁSimulated reservoir levelGuide CurveMES guide curve operation formaximum discharges.Uncontrolled discharge given to the increase ofthe reservoir level surpassing the weir elevationMinimum excess and shortage guide curve performance in Hec-ResSim model21
RESERVOIROPERATION HYDRAULICMODELLINGResults from the operation byusing MES guide curve.ESTIMATION OF THE OPTIMAL GUIDE CURVE FOR A RESERVOIR, CASESTUDY COPA DAM, BOYACÁTuta and Jordánriver confluenceMES-GCNON REGULATEDREGULATED(Guide curves operation)2D MODELLING – 15Th APRIL22
RESERVOIROPERATION HYDRAULICMODELLINGResults from the operation byusing MES guide curve.ESTIMATION OF THE OPTIMAL GUIDE CURVE FOR A RESERVOIR, CASESTUDY COPA DAM, BOYACÁTuta and Jordánriver confluenceCG4MES-GCNON REGULATEDREGULATED(Guide curves operation)2D MODELLING REGULATED – 21Th APRIL23
CONCLUSIONSESTIMATION OF THE OPTIMAL GUIDE CURVE FOR A RESERVOIR, CASESTUDY COPA DAM, BOYACÁ The calculation of the required volumes does not take into accountthe peak discharge distribution in each month. This can understimatethe required volume for high floods storage which can occurbetween 10 and 15 rainy days of a wet month. The awaiting and reserve volumes method is calculated by thehistorical affluences to the reservoir for each month separately andindependently. This affects the guide curve performance because itconsiders that at the begining of the month, the resevoir level is ableto reach the guide curve level which is not always possible due theantecedent level conditions. The optimization methods are the best tool for the guide curvecalculation when there are different operational objectives, due tothe formulation capabilities and the maximization of the benefitssought.24
CONCLUSIONSESTIMATION OF THE OPTIMAL GUIDE CURVE FOR A RESERVOIR, CASESTUDY COPA DAM, BOYACÁ Guide curve selection by optimization is a large technical field. Thepresent study has implemented Monte Carlo methodology and agenetic algorithm by using objective function. However, thedecision variables were excess and deficit volumes. Otheroptimization methods can be used in other cases, whith differentobjective functions and variables. The application of the reservoir operation and control by guidecurves is linked to early warning systems in which hydrologicalshort term forecasting can be modelled in the reservoir simulationsofware in order to reduce the effects of flooding downstream bymanaging the reservoir releases.25
ESTIMATION OF THE OPTIMAL GUIDE CURVE FOR A RESERVOIR, CASESTUDY COPA DAM, BOYACÁREFERENCES US Army Corps of Engineers. (2013). HEC-ResSim Reservoir System Simulation User s Manual. Empresa de Acueducto y Alcantarillado E.S.P de Bogotá - Escuela Colombiana deIngeniería Julio Garavito. (2008). Modelo de evaluación de curvas de niveles de unembalse. Curvas guía para el embalse de Chuza. Bogotá. Sanabria, J. Guía Metodológica Para El Análisis De La Gestión De Embalses. Caso DeEstudio Embalse La Copa. (2019)26
THANK edu.co/
ESTIMATION OF THE OPTIMAL GUIDE CURVE FOR A RESERVOIR, CASE STUDY COPA DAM, BOYACÁ Guide Curve Awaiting -Reserve for Minimum Volumes 16 METHODOLOGIES FOR GUIDE CURVE CONSTRUCTION Using the guide curve software calculation CEH-ECI (2008) Calculating the awaiting and reserve volumes required in each month using statistical analysis