Transcription
Visualizing Data with Graphs andMapsYifan HuAT&T Labs – ResearchNISTMay 7, 2012
Outline The graph visualization problemAlgorithms & challenges for visualizing largegraphsVisualizing cluster relationships as maps
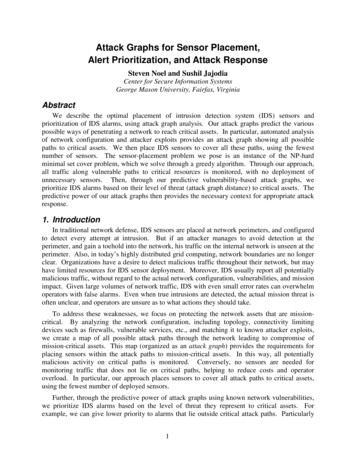
The graph visualization problem Given some relational data{Farid—Aadil, Latif—Aadil, Farid—Latif,Carol—Andre, Carol—Fernando, Carol—Diane, Andre—Diane, Farid—Izdihar, Andre—Fernando, Izdihar—Mawsil, Andre—Beverly, Jane—Farid, Fernando—Diane, Fernando—Garth,Fernando—Heather, Diane—Beverly, Diane—Garth, Diane—Ed, Beverly—Garth,Beverly—Ed, Garth—Ed, Garth—Heather, Jane—Aadil,Heather—Jane, Mawsil—Latif} It is not easy to see what's going on!
The graph visualization problem But if we visualize it
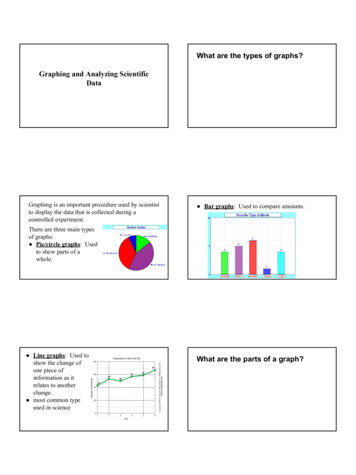
The graph visualization problem The graph visualization problem: to achieve a“good” visual representation of a graph usingnode-link diagram (points and lines).Main criteria for a good visualization: readabilityand aesthetics.Small area, good aspect ratio, few edge crossovers, showing symmetry/clusters if exist,sufficiently large edge-edge, node-node andnode-edge resolution, planar drawing for planargraph, .
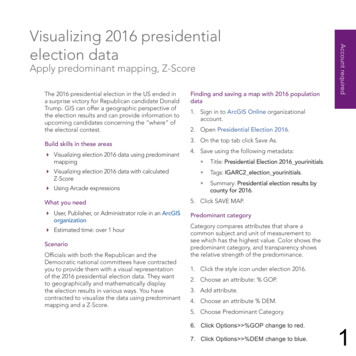
The graph visualization problem Different styles of graph drawing: circular layout
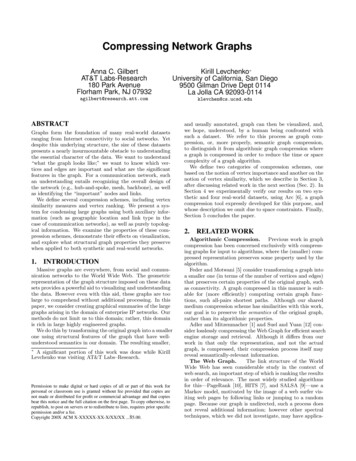
The graph visualization problem Different styles of graphdrawing: hierarchical layout
The graph visualization problem Other styles: orthogonal, grid drawing, visibilitydrawings.This talk concentrates on undirected/straightedge drawing of non-planar graphs.
Graph drawing algorithms Hand layout not feasible (unless small graphs) Automated algorithms needed Virtual physical models are popular Spring model vs spring-electrical model Spring model: a spring between every pair ofverticesIdeal spring length graph distance
Spring Model (aka Stress Model) {1—2, 2—3, 1—3, 1—4, 2—4, 3—4, 4—5}
Spring Model (aka Stress Model) {1—2, 2—3, 1—3, 1—4, 2—4, 3—4, 4—5}
Spring Model (aka Stress Model) Spring model Kruskal & Seery (1980); Kamada & Kwai (1989)
Spring Model (aka Stress Model) Spring model Solution method: Stress majorization (de Leeuw, J. , 1977;Gasner, Koren & North, 2004)
Spring Model (aka Stress Model) Stress majorization on a grid graph
Spring Model (aka Stress Model) Stress majorization on a grid graph
Spring Model (aka Stress Model) But this model is not scalable All-pairs shortest paths: Memory:
Spring-electrical Model Eades (1984), Fruchterman & Reigold (1991) Energy to minimize: Repulsive force Attractive force
Spring-electrical Model Force directed iterative process:for every nodecalculate the attractive & repulsive forcesmove the node along the direction of the forcerepeat until converge But still not scalable: all-to-all repulsive force Easy to get trapped in a local minima
Reducing the complexityGroup remote nodes as supernodes(Barnes-Hut, 1986; Tunkelang, 1999; Quigley2001) Reduce complexity to
Reducing thecomplexity Implementation: quadtree/KD-tree. Example: 932 20 force calculation.
Reducing thecomplexity Taking one step further: supernode-supernode. Burton et al. (1998), particle simulation.
Finding global optimum Force directed algorithm: easy to get trapped inlocal minThe larger the graph, the more likely to gettrapped.Also, smooth errors are harder to erase with
Finding global optimum
Finding global optimum
Global Optimum: Multilevel Global optimum more likely with multilevelapproach (Walshaw, 2005)
Spring-electrical: Large Graphs Multilevel fast O( V log ( V )) forceapproximation efficient & good quality graphlayout algorithms (Hachul&Junger 2005; Hu2005).
Spring-electrical: Large Graphs Multilevel fast O( V log ( V )) forceapproximation efficient & good quality graphlayout algorithm (Hachul&Junger 2005; Hu2005).
Other graph layout algorithms Eigenvector based methods (Hall's algorithm).High dimensional Embedding (Harel & Koren, 2002)- Find distance from k vertices to all vertices- Apply PCA to the V x k matrix to get the top 2eigenvectors, use as coordinates PivotMDS (Brandes & Pich, 2006)All fast, but not good layout for graphs of largeintrinsic dimension/non-rigid graphs
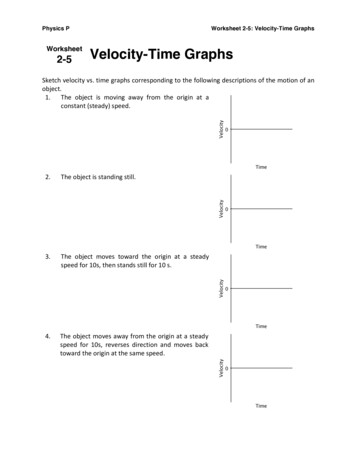
Drawing by some layout algorithmsSpring (Stress) ModelEigenvector (Hall's) methodSpring-electrical modelHigh dimensional embedding
Graph visualization: challenges Some graphs are difficult to layout Size of graphs get larger and larger Making complex relational data accessible to thegeneral publicLarge graphs with predefined distance (can't usespring model)
Challenges: some graphs are hard Multilevel spring-electrical works for a largenumber of graphs, but not all!When applied to some real world graphs, theresults: not good.Example: Gupta1 matrix. 31802 x 31802.
Problem: Multilevel Coarsening A look at the multilevel process on Gupta1The problem: usual coarsening schemes do notwork well level V E 031802213240812086120766342120341983352311088 Coarsening tooslow, stop!Coarsening has to stop to avoid high complexity!
Multilevel Coarsening 1 A popular coarsening scheme: contraction of amaximal independent edge set
Multilevel Coarsening 2 Another popular coarsening scheme: maximalIndependent vertex set filtering
Coarsening Scheme Fails The usual coarsening algorithms fails on somegraph structuresExample: a graph with a few high degree nodesSuch structure appears quite often in real worldgraphs
Coarsening Scheme Fails Maximal independent edge set coarsening: 6edges out of 378 picked
Coarsening Scheme Fails Maximal independent vertex set coarsening: allbut 10 are chosen
Better coarsening The solution: recognize such structure andgroup similar nodes first, before maximalindependent edge/vertex set based coarsening. Instead of We do
Better coarsening The result on Gupta1 matrix
Challenges: size keeps increasing Example: University of Florida Sparse MatrixCollection (Davis & Hu, ces/The largest sparse matrix collection with 2500matrices and growingBuilt on the success of MatrixMarket
Challenges: size keeps increasing Many different types of matrices: a good testingground for linear algebra/combinatoricalalgorithmsE.g., testing on this collection revealed thecoarsening issued discussed
Challenges: size keeps increasing Size keeps growing!Largest matrix: 50 million rows/columns and 2billion nonzeros
Challenges: size keeps increasing The largest graph: sk-2005, crawl of the .sk(Slovakian) domain 2 billion edges Challenge to layout: need 64 bit version. Challenge to rendering: 100 GB postscript. Convert to jpg/gif using ImageMagic: crash. Solution: rendering using OpenGL. But my desktop only has 12 GB rendering ina streaming fashion (does not stores theedges).
The largest graph in the collection The result:Challenges: some graphs are hard to visualize– small world graph like that!
Challenges: hard graphs Visualizing small world graphs Possible tool: filtering. E.g., via k-core decom.
Challenges: hard graphs Visualizing small world graphs Possible tool:- abstraction (icons for cliques)- hierarchical (multilevel) view- fish-eye view Another possible tool: edge bundling
Challenges: hard graphs Fast O( E log( E ) edge bundling (with Gansner)
Challenges: some graphs are hard Even drawing trees can be tricky!Spring-electrical model suffers from a “warpingeffect”.A spanning tree from a web graph
Drawing trees Proximity stress model (with Koren, 2009)
Drawing trees The tree of life
An Internet map: Reagan/Dulles
Visualizing graphs as maps So far graphs node-link diagrams Not familiar to the general public Example
Recommender System Visualization AT&T provides digital TV (U-verse). A few hundred channels: need a recom. system! Recommending TV shows- If you like X, you will also like Y & Z.- Based on SVD/kNN: similarity of shows Like to visualize to see if model makes senseAlso provide a way for users to explore the TVlandscape.
Recommender System Visualization Top 1000 shows and how they relate to eachother.
Recommender System Visualization How can we highlight these clusters? One approach: clustering colored nodes Messy. Not easy to understand for general public.Better defined bounary a map?
Recommender System Visualization Virtual maps are use frequently E.g., “online community”, circa 2007 Can we make a maplike that, but usereal data?
Gmap algorithm Gmap algorithm (Gansner, Hu & Kobourov,2010) – available as gvmap from GraphViz.Four step process- embedding- clustering- mapping- coloring
Gmap algorithm Embedding clustering use standard algorithm Mapping. Based on Voronoi diagram
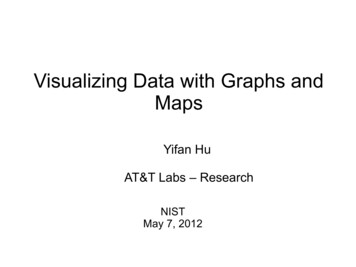
Gmap algorithm Apply to the TV graphBut the coloring needs improvement!
Gmap algorithm Coloring algorithm: maximize difference betweenneighboring countries. Solution: solve a graph optimization problem. Also know as the anti-bandwidth problem. Final result:
Gmap algorithm
Gmap applied to other areas Map of music; map of movies; map of books etc
Twitter VisualizationWhat are people talking about wrt the topic “news”?#pharma news: ACT Announces Second Patient with Dry AMD Treated in U.S. Clinical Trial with RPE Cells Derived from .http://t.co/EsqBjL00Nashville News Home Destroyed, Two Others Damaged By Fire: NASHVILLE, Tenn. A home was destroyed and two neighbo.http://t.co/dcxUF7nODanielle woke me up to the GREATEST news ðŸ RT @lbaraldo: devo dire che l'app #fineco e' quasi meglio del sito. I grafici immediati di alcune aree sono spettacolari e le newssono .The Affiliate Networks - DE News wurde gerade veröffentlicht! http://t.co/RbOt8OtJ â– Topthemen heute von @tddepromotions@affilinet news@jsimoniti I saw it on the news and could tell fairly easilyRT @The1Daily: That feeling when your friends try to tell you 1D news & you're like "I already know. Get on my level, dude.PROUD Direct .Valerio Pellegrini Digital News is out! http://t.co/UZacEO9k â– Top stories today via @palettod @dr8bit @alldigitalexpo @ggrchIn the news: (Examiner) Fake AT&T bills being used to deliver malware: http://t.co/lWWtfhec[NEWS PIC] 120416 Kangin's comeback - Happy Kyuhyun :'D http://t.co/X1J1djamRT @SizzlinStockPix: STOCKGOODIES PLAYS OF THE WEEK: STKO news just out link below http://t.co/FEYe2TR0@NatashaSade GM homegirl. We have until tomm to file. I just seen it on the news lol FYIMy horoscope said don't worry about it. I just news to find something to do with my time to get my mind off of itRT @Real Chichinhu: SM should release news to slap that stupid official from that stupid music siteBall State Daily News: Speaker informs students about female genital mutilation - http://t.co/FuN5LqKo via http://t.co/rkaZhaCv
Twitter Visualization Browsing can be tedious May even misses the overall picture Characteristics of Twitter stream- very short text (140 char)- streaming (3,000 tweets per second. 6X 2010)- considerable cross-copying (RT) andspontaneity What we like to see:- A “big picture” view- Clusterred and summarized- Detail on demand
Twitter Visualization The approach we propose: a succinct high levelvisual clustering, with textual summary, anddetails on demandWe will visualize only tweets relating to akeyword of interest
Tweet Similarity Finding similarity of tweets- either LDA, which gives distribution of topicsover words, then document over topic. Thensimilarity based on topic distribution- or, treat each tweet as a vector of words,scaled using tf-idf. Followed by cosine similarity We found that for tweets, the simplier tf-idfbased similarity works just as well
Tweet Similarity Threshold the similarity matrix: similarity 0.2 This gives a sparse graph Embed the graph similar tweets are close-by Apply Gmap: country cluster Keyword summary of clusters Screen shot taken March 18
Dynamic Stability We ensure layout stability by warm start Procrustes transformationunstablestableTime tTime t 1
Dynamic Stability Component packing stability- disconnected componentneeds repacking stablyRepack stably
Dynamic Stability Traditional packing algorithm: polyomino basedgreedy algorithm- Place the largest component at the origion- Place the next component as close to the originas possible without overlap- repeat Can pack very tight
Polyomino-based Packing Traditional packing algorithm: polyomino basedgreedy algorithm. Good/tight packingpadding 10padding 3padding 5padding 1
Stable Packing Tradition packing paysno consideration to stabilityNormalPacking alg.StablePacking alg.
Stable Packing Use “scaffold” to maintain the relative positions
Stable Packing Animate over 10 iterations
TwitterScope The algorithms are applied to an onlineapplication – TwitterScope Monitor keywords Push to the browser in a streaming fashion 300 tweets at a time For keywords like “news”, most of the tweetsand refreshed. Stability is impossible.For keywords like “visualization”, only a few newtweets per minutes – stability comes into play
Conclusion Significant progress in algorithms for drawinglarge graphs in the last 10 yearsChallenges remain due to ever increasing sizeand complexity of graphsMaking visualization in familiar metaphor canmake complex data accessible to a largeraudience (e.g., the Map of Music recorded 640Khits on stumbleupon.com)
The graph visualization problem The graph visualization problem: to achieve a "good" visual representation of a graph using node-link diagram (points and lines). Main criteria for a good visualization: readability and aesthetics. Small area, good aspect ratio, few edge cross- overs, showing symmetry/clusters if exist,