Transcription
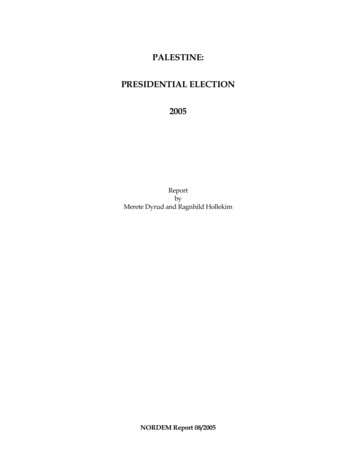
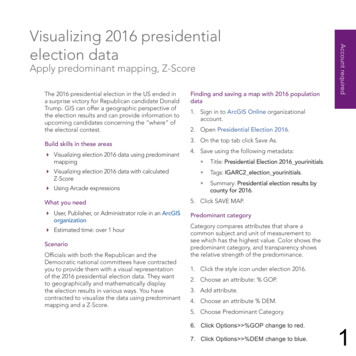
Apply predominant mapping, Z-ScoreThe 2016 presidential election in the US ended ina surprise victory for Republican candidate DonaldTrump. GIS can offer a geographic perspective ofthe election results and can provide information toupcoming candidates concerning the “where” ofthe electoral contest.Build skills in these areas Visualizing election 2016 data using predominantmapping Visualizing election 2016 data with calculatedZ-Score Using Arcade expressionsFinding and saving a map with 2016 populationdata1. Sign in to ArcGIS Online organizationalaccount.2. Open Presidential Election 2016.3. On the top tab click Save As.4. Save using the following metadata: Title: Presidential Election 2016 yourinitials. Tags: IGARC2 election yourinitials. Summary: Presidential election results bycounty for 2016.What you need5. Click SAVE MAP. User, Publisher, or Administrator role in an ArcGISorganizationPredominant category Estimated time: over 1 hourScenarioOfficials with both the Republican and theDemocratic national committees have contractedyou to provide them with a visual representationof the 2016 presidential election data. They wantto geographically and mathematically displaythe election results in various ways. You havecontracted to visualize the data using predominantmapping and a Z-Score.Account requiredVisualizing 2016 presidentialelection dataCategory compares attributes that share acommon subject and unit of measurement tosee which has the highest value. Color shows thepredominant category, and transparency showsthe relative strength of the predominance.1. Click the style icon under election 2016.2. Choose an attribute: % GOP.3. Add attribute.4. Choose an attribute % DEM.5. Choose Predominant Category.6. Click Options %GOP change to red.7. Click Options %DEM change to blue.1
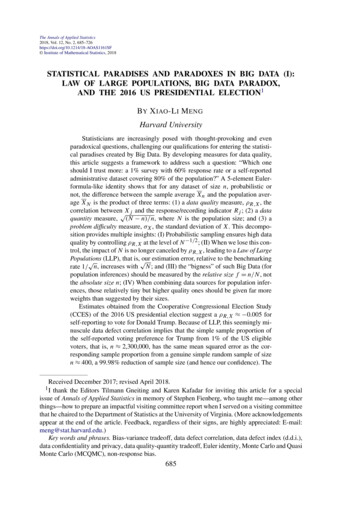
What does the map tell you about voting patternsin the 2016 presidential election?1. Select Category and Size.Category and size3. Click Specify size range.This type of predominant mapping is the same aspredominant mapping by category except that itadds the additional variable of size, showing thesum of the categories. With predominant mappingby category and size, you can show three variableson the map.4. Change the size to Min of 4 px and Max of15 px.2. Click Counts and Amounts OPTIONS.5. Click OK.6. Click DONE.2
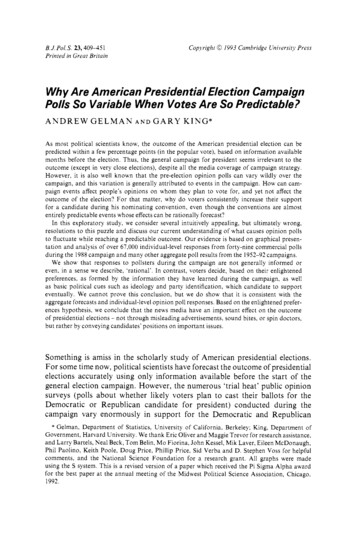
7. On the top tab, click Save As and save yourmap using the following metadata: Title: Presidential Election 2016Predominance yourinitials. Tags: IGARC2 election results. Summary: Visualization of presidentialelection 2016 results using predominantmapping.8. Click SAVE MAP.Z-ScoreA Z-Score is a numerical measurement of a value’srelationship to the average in a group of values. Ifa Z-score is 0, it represents the score is identical tothe average score. Z-Scores may also be positiveor negative, with a positive value indicatingthe score is above the average and a negativescore indicating it is below the average. Positiveand negative scores also reveal the number ofstandard deviations the score is either above orbelow the average. One standard deviation eitherplus or minus accounts for about 68 percent of thepeople, in this case representing 68 percent of thepeople either voted Democratic or Republican.How to calculate Z-Score of %DEM Data you want to examine (in this case, % Dem). Subtract the average of % DEM from % DEM. Divide the subtraction figure by the standarddeviation (% DEM – average)/standard deviation.3
1. Open Presidential Election 2016.2. On the top tab click Save As.4. When you display the Statistics write down theAverage and the Standard Deviation.3. Save using the following metadata: Title: Presidential Election 2016 Z-Scoreyourinitials. Tags: IGARC2 electionZ yourinitials. Summary: Presidential election resultsvisualized by Z-Score.4. Click SAVE MAP.Find the average and the standard deviation of%DEM calculate Z-Score1. Right click election 2016 and open theattribute table.5. Click CLOSE.2. Scroll right to the field % DEM.6. Click the style icon under election 2016.3. Right-click on %DEM and click Statistics.7. Scroll down and select New Expression.4
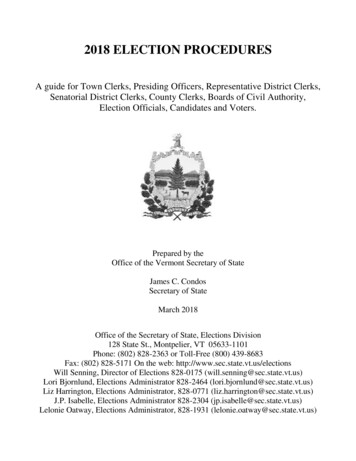
8. Click Edit and Name this Expression: Z-Score % DEM.9. Click Save.10. Type the following expression. Click Globals to display attributes.(( feature.DEM per)-0.3174)/0.152711. Click Save.12. Click Counts and Amounts (Color).13. Click OK.14. Click DONE.15. Click Options and change the name of the layer to Z-Score %DEM.16. Click OK.What does the Z-Score legend represent?How to calculate Z-Score of %GOP1. Right click and copy the Z-Score %DEM.2. Under Options rename the file Z-Score %GOP.Find the average and the standard deviation of %GOP calculate Z-Score3. Open the attribute table and click %GOP.4. Click Display Statistics.5. Record the Average and the Standard Deviation.6. Click Add attribute.5
7. Select another New Expression and title itZ-Score GOP.8. Type the following expression:(( feature.GOP per)-0.6354)/0.15599. Click OK.10. Click Counts and Amounts (Color).11. Click OK.You can visualize these by turning the layers onand off.13. Click Save.In this exercise, you have visualized thepresidential election data in 2016 by predominantmapping and Z-Score. You have madeobservations about the spatial distribution of thepolitical parties’ voting preferences on your map.12. Click DONE.6
Visualizing election 2016 data using predominant mapping Visualizing election 2016 data with calculated Z-Score Using Arcade expressions What you need User, Publisher, or Administrator role in an ArcGIS organization Estimated time: over 1 hour Scenario Officials with both the Republican and the Democratic national committees have contracted