Transcription
Attack Graphs for Sensor Placement,Alert Prioritization, and Attack ResponseSteven Noel and Sushil JajodiaCenter for Secure Information SystemsGeorge Mason University, Fairfax, VirginiaAbstractWe describe the optimal placement of intrusion detection system (IDS) sensors andprioritization of IDS alarms, using attack graph analysis. Our attack graphs predict the variouspossible ways of penetrating a network to reach critical assets. In particular, automated analysisof network configuration and attacker exploits provides an attack graph showing all possiblepaths to critical assets. We then place IDS sensors to cover all these paths, using the fewestnumber of sensors. The sensor-placement problem we pose is an instance of the NP-hardminimal set cover problem, which we solve through a greedy algorithm. Through our approach,all traffic along vulnerable paths to critical resources is monitored, with no deployment ofunnecessary sensors. Then, through our predictive vulnerability-based attack graphs, weprioritize IDS alarms based on their level of threat (attack graph distance) to critical assets. Thepredictive power of our attack graphs then provides the necessary context for appropriate attackresponse.1. IntroductionIn traditional network defense, IDS sensors are placed at network perimeters, and configuredto detect every attempt at intrusion. But if an attacker manages to avoid detection at theperimeter, and gain a toehold into the network, his traffic on the internal network is unseen at theperimeter. Also, in today’s highly distributed grid computing, network boundaries are no longerclear. Organizations have a desire to detect malicious traffic throughout their network, but mayhave limited resources for IDS sensor deployment. Moreover, IDS usually report all potentiallymalicious traffic, without regard to the actual network configuration, vulnerabilities, and missionimpact. Given large volumes of network traffic, IDS with even small error rates can overwhelmoperators with false alarms. Even when true intrusions are detected, the actual mission threat isoften unclear, and operators are unsure as to what actions they should take.To address these weaknesses, we focus on protecting the network assets that are missioncritical. By analyzing the network configuration, including topology, connectivity limitingdevices such as firewalls, vulnerable services, etc., and matching it to known attacker exploits,we create a map of all possible attack paths through the network leading to compromise ofmission-critical assets. This map (organized as an attack graph) provides the requirements forplacing sensors within the attack paths to mission-critical assets. In this way, all potentiallymalicious activity on critical paths is monitored. Conversely, no sensors are needed formonitoring traffic that does not lie on critical paths, helping to reduce costs and operatoroverload. In particular, our approach places sensors to cover all attack paths to critical assets,using the fewest number of deployed sensors.Further, through the predictive power of attack graphs using known network vulnerabilities,we prioritize IDS alarms based on the level of threat they represent to critical assets. Forexample, we can give lower priority to alarms that lie outside critical attack paths. Particularly1
severe threats are those seen as coordinated steps as an attacker incrementally advances throughthe network, especially if only a short distance from mission-critical assets. Further, the attackgraph provides the context needed for responding to an attack. When an operator has strongevidence (e.g., multiple coordinated steps) of an intrusion, and knows the next networkvulnerabilities the attacker could exploit next, he has confidence in taking the appropriate (andhighly focused) actions for preventing further penetration.2. Previous WorkOne possible approach for automatic generation of attack graphs is to apply general-purposesymbolic model checking tools [1][2]. But model checkers have significant scalability problems,a consequence of the exponential complexity of the general state space they consider. Earlygraph-based approaches for analyzing attack combinations generally suffered the sameexponential state space problem [3][4]. Subsequently, scalable attack graph models based onmonotonic logic have emerged [5][6], as well as more efficient representations for fullyconnected sub-graphs [7]. These advances help make automatic attack graph generation feasiblefor realistic sized networks. A review of various approaches to attack graph analysis is givenin [8].Initial applications of attack graphs focused on analyzing vulnerability to potential attacks.Attack graphs have subsequently been applied to IDS alert correlation [9]. Attack graphs areparticularly powerful when predicted paths (based on vulnerabilities) are matched with actualdetected attacks [10][11][12]. This helps eliminate false positives, enables prediction of missingalarms, makes alarm correlation faster, and provides the context for attack response.Still, while integration of IDS alarms with predicted attack graphs has been proposed, a keystep is missing, i.e., the actual placement of IDS sensors to cover the attack graphs. When IDSsensor placement is addressed in the literature, it is usually in the context of general architecturesfor distributed intrusion detection, such as [13]. At least one author has applied network attackmodeling for sensor placement [14], using logic programming (Prolog) for system prototyping.In our approach, we place alarms so as to cover all known paths of vulnerability potentiallyleading to compromise of critical network assets, based on comprehensive attack graph models.Our sensor placement is optimal, in that only a minimum number of sensors are needed. Then,once sensors are deployed, we use our predictive attack graph to prioritize the resulting alarmsaccording to distance from critical assets.3. System OverviewOur approach is to capture the network configuration, from which we predict attack pathsthrough the network, and use the predicted paths for sensor placement, alarm prioritization, andattack response. As shown in Figure 1, we scan the network to discover hosts, their operatingsystem, application programs, and vulnerable network services. We also capture networkconnectivity, including the effects of devices such as firewalls and router access control lists(ACLs). With the resulting network model, a database of modeled attacker exploits, and aspecification of threat origin and critical network assets, we compute an attack graph, asdescribed in. This graph, computed in worst-case quadratic time [6], comprises all knownattacks through the network.2
esponseNetworkFigure 1: System for placing IDS sensors, prioritizing alerts, and responding to attacks.As we describe in the next section (Section 4), the attack graph guides the placement of IDSsensors, for monitoring attacks against known vulnerabilities. In fact, our sensor placementsolution is optimal, in the sense that the attack graph is entirely covered, using the fewestpossible sensors. We then use the attack graph to correlate and prioritize any resulting IDSalarms, based on attack proximity to critical network assets, and to formulate optimal attackresponses, as described in Section 5.4. Optimal Sensor PlacementThe problem we address is the following. Given the network configuration andvulnerabilities, where should we place IDS sensors so as to monitor all attack paths to criticalnetwork assets? Moreover, what placement will cover all critical paths with the fewest numberof sensors?For such optimal placement of sensors, we must first discover all attack paths to criticalassets, i.e., the attack graph. These critical paths will define the sources and destinations oftraffic to be monitored. Then, through analysis of network topology, we can identify sensorlocations that cover the critical paths.Consider the network on the left side Figure 2. There are 8 subnets, with various hosts ineach subnet, and routers (and the internet backbone) providing connectivity among the subnets.There are vulnerabilities on many of the network hosts. Though not shown explicitly, assumethere are firewalls, router ACLs, etc. in place to limit connectivity and help protect the network.Still, vulnerabilities remain on the network, and many are related, giving an attacker new vantagepoints for launching attacks and further penetrating the network.3
NetworkAttackGraphFigure 2: Example network and a high-level summary of its attack graph.The right side of Figure 2 is a high-level overview of attacks through this network. Here, weassume that critical network assets reside in Subnet 3. The attack graph then shows all possiblepaths into Subnet 3, at the subnet-to-subnet level. Again, the attack graph is discovered throughexhaustive analysis of network vulnerabilities and their interdependencies. At the level of detailshown (on the right side of the figure), a subnet box represents the collection of machines in asubnet, and an arrow means there is at least one vulnerable connection from one subnet toanother. Of course, there may be much more connectivity through the network than shown in theattack graph, and many of these other connections may in fact be vulnerable to attack. But bydefinition the attack graph includes all paths leading to compromise of the given critical assets(in this case, in Subnet 3), so any other vulnerabilities can be safely ignored.Now, given the knowledge of critical paths through the network, we can analyze the networktopology for placing sensors to cover all paths. To minimize costs, we seek to cover all criticalpaths (the attack graph) using the least number of sensors. This optimal sensor placement is aninstance of the classical minimum set cover problem [15]. Finding such minimum cover is NPhard, so exhaustive search is needed for guaranteed optimal solutions. Fortunately, there is apolynomial-time greedy algorithm for minimum set cover that gives good results in practice.Consider Figure 3, which is taken from the example in Figure 2. Here, through the networktopology, we trace the routes of each subnet-to-subnet edge of the attack graph. For example,the vulnerable connections from Subnet 1 to Subnet 2 are shown as a red route, from Subnet 1 toSubnet 4 as a blue route, etc. The problem is then the selection of a minimum set of routers(sensors) that covers all the vulnerable connections in the attack graph.4
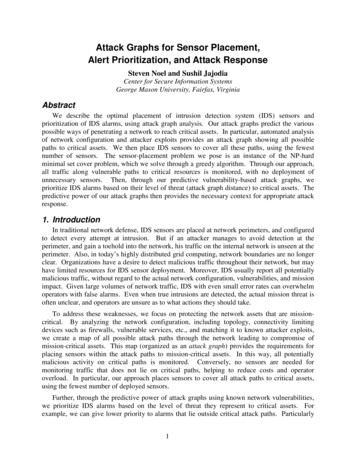
1 44 51 22 55 3Figure 3: Optimal sensor placement.The greedy algorithm for set covering follows this rule: at each stage, choose the set thatcontains the largest number of uncovered elements. In our case, the sets are defined by therouters along critical paths: Router A covers {(1,2), (1,4), (4,5)}Router B covers {(1,2), (4,5)}Router C covers {(1,2), (4,5), (2,5)}Router D covers {(2,5), (4,5), (5,3)}Here, the element (x, y) means vulnerable connections from Subnet x to Subnet y.A refinement of the greedy algorithm is to favor large sets that contain infrequent elements.In this example, Router A is a large set (3 elements) with the infrequent element (1,4), so wechoose it first. In the next iteration, we choose Router D, which has the largest number ofuncovered elements, i.e., (2,5) and (5,3). At this point, we have covered all 5 elements(vulnerable connections in the attack graph). Our sensor-placement solution is thus complete,shown in Figure 3 as red eyes at the optimal sensor locations (Router A and Router D).In this instance, we have in fact found the actual optimal solution. Indeed, for such a smallexample, we could easily solve it through exhaustive search. In general, the greedy algorithmwill do no worse than log(n) times the optimal solution, for n elements to be covered, though it5
usually does much better than this. Using appropriate data structures, the greedy algorithm canbe implemented in O(r), where r is the size of the input representation (number of elements overall input sets). Better solutions for set cover may be possible through more sophisticatedalgorithms (typically with longer run times), e.g., simulated annealing [16] and evolutionaryalgorithms [17].5. Alarm Prioritization and Attack ResponseOnce IDS sensors are in place and alarms are generated, we can use the attack graph tocorrelate alarms, prioritize them, predict future attack steps, and respond optimally. Figure 4shows attack graph details for the example in Figure 2, where edges are exploited vulnerabilitiesbetween machines. Paths in the graph all lead to specified critical assets (shown as crowns).Priority 4Priority 2Priority 3Priority 1Priority 0Figure 4: Priority of alarms via attack graph distance to critical assets.We can prioritize alarms based on attack graph distance to critical assets. That is, attackscloser to a critical asset are given higher priority, since they represent a greater risk. At any point6
that an attack is detected, we can use to graph to predict next possible steps, and take specificactions such as blocking specific source/destination machines and destination port.For example, in Figure 2, assume that the Priority-3 alert (within Subnet 2) is raised. At thatpoint, we know that the attacker could next move anywhere within Subnet 2, or could launch anattack from the victim machine against one particular machine in Subnet 5. Thus, to preventpenetration towards the given critical network assets, traffic could be blocked from the victimmachine to the Subnet-3 machine, for the specific ports corresponding to the two predictedexploits against it. This is the kind of highly focused attack response capability provided by ourpredictive attack graphs.6. SummaryIn our approach to network defense, we focus on critical paths through the network that leadto compromise of critical assets. This analysis supports optimal placement of IDS sensors,prioritization of alerts, and effective attack response. By analyzing the network configuration,assumed threat sources, and potential attacker exploits, we predict all possible ways of reachingcritical assets (the attack graph). We then place IDS sensors to cover all attack graph paths,using the fewest number of sensors necessary. We describe a greedy algorithm for the NP-hardsensor placement (set cover) problem, which we illustrate through example. We also prioritizethe resulting IDS alerts based on attack graph distance to critical assets and provide predictivecontext for attack response.AcknowledgementsThis material is based upon work supported by Homeland Security Advanced ResearchProjects Agency under the contract FA8750-05-C-0212 administered by the Air Force ResearchLaboratory/Rome; by Air Force Research Laboratory/Rome under the contract FA8750-06-C0246; and by Federal Aviation Administration under the contract DTFAWA-04-P-00278/0001.References1. R. Ritchey, P. Ammann, “Using Model Checking to Analyze Network Vulnerabilities,” inProceedings of the IEEE Symposium on Security and Privacy, Berkeley, California, 2000.2. O. Sheyner, J. Haines, S. Jha, R. Lippman, J. Wing, “Automated Generation and Analysis ofAttack Graphs,” in Proceedings of the IEEE Symposium on Security and Privacy, Oakland,California, 2002.3. D. Zerkle, K. Levitt, “Netkuang – A Multi-Host Configuration Vulnerability Checker,” inProceedings of the 6th USENIX Unix Security Symposium, San Jose, California, 1996.4. L. Swiler, C. Phillips, D. Ellis, S. Chakerian, “Computer-Attack Graph Generation Tool,” inProceedings of DARPA Information Survivability Conference & Exposition II, 2001.5. P. Ammann, D. Wijesekera, S. Kaushik, “Scalable, Graph-Based Network VulnerabilityAnalysis,” in Proceedings of 9th ACM Conference on Computer and CommunicationsSecurity, Washington, DC, 2002.6. S. Jajodia, S. Noel, B. O’Berry, “Topological Analysis of Network Attack Vulnerability,” inManaging Cyber Threats: Issues, Approaches and Challenges, V. Kumar, J. Srivastava, A.Lazarevic (eds.), Springer, 2005.7
7. S. Noel, S. Jajodia, “Managing Attack Graph Complexity through Visual HierarchicalAggregation,” in Proceedings of the ACM CCS Workshop on Visualization and Data Miningfor Computer Security, Fairfax, Virginia, 2004.8. R. Lippmann, K. Ingols, An Annotated Review of Past Papers on Attack Graphs, TechnicalReport ESC-TR-2005-054, MIT Lincoln Laboratory, 2005.9. P. Ning, Y. Cui, D. Reeves, “Constructing Attack Scenarios through Correlation of IntrusionAlerts,” in Proceedings of the 9th ACM Conference on Computer and CommunicationsSecurity, Washington DC, 2002.10. S. Noel, E. Robertson, S. Jajodia, “Correlating Intrusion Events and Building AttackScenarios through Attack Graph Distances,” in Proceedings of the 20th Annual ComputerSecurity Applications Conference, Tucson, Arizona, 2004.11. S. Noel, M. Jacobs, P. Kalapa, S. Jajodia, “Multiple Coordinated Views for Network AttackGraphs,” in Proceedings of the Workshop on Visualization for Computer Security,Minneapolis, Minnesota, 2005.12. S. Noel, S. Jajodia, “Understanding Complex Network Attack Graphs through ClusteredAdjacency Matrices,” in Proceedings of the 21st Annual Computer Security ApplicationsConference, Tucson, Arizona, 2005.13. C. Clark, W. Lee, D. Schimmel, D. Contis, M. Koné, A. Thomas, “A Hardware Platform forNetwork Intrusion Detection and Prevention,” in Proceedings of 3rd Workshop on NetworkProcessors & Applications, Madrid, Spain, 2004.14. M. Rolando, M. Rossi, N. Sanarico, D. Mandrioli, “A Formal Approach to Sensor Placementand Configuration in a Network Intrusion Detection System,” in Proceedings of the ACMInternational Workshop on Software Engineering for Secure Systems, Shanghai, China, 2006.15. T. Cormen, C. Leiserson, R. Rivest, C. Stein, Introduction to Algorithms, 2nd Edition, MITPress and McGraw-Hill, 2001.16. S. Skiena, The Algorithm Design Manual, Springer-Verlag, 1997.17. R. Kalapala, M. Pelikan, A. Hartmann, Hybrid Evolutionary Algorithms on Minimum VertexCover for Random Graphs, MEDAL Report No. 2007004, University of Missouri–St. Louis,2007.8
Initial applications of attack graphs focused on analyzing vulnerability to potential attacks. Attack graphs have subsequently been applied to IDS alert correlation [9]. Attack graphs are particularly powerful when predicted paths (based on vulnerabilities) are matched with actual detected attacks [10][11][12].