Transcription
WHITE PAPERData Visualization TechniquesTitle From Basics to Big Data With SAS Visual Analytics
iiContentsIntroduction .1What Is Data Cardinality? .2Tips to Get Started .2The Basics: Charting 101 .2Line Charts .2Bar Charts .3Scatter Plots .4Bubble Plots: A Scatter Plot Variation .5Pie and Donut Charts .6Visualizing Big Data .7Handling Large Data Volumes .7Visualizing Semistructured and Unstructured Data UsingWord Clouds and Network Diagrams .9Visualization With Correlation Matrices . 10Filtering Big Data . 12Data Visualization Made Easy With Autocharting . 12See Into the Future With Automated Forecasting Techniques . 13Understanding Influence With Decision Trees . 15Use Location Analytics to Augment Geo Maps. 16Improve Employee Collaboration With Visualization onMobile Devices . 17Conclusion . 18Learn More About SAS Visual Analytics. 18
1IntroductionA picture is worth a thousand words – especially when you are trying to understand anddiscover insights from data. Visuals are especially helpful when you’re trying to find relationships among hundreds or thousands of variables to determine their relative importance – or if they are important at all.Organizations generate and collect data each minute. Everyone – from executives anddepartmental decision makers to analysts, call center workers and production lineemployees – hopes to learn things from those diverse sets of data that can help themmake better decisions, take smarter actions and operate more efficiently.Regardless of how much data you have, one of the best ways to discern important relationships is through advanced analysis and easy-to-understand visualizations. You don’twant to miss a significant correlation or draw an incorrect conclusion that couldadversely affect your decision making. When sophisticated analyses can be performedquickly, even immediately, the results can be presented in ways that are easy toconsume while allowing queries and exploration. Therefore, people across all levels inyour organization can dive deeper into data and use the insights for faster, more effective decisions.One of the easiest ways todiscern important relationships in data is throughadvanced analysis and easyto-understand visualizations.To create meaningful visuals of your data, there are some basics you should consider.Data size, data type and column composition play an important role when selectinggraphs to represent your data. This paper discusses some basic issues of data visualization and provides suggestions for addressing them. In addition, big data brings aunique set of challenges. This paper covers some of those, as well as potentialsolutions.If you are working with massive amounts of data, one challenge is how to displayoutput in a way that’s not overwhelming. You may need to collapse and condense thedata but still provide graphs and charts that decision makers are accustomed to seeing.And, in today’s on-the-go society, visualizations must be delivered quickly to mobiledevices while giving people the ability to easily explore data on their own in real time.SAS Visual Analytics enables a broad range of business users to prepare, visuallyexplore and find valuable insights in data without coding or the need for data scienceskills. Intelligent autocharting creates the best possible visual based on the data that isselected. These data visualizations highlight relevant findings (such as clusters, exceptions, correlations or links in data) without requiring users to build or write algorithms.Smart visualizations also provide citizen data scientists and analysts with fast prototyping, and reduce the amount of time spent on manual, labor-intensiveexperimentation.This paper discussessome basic issues of datavisualization and providessuggestions for addressingthem.
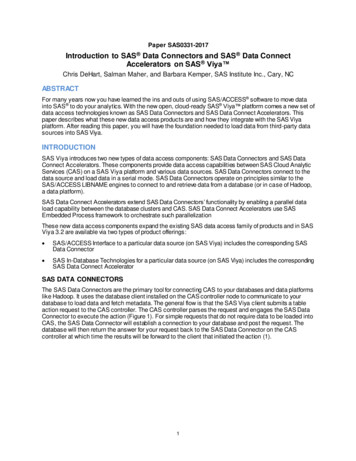
2The heart of SAS Visual Analytics is an in-memory, distributed processing engine thataccelerates analytical computations. The combination of powerful analytics and aneasy-to-use data exploration interface enables different types of users to create andinteract with graphs so they can get the most value from their data faster than ever. Thiscreates an unprecedented ability to identify the best opportunities, understand risks,improve business performance, promote collaboration and support better decisions.Tips to Get StartedIt’s a good idea to begin with a data visualization pilot program. Start small. Think abouta short list of business problems you want to solve, or identify a few new opportunities(e.g., segments) to investigate, or even use it to challenge your current interpretations.Here are a few basic concepts that can help you generate the best visuals for displayingyour data: Understand the data you are trying to visualize, including its size and cardinality, andconsider (honestly) the data preparation effort that will be required. Determine what you are trying to visualize and what kind of information you want tocommunicate. Know your audience and understand how it processes visual information. Use a visual that conveys the information in the best and simplest form for youraudience.The Basics: Charting 101Here is a quick guide to help you decide which chart type (or graph) to use for your data.Line ChartsLine charts show the relationship of one variable to another. They are most often usedto track changes or trends over time. Line charts are also useful when comparingmultiple items over the same time period. The stacking lines are used to compare thetrend or individual values for several variables (see Figure 1).You may want to use line charts when the change in a variable or variables clearly needsto be displayed and/or when trending or rate-of-change information is of value. It isalso important to note that you shouldn’t pick a line chart merely because you havedata points. Rather, the number of data points that you are working with may dictate thebest visual to use. For example, if you only have 10 data points to display, the easiestway to understand those 10 points might be to simply list them in a particular orderusing a table.When deciding to use a line chart, you should consider whether the relationshipbetween data points needs to be conveyed. If it does, and the values on the X axis arecontinuous, a simple line chart may be what you need.What Is DataCardinality?Cardinality is the uniqueness of data valuescontained in a column.High cardinality meansthere is a large percentageof unique values (e.g.,bank account numbers,because each itemshould be unique).Low cardinality means acolumn of data containsa large percentage ofrepeat values (such asa “gender” column).
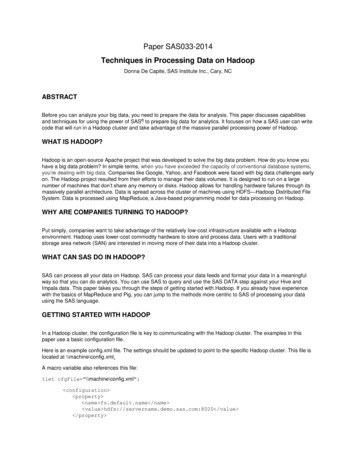
3Figure 1: Line charts show the relationship of one variable to another and are oftenused to track trends over time.Bar ChartsBar charts are most commonly used for comparing the quantities of different categoriesor groups. Values of a category are represented using the bars, and they can be configured with either vertical or horizontal bars, with the length or height of each bar representing the value.When values are distinct enough that differences in the bars can be detected by thehuman eye, you can use a simple bar chart. However, when the values (bars) are veryclose together or there are large numbers of values (bars) that need to be displayed, itbecomes more difficult to compare the bars to each other.To help provide visual variance, bars can have different colors. The colors can be usedto indicate such things as a particular status or range. Coloring the bars works bestwhen most bars are in a different range or status. When all bars are in the same rangeor status, the color becomes irrelevant, and it is most visually helpful to keep the colorconsistent or have no coloring at all.Another form of a bar chart is called the progressive bar chart, or waterfall chart. Awaterfall chart shows how the initial value of a measure increases or decreases during aseries of operations or transactions (see Figure 2). The first bar begins at the initial value,and each subsequent bar begins where the previous bar ends. The length and direction of a bar indicates the magnitude and type (positive or negative, for example) of theoperation or transaction. The resulting chart is a stepped cascade that shows how thetransactions or operations lead to the final value of the measure.Bar charts can be configured with either vertical orhorizontal bars, with thelength or height of each barrepresenting the value.
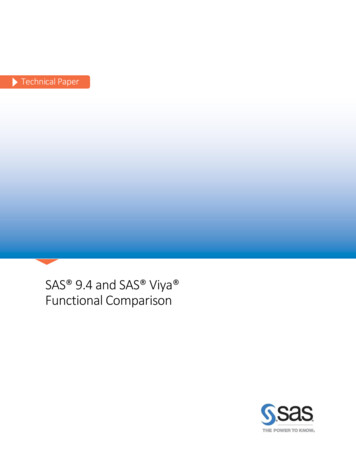
4Figure 2: One type of bar chart is called a waterfall chart. This one shows how theinitial value of a measure increases or decreases during a series of operations ortransactions.Scatter PlotsA scatter plot (or X-Y plot) is a two-dimensional plot that shows the joint variation of twodata items. In a scatter plot, each marker (symbols such as dots, squares and plus signs)represents an observation. The marker position indicates the value for each observation. Scatter plots also support grouping. When you assign more than two measures, ascatter plot matrix is produced. A scatter plot matrix is a series of scatter plots thatdisplays every possible pairing of the measures that are assigned to the visualization.Scatter plots are useful for examining the relationship, or correlations, between X and Yvariables. Variables are said to be correlated if they have a dependency on, or aresomehow influenced by, each other. For example, “profit” is often related to “revenue.”The relationship that exists might be that as revenue increases, profit also increases (apositive correlation). A scatter plot is a good way to visualize these relationships in data.In a scatter plot, you can also apply statistical analysis with correlation and regression.Correlation identifies the degree of statistical correlation between the variables in theplot. Regression plots a model of the relationship between the variables in the plot.Once you have plotted all of the data points using a scatter plot, you are able to visuallydetermine whether data points are related. Scatter plots can help you gain a sense ofhow spread out the data might be or how closely related the data points are, as well asquickly identify patterns present in the distribution of the data (see Figure 3). Scatterplots are helpful when you have many data points. If you are working with a small set ofdata points, a bar chart or table may be a more effective way to display the information.Scatter plots can help yougain a sense of how spreadout the data might be orhow closely related the datapoints are. They can alsoquickly identify patternspresent in the distribution ofthe data.
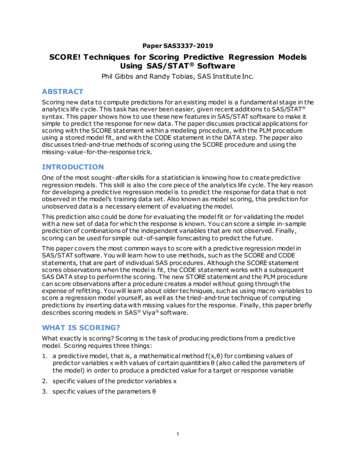
5Figure 3: A scatter plot is a good way to visualize relationships in data.Bubble Plots: A Scatter Plot VariationA bubble plot is a variation of a scatter plot in which the markers are replaced withbubbles. A bubble plot displays the relationships among at least three measures. Twomeasures are represented by the plot axes. The third measure is represented by thesize of the bubbles (see Figure 4). Each bubble represents an observation.A bubble plot is useful for data sets with dozens to hundreds of values or when the valuesdiffer by several orders of magnitude. You can use color to represent an additionalmeasure, and you can animate the bubbles to display changes in the data over time.A geo bubble map is a bubble plot that is overlaid on a geographic map. Each bubbleis located at a geographic location or at the center of a geographical region. A geobubble map requires a data item that contains geographical information and isassigned to a geography role.Figure 4: A bubble plot can be animated to show data changing over time.Bubble plots are a variationof scatter plots. They’reespecially useful for datasets with dozens tohundreds of values or whenthe values differ by severalorders of magnitude.
6Pie and Donut ChartsThere is much debate around the value of pie charts (and their more modern counterpart, donut charts), which are used to compare the parts of a whole. However, they canbe difficult to interpret because the human eye has a hard time estimating areas andcomparing visual angles. Another challenge with using this chart for analysis is that it isdifficult to compare slices, or sections, of the pie or donut that are similar in size but notlocated next to each other.If you do use thes
Visualizing Big Data . 7 Handling Large Data Volumes . 7 Visualizing Semistructured and Unstructured Data Using . data but still provide graphs and charts that decision makers are accustomed to seeing. And, in today’s on-the-go society, visualizations must be delivered quickly to mobile devices while giving people the ability to easily explore data on their own in real time. SAS .