Transcription
AN4544Application noteIGBT datasheet tutorialIntroductionThis application note is intended to provide detailed explanations about parameters anddiagrams included in the datasheet of trench-gate field stop IGBTs offered in discretepackages such as: TO-247, TO-220, D2PAK, etc. This document helps the user to betterunderstand the datasheet parameters and characteristics by explaining the interaction withthe influence of conditions as temperature or gate voltage.Thanks to this application note the designer can also use the information included indatasheet according to his needs.Datasheet values, for dynamic characterization tests, refer to a specific testing setup with itsindividual characteristics. Therefore, these values can vary according to the user'sapplication.Most of the included diagrams, tables and explanations are related to the STGW40V60DFdatasheet. Concerning the latest version of datasheet for this product, please refer to ourwebsite.September 2014DocID026535 Rev 11/35www.st.com
ContentsAN4544Contents1General IGBT overview . . . . . . . . . . . . . . . . . . . . . . . . . . . . . . . . . . . . . . . 61.12Datasheet explanation . . . . . . . . . . . . . . . . . . . . . . . . . . . . . . . . . . . . . . . 82.1Datasheet status . . . . . . . . . . . . . . . . . . . . . . . . . . . . . . . . . . . . . . . . . . . . 82.2IGBT nomenclature meaning . . . . . . . . . . . . . . . . . . . . . . . . . . . . . . . . . . . 82.3First page of datasheet . . . . . . . . . . . . . . . . . . . . . . . . . . . . . . . . . . . . . . . . 92.4Absolute maximum ratings . . . . . . . . . . . . . . . . . . . . . . . . . . . . . . . . . . . . . 92.52.62.72/35IGBT technology evolution . . . . . . . . . . . . . . . . . . . . . . . . . . . . . . . . . . . . . 72.4.1Collector-to-emitter voltage (VCES) . . . . . . . . . . . . . . . . . . . . . . . . . . . . . 92.4.2Continuous collector current rating (IC) . . . . . . . . . . . . . . . . . . . . . . . . . 102.4.3Forward biased safe operating area (FBSOA) . . . . . . . . . . . . . . . . . . . 132.4.4Peak of collector current ratings (ICP) . . . . . . . . . . . . . . . . . . . . . . . . . . 132.4.5Gate-to-emitter voltage (VGE) . . . . . . . . . . . . . . . . . . . . . . . . . . . . . . . . 142.4.6Maximum power dissipation (PTOT) . . . . . . . . . . . . . . . . . . . . . . . . . . . . 152.4.7Operating junction and storage temperature range (TJ) and (TSTG) . . . 152.4.8Thermal resistance (Rth) . . . . . . . . . . . . . . . . . . . . . . . . . . . . . . . . . . . . 152.4.9Maximum transient thermal impedance (ZthJC) . . . . . . . . . . . . . . . . . . . 16Static characteristics . . . . . . . . . . . . . . . . . . . . . . . . . . . . . . . . . . . . . . . . . 182.5.1Collector-to-emitter saturation voltage - VCE(sat) . . . . . . . . . . . . . . . . . . . . . . . . 192.5.2Forward on-voltage (VF) . . . . . . . . . . . . . . . . . . . . . . . . . . . . . . . . . . . . 202.5.3Collector cut-off current (ICES) . . . . . . . . . . . . . . . . . . . . . . . . . . . . . . . . 202.5.4Gate-to-emitter leakage current (IGES) . . . . . . . . . . . . . . . . . . . . . . . . . 212.5.5Gate-to-emitter threshold voltage (VGE(th)) . . . . . . . . . . . . . . . . . . . . . . 21Dynamic characteristics . . . . . . . . . . . . . . . . . . . . . . . . . . . . . . . . . . . . . . 212.6.1Input, output and reverse transfer capacitances (Cies), (Coes) and (Cres) .222.6.2Input capacitance (Cies) . . . . . . . . . . . . . . . . . . . . . . . . . . . . . . . . . . . . . 222.6.3Output capacitance (Coes) . . . . . . . . . . . . . . . . . . . . . . . . . . . . . . . . . . . 222.6.4Reverse transfer capacitance (Cres) . . . . . . . . . . . . . . . . . . . . . . . . . . . 232.6.5Gate charge (Qge), (Qgc) and (Qg) . . . . . . . . . . . . . . . . . . . . . . . . . . . . . 23IGBT switching characteristics (inductive load) . . . . . . . . . . . . . . . . . . . . 252.7.1Turn-on delay time (td(on)) . . . . . . . . . . . . . . . . . . . . . . . . . . . . . . . . . . . 272.7.2Current rise time (tr) . . . . . . . . . . . . . . . . . . . . . . . . . . . . . . . . . . . . . . . . 272.7.3Turn-on current (di/dt(on)) and voltage slope (dv/dt(on)) . . . . . . . . . . . . . 27DocID026535 Rev 1
AN45443Contents2.7.4Turn-off delay time (td(off)) . . . . . . . . . . . . . . . . . . . . . . . . . . . . . . . . . . . 272.7.5Fall time (tf) . . . . . . . . . . . . . . . . . . . . . . . . . . . . . . . . . . . . . . . . . . . . . . 272.7.6Switching energy (Eon) and (Eoff) . . . . . . . . . . . . . . . . . . . . . . . . . . . . . 272.7.7Short-circuit withstand time - tsc . . . . . . . . . . . . . . . . . . . . . . . . . . . . . . . 302.7.8Diode switching characteristics (inductive load) . . . . . . . . . . . . . . . . . . 31Revision history . . . . . . . . . . . . . . . . . . . . . . . . . . . . . . . . . . . . . . . . . . . 34DocID026535 Rev 13/3535
List of tablesAN4544List of tablesTable 1.Table 2.Table 3.Table 4.Table 5.Table 6.Table 7.Table 8.Table 9.Table 10.Table 11.Table 12.Table 13.4/35VCES maximum ratings showed in absolute maximum ratings . . . . . . . . . . . . . . . . . . . . . . 10Nominal continuous IC in absolute maximum ratings . . . . . . . . . . . . . . . . . . . . . . . . . . . . . 10Pulsed IC details in absolute maximum ratings. . . . . . . . . . . . . . . . . . . . . . . . . . . . . . . . . . 13VGE information showed in maximum ratings . . . . . . . . . . . . . . . . . . . . . . . . . . . . . . . . . . . 14IGBT total power showed in absolute maximum ratings. . . . . . . . . . . . . . . . . . . . . . . . . . . 15Ratings for storage and junction temperature in the table of absolute maximum ratings . . 15Absolute maximum ratings for J-C and J-A thermal resistances . . . . . . . . . . . . . . . . . . . . 16Static characteristics . . . . . . . . . . . . . . . . . . . . . . . . . . . . . . . . . . . . . . . . . . . . . . . . . . . . . . 18Dynamic characteristics . . . . . . . . . . . . . . . . . . . . . . . . . . . . . . . . . . . . . . . . . . . . . . . . . . . 21IGBT switching characteristics (inductive load) . . . . . . . . . . . . . . . . . . . . . . . . . . . . . . . . . 25Maximum ratings for short-circuit withstand time . . . . . . . . . . . . . . . . . . . . . . . . . . . . . . . . 30Diode switching characteristics (inductive load) . . . . . . . . . . . . . . . . . . . . . . . . . . . . . . . . . 31Document revision history . . . . . . . . . . . . . . . . . . . . . . . . . . . . . . . . . . . . . . . . . . . . . . . . . 34DocID026535 Rev 1
AN4544List of figuresList of figuresFigure 1.Figure 2.Figure 3.Figure 4.Figure 5.Figure 6.Figure 7.Figure 8.Figure 9.Figure 10.Figure 11.Figure 12.Figure 13.Figure 14.Figure 15.Figure 16.Figure 17.Figure 18.Figure 19.Figure 20.Figure 21.Figure 22.Figure 23.Figure 24.Figure 25.Figure 26.Figure 27.Figure 28.Figure 29.Figure 30.Figure 31.Figure 32.Figure 33.Figure 34.Cross section of a trench field-stop IGBT . . . . . . . . . . . . . . . . . . . . . . . . . . . . . . . . . . . . . . . 6Equivalent (a) and simplified equivalent circuits (b) . . . . . . . . . . . . . . . . . . . . . . . . . . . . . . . 7IGBT technology evolution . . . . . . . . . . . . . . . . . . . . . . . . . . . . . . . . . . . . . . . . . . . . . . . . . . 7Nomenclature scheme . . . . . . . . . . . . . . . . . . . . . . . . . . . . . . . . . . . . . . . . . . . . . . . . . . . . . 8Cover page . . . . . . . . . . . . . . . . . . . . . . . . . . . . . . . . . . . . . . . . . . . . . . . . . . . . . . . . . . . . . . 9Normalized V(BR)CES vs. junction (case) temperature . . . . . . . . . . . . . . . . . . . . . . . . . . . . 10How to calculate the continuous collector current using the output characteristic curve . . 11Collector current vs. case temperature . . . . . . . . . . . . . . . . . . . . . . . . . . . . . . . . . . . . . . . . 12Forward bias safe operating area . . . . . . . . . . . . . . . . . . . . . . . . . . . . . . . . . . . . . . . . . . . . 13IGBT transfer characteristics . . . . . . . . . . . . . . . . . . . . . . . . . . . . . . . . . . . . . . . . . . . . . . . 14Power dissipation vs. case temperature . . . . . . . . . . . . . . . . . . . . . . . . . . . . . . . . . . . . . . . 15Thermal resistance scheme . . . . . . . . . . . . . . . . . . . . . . . . . . . . . . . . . . . . . . . . . . . . . . . . 16Maximum normalized ZthJC function of pulse duty factor (d) and loading time (tp). . . . . . . 17Cross section of a trench field-stop IGBT . . . . . . . . . . . . . . . . . . . . . . . . . . . . . . . . . . . . . . 19Output characteristics . . . . . . . . . . . . . . . . . . . . . . . . . . . . . . . . . . . . . . . . . . . . . . . . . . . . . 20Forward on-voltage . . . . . . . . . . . . . . . . . . . . . . . . . . . . . . . . . . . . . . . . . . . . . . . . . . . . . . . 20Normalized VGE(th) vs junction temperature . . . . . . . . . . . . . . . . . . . . . . . . . . . . . . . . . . . . 21IGBT section and equivalent model with parasitic capacitances between terminals . . . . . 22STGW40V60DF capacitance variation . . . . . . . . . . . . . . . . . . . . . . . . . . . . . . . . . . . . . . . 23Gate charge . . . . . . . . . . . . . . . . . . . . . . . . . . . . . . . . . . . . . . . . . . . . . . . . . . . . . . . . . . . . 24Test circuit for switching characteristics (inductive load) . . . . . . . . . . . . . . . . . . . . . . . . . . 26Voltage turn-on and turn-off waveforms . . . . . . . . . . . . . . . . . . . . . . . . . . . . . . . . . . . . . . . 26Switching times vs. collector current. . . . . . . . . . . . . . . . . . . . . . . . . . . . . . . . . . . . . . . . . . 27Switching times vs. gate resistance . . . . . . . . . . . . . . . . . . . . . . . . . . . . . . . . . . . . . . . . . . 27Switching losses vs. collector current . . . . . . . . . . . . . . . . . . . . . . . . . . . . . . . . . . . . . . . . . 28Switching losses vs. gate resistance . . . . . . . . . . . . . . . . . . . . . . . . . . . . . . . . . . . . . . . . . 28Switching losses vs. junction temperature . . . . . . . . . . . . . . . . . . . . . . . . . . . . . . . . . . . . . 29Switching losses vs. collector- emitter voltage . . . . . . . . . . . . . . . . . . . . . . . . . . . . . . . . . . 29Short-circuit performance example . . . . . . . . . . . . . . . . . . . . . . . . . . . . . . . . . . . . . . . . . . . 30Typical reverse recovery waveform . . . . . . . . . . . . . . . . . . . . . . . . . . . . . . . . . . . . . . . . . . 32Reverse recovery current vs. diode current slope . . . . . . . . . . . . . . . . . . . . . . . . . . . . . . . 32Reverse recovery time vs. diode current slope. . . . . . . . . . . . . . . . . . . . . . . . . . . . . . . . . . 32Reverse recovery charge vs. diode current slope . . . . . . . . . . . . . . . . . . . . . . . . . . . . . . . 33Reverse recovery energy vs. diode current slope . . . . . . . . . . . . . . . . . . . . . . . . . . . . . . . 33DocID026535 Rev 15/3535
General IGBT overview1AN4544General IGBT overviewThe insulated-gate bipolar transistors (IGBTs) combine a MOS gate with high-current andlow-saturation-voltage capability of bipolar transistors as illustrated in Figure 1, and they arethe right choice for high-current and high voltage applications.IGBT and MOSFET operation is very similar. A positive voltage, applied from the emitter togate terminals, produces a flow of electrons toward the gate terminal in the body region. Ifthe gate to emitter voltage is equal or above the threshold voltage, electrons flow toward thegate to form a conductive channel across the body region, allowing current to flow from thecollector-to-emitter. (It allows electrons to flow from the emitter to the collector). This flow ofelectrons attracts holes, or positive ions, from the p-type substrate to the drift region towardthe emitter. The balance in trade-offs among switching speed, conduction loss, andruggedness is finely tuned and the latest technology, especially for high voltage ( 400 V)devices, improves speed and conduction so that IGBTs are overrun on the high frequencyapplication scenario, which was dominated by Power MOSFET. Figure 2 shows a series ofsimplified equivalent circuits for an IGBT.Figure 1. Cross section of a trench field-stop IGBT6/35DocID026535 Rev 1
AN4544General IGBT overviewFigure 2. Equivalent (a) and simplified equivalent circuits (b)D1.1EIGBT technology evolutionThe trench field-stop technology includes several benefits if compared to the planar PT(punch through). Implanted back-emitter and field-stop for a better control of the dynamicbehavior together with the introduction of the trench structure offer an improvedperformance like lower conduction and switching loss, much higher robustness and asignificant RTH reduction due to very thin die.Figure 3. IGBT technology evolutionDocID026535 Rev 17/3535
Datasheet explanationAN45442Datasheet explanation2.1Datasheet statusThe status of the product development can be: Target data Preliminary data Final dataTarget data describes the design goal of a future product to be developed. Values fromtarget datasheet are useful just for the initial calculations and approximations. Theinformation and values of a target datasheet cannot be guaranteed for the final product. Thedimensioning of an inverter should be only based on a preliminary or final datasheet.During the development phase, parts are labeled with the suffix "ES" and they are suppliedwith a special document. This kind of samples can be used for preliminary and functionaltests during the early stages of a product development phase. Samples marked as ES arenot liable to product change notification (PCN).Preliminary data is based on components whose manufacture is close to production. Thedifference between a preliminary and a final datasheet is that certain values are still missing,for example the maximum values. These missing values in the preliminary datasheet aremarked TBD to be defined. Reliability and lifetime are partly, but not finally approved.Final data is based on final components. Making is based on productive tooling for massproduction. Reliability and lifetime are approved and released. The final datasheet iscompleted with values which were missing in the preliminary datasheet. In case of majorchanges for products in production, a PCN has to be issued.2.2IGBT nomenclature meaningFigure 4. Nomenclature scheme8/35DocID026535 Rev 1
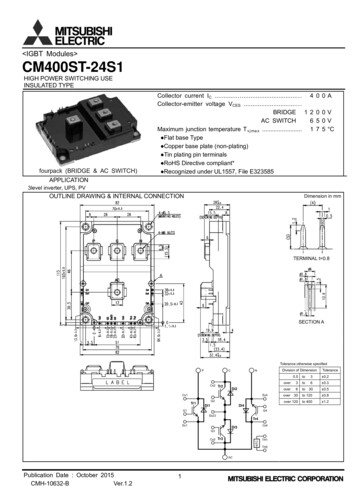
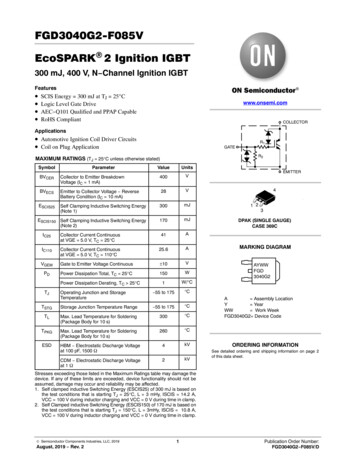
AN45442.3Datasheet explanationFirst page of datasheetThis section explains the electrical properties of IGBT products. Otherwise specified, valuesapply to a temperature of 25 C.Figure 5. Cover page67*): 9 ') 67*: 9 ') 67*:7 9 ')7UHQFK JDWH ILHOG VWRS ,*%7 9 VHULHV 9 YHU\ KLJK VSHHG'DWDVKHHW SURGXFWLRQ GDWD'DWDVKHHW VWDWXV)HDWXUHV 72 3)7 %3DFNDJH RSWLRQV 0D[LPXP MXQFWLRQ WHPSHUDWXUH 7- & 7DLO OHVV VZLWFKLQJ RII 9&( VDW 9 W\S # ,& 7LJKW SDUDPHWHUV GLVWULEXWLRQ 6DIH SDUDOOHOLQJ(OHFWULFDO IHDWXUHV /RZ WKHUPDO UHVLVWDQFH 9HU\ IDVW VRIW UHFRYHU\ DQWLSDUDOOHO GLRGH 72 372 )LJXUH ,QWHUQDO VFKHPDWLF GLDJUDP& 7 % SSOLFDWLRQV 3KRWRYROWDLF LQYHUWHUV 8QLQWHUUXSWLEOH SRZHU VXSSO\ :HOGLQJ 3RZHU IDFWRU FRUUHFWLRQ 9HU\ KLJK IUHTXHQF\ FRQYHUWHUV7\SLFDO DSSOLFDWLRQV'HVFULSWLRQ* 7KLV GHYLFH LV DQ ,*%7 GHYHORSHG XVLQJ DQ DGYDQFHG SURSULHWDU\ WUHQFK JDWH ILHOG VWRS VWUXFWXUH 7KH GHYLFH LV SDUW RI WKH 9 VHULHV RI ,*%7V ZKLFK UHSUHVHQW DQ RSWLPXP FRPSURPLVH EHWZHHQ FRQGXFWLRQ DQG VZLWFKLQJ ORVVHV WR PD[LPL]H WKH HIILFLHQF\ RI YHU\ KLJK IUHTXHQF\ FRQYHUWHUV )XUWKHUPRUH D SRVLWLYH 9&( VDWWHPSHUDWXUH FRHIILFLHQW DQG YHU\ WLJKW SDUDPHWHU GLVWULEXWLRQ UHVXOW LQ VDIHU SDUDOOHOLQJ RSHUDWLRQ ,QWHUQDO VFKHPDWLF( *HQHUDO SURGXFWGHVFULSWLRQ7DEOH 'HYLFH VXPPDU\2UGHU FRGH0DUNLQJ3DFNDJH67*): 9 ')*): 9 ')72 3)7XEH67*: 9 ')*: 9 ')72 7XEH67*:7 9 ')*:7 9 ')72 37XEH SULO 'RF,' 5HY 7KLV LV LQIRUPDWLRQ RQ D SURGXFW LQ IXOO SURGXFWLRQ 2.43DFNDJLQJ ZZZ VW FRPAbsolute maximum ratingsThey are the maximum values of current, voltage, temperature, power dissipation,recommended by manufacturers for their product type. To achieve reliable and long termoperation of a device, the device has to operate within these specified ratings.2.4.1Collector-to-emitter voltage (VCES)The continuous collector-to-emitter voltage (VCES) is the maximum voltage that thecollector-to-emitter junction can support at temperature of 25 C. Gate and emitter terminalsare shorted together.DocID026535 Rev 19/3535
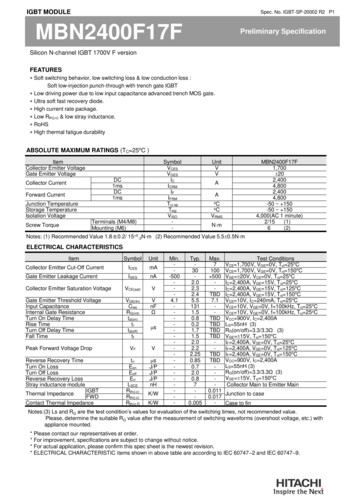
Datasheet explanationAN4544Table 1. VCES maximum ratings showed in absolute maximum mitter voltage (VGE 0)This value, in case of low temperature, decreases by a factor of approximately:Equation 1%BV CES 0.1 ------ Cwith a typical trend showed in the following figure.Figure 6. Normalized V(BR)CES vs. junction (case) temperatureAM17396v1V(BR)CES(norm)IC 2mA1.11.051.00.950.9-502.4.2050100150TJ( C)Continuous collector current rating (IC)Nominal continuous collector current (IC) can flow through the device while the casetemperature (TC) is held at the specified level, with the junction temperature rising to itsmaximum ratings due to the dissipated power of the device.Table 2. Nominal continuous IC in absolute maximum ratingsSymbolParameterUnitICContinuous collector current at TC 25 C80AICContinuous collector current at TC 100 C40AThe formula for the calculated collector current (IC) is the following:10/35ValueDocID026535 Rev 1
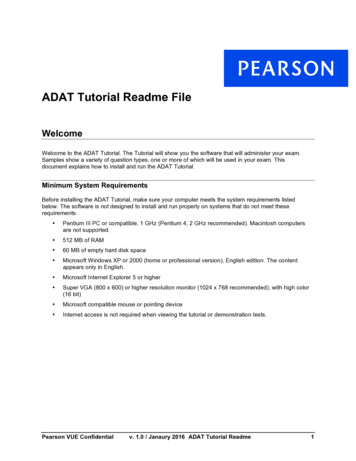
AN4544Datasheet explanationEquation 2TJmax – TCP TOT ----------------------------- V CE ICR th ( J – C )Figure 7. How to calculate the continuous collector current using the outputcharacteristic curveEquation 3ΔV CER CEO --------------ΔI CEquation 4ICTJmax – TC2– V CEO V CEO 4 R CEO ----------------------------- R TH ( JC ) -----------------2 RCEOFurthermore, power dissipation and continuous collector current are both reported in thedatasheet as function of the case temperature (TC).DocID026535 Rev 111/3535
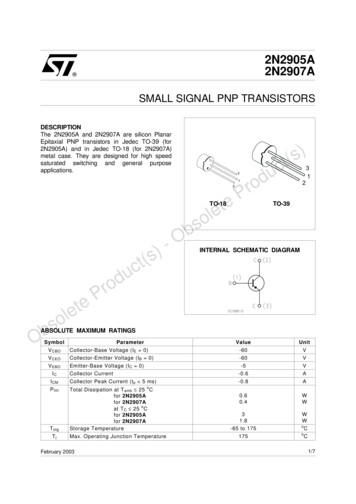
Datasheet explanationAN4544Figure 8. Collector current vs. case temperatureAM17386v1IC (A)VGE 15 V, TJ 175 C80706050403020100012/35255075 100 125 150 175DocID026535 Rev 1TC( C)
AN45442.4.3Datasheet explanationForward biased safe operating area (FBSOA)This shows the collector current IC as a function of the collector-emitter voltage VCE atdifferent pulses.Figure 9. Forward bias safe operating areaAM17392v1IC (A)(b)100(a)10μs(c)10100μs1ms10.1Single pulse, Tc 25 CTj 175 C, VGE 15V(d)0.0112.4.410100VCE(V)a)This area is limited by the conduction loss VCE(sat) at maximum junctiontemperature.b)The top limit is related to the maximum pulsed collector current.c)This area depends on the pulse length of the applied power pulse, the thermalimpedance changes and leads to different maximum power losses. For a givenpulse length, the thermal impedance ZthJC has to be determined by looking at thespecific diagram.d)The maximum breakdown voltage V(BR)CES is determined by the technology andlimits the diagram on the right-hand side.Peak of collector current ratings (ICP)These ratings indicate how much pulsed current the device can handle, which issignificantly higher than the rated continuous current.Table 3. Pulsed IC details in absolute maximum ratingsSymbolICP(1)ParameterPulsed collector currentValueUnit160A1. Pulse width limited by maximum junction temperature.The purposes of ICP ratings are: Keeping IGBT operating conditions in the “linear” region of its transfer characteristic(see Figure 10). There is a maximum collector current for a respective gate-emittervoltage that the IGBT conducts. If the operating point at a given gate-emitter voltageDocID026535 Rev 113/3535
Datasheet explanationAN4544goes above the linear region, the result is a significant collector-emitter voltage rise andconsequent rise of conduction loss and possible device destruction. Preventing burnout or latchup. Although the pulse width is theoretically too short tooverheat the die, exceeding the ICP ratings can cause burnout or latchup. Preventing the die overheats. The note 1 implies that ICP is based on a thermallimitation depending on the pulse width. This is always true for two reasons: –There is some margin in the ICP ratings–Whatever the failure mechanism is, overheating is the observed end resultAvoid excessive current through the bond wiresFigure 10. IGBT transfer characteristicsRegarding ICP thermal limitation, the temperature rise depends on the pulse width, timeamong pulses, heat dissipation, and VCE(sat) as well as the shape and magnitude of thecurrent pulse. Remaining within ICP limits does not assure that the maximum junctiontemperature is not exceeded.2.4.5Gate-to-emitter voltage (VGE)Table 4. VGE information showed in maximum ratingsSymbolVGEParameterGate-emitter voltageValueUnit 20VVGE stands for the allowable range voltage between the gate and emitter terminals.Exceeding VGE range may result in permanent device degradation due to oxide breakdownand dielectric rupture. Remaining within these ratings assures application reliability. Thisvalue, with reasonable guard band, is 100% tested and warranted.14/35DocID026535 Rev 1
AN45442.4.6Datasheet explanationMaximum power dissipation (PTOT)Table 5. IGBT total power showed in absolute maximum ratingsSymbolPTOTParameterTotal dissipation at TC 25 CValueUnit283WEquation 5T Jmax – T CP TOT ----------------------------R th ( J – C )The maximum power dissipation is related to a given case temperature (TC), the maximumjunction temperature (TJ) and the thermal resistance (RTH(J-C)).Figure 11. Power dissipation vs. case temperatureAM17385v1Ptot(W)VGE 15 V, TJ 175 C25020015010050002.4.7255075 100 125 150 175 TC( C)Operating junction and storage temperature range (TJ) and (TSTG)Table 6. Ratings for storage and junction temperature in the table of absolutemaximum ratingsSymbolTSTGTJParameterValueUnitStorage temperature range- 55 to 150 COperating junction temperature- 55 to 175 CThese limits are set to assure an acceptable lifetime of the product. Operating out of thetemperature limits could damage the device affecting its lifetime. A reduction of operatingjunction temperature, every 10 C doubles the device lifetime.2.4.8Thermal resistance (Rth)Thermal resistance relates to the heat conduction properties of the device (temperature perunit of power, C/W). Rth can be described as follows:DocID026535 Rev 115/3535
Datasheet explanationAN4544Rth(JC): thermal resistance from the device junction to the device case. It is the thermalresistance when the package is mounted on the infinite heatsinkRth(CH): the contact thermal resistance between the device case and the heatsinkRth(HA): thermal resistance from the heatsink to ambientFigure 12. Thermal resistance schemeThe thermal resistance stated in datasheet refers to the above mentioned RTH(J-C) and tothe overall RTH(J-A).Table 7. Absolute maximum ratings for J-C and J-A thermal resistancesSymbolParameterValueUnitRthJCThermal resistance junction-case IGBT0.53 C/WRthJCThermal resistance junction-case diode1.14 C/WRthJAThermal resistance junction-ambient50 C/WEquation 6R th ( j – a ) R th ( j – c ) R th ( c – h ) R th ( h – a )2.4.9Maximum transient thermal impedance (ZthJC)Transient thermal impedance takes into account the heat capacity of the device to estimatetemperatures resulting from power loss on transient base.16/35DocID026535 Rev 1
AN4544Datasheet explanationFigure 13. Maximum normalized ZthJC function of pulse duty factor (δ) and loadingtime (tp)ZthTO2T BKδ 0.50.20.10.05-1100.02Zth k Rthj-cδ tp/t0.01Single pulsetpt-210 -510-410-310-210-110tp (s)Figure 13 shows the variation of the normalized thermal impedance for the specified pulseduty factor δ tp/t as a function of the loading time tp (pulse width).The dissipated heat has to pass through several different layers with their thermalresistances and thermal capacitances. Therefore, according to the pulse length, either thethermal resistance or the thermal capacitance handle with the device’s behavior. Theincrease of the junction temperature can be calculated as follows: TJstart TC:Equation 7T j T Jstart ΔT j T Jstart Z thJc ( tp ,δ ) P tot TJstart k ( t p ,δ ) R thJc P totDocID026535 Rev 117/3535
Datasheet explanation2.5AN4544Static characteristicsThese describe the behavior of the device in steady-state conditions either in the off-state orin conduction.Table 8. Static characteristicsSymbolParameterTest conditionsCollector-emitterV(BR)CES breakdown voltage(VGE 0)IC 2 mAMin.VF18/35UnitV1.8VGE 15 V, IC 40 ACollector-emitter saturationTJ 125 CvoltageVGE 15 V, IC 40 ATJ 175 CForward on-voltageMax.600VGE 15 V, IC 40 AVCE(sat)Typ.2.32.15V2.35IF 40 A1.7IF 40 A, TJ 125 C1.4VIF 40 A, TJ 175 C1.3VVGE(th)Gate threshold voltageVCE VGE, IC 1 mAICESCollector cut-off current(VGE 0)IGESGate-emitter leakagecurrent (VCE 0)6V7VVCE 600 V25µAVGE 20 V250nADocID026535 Rev 152.45
AN45442.5.1Datasheet explanationCollector-to-emitter saturation voltage - VCE(sat)VCE(sat) is the on-state collector-to-emitter voltage drop and represents the IGBT powerdissipation during conduction time. This voltage is a function of collector current (IC) gateemitter voltage (VGE) and junction temperature (TJ) and so it is specified at the rated IC,VGE 15 V and TJ 25 C, 125 C and 175 C. The IGBT is used as a switch and the rangeof VCE is within the saturation region. Increasing VGE rises the channel conductivity andreduces VCE(sat), while increasing the collector current also increases the VCE(sat).Figure 14. Cross section of a trench field-stop IGBTFrom the equivalent circuit, VCE(sat) is given by:Equation 8V CE ( sat ) VBE ( PNP ) IMOS ( R S R CH )where: VBE(PNP) is the base-emitter voltage of PNP transistor (see Figure 16) IMOS is the drain current of the Power MOSFET RS is the resistance of the conductivity modulated n-region RCH is the channel resistance of the Power MOSFETFurthermore VCE(sat) is temperature sensitive and decreases according to the temperaturerise (negative temperature coefficient) until a certain crossover point is reached, after whichVCE(sat) begins increasing (positive temperature coefficient).DocID026535 Rev 119/3535
Datasheet explanationAN4544Figure 15. Output characteristicsVDWIf crossover point is well below IC operation range (like the STGW40V60DF), the IGBT has apositive temperature coefficient.This crossover point is a function of device’s geometry.2.5.2Forward on-voltage (VF)Diode forward voltage is specified under the maximum IF (diode continuous forward current@ TC 100 C) and at case temperatures of 25 C and 100 C.Figure 16. Forward on-voltage2.5.3Collector cut-off current (ICES)This is the leakage current flowing from collector-to-emitter when the device is off, at aspecified collector-to-emitter and gate-emitter voltage. This parameter is a function of VCESand TJ. ICES increases basing on VCES and TJ rise.20/35DocID026535 Rev 1
AN45442.5.4Datasheet explanationGate-to-emitter leakage current (IGES)This is the gate-emitter leakage current specified at the recommended gate-emitter voltage(VGE) with collector-emitter shorted (VCE 0) and TJ 25 C.2.5.5Gate-to-emitter threshold voltage (VGE(th))This is the minimum gate to emitter voltage required to turn on the IGBT at specified IC andVCE.VGE(th) limits are indicated in Table 8 and to turn on IGBT a higher voltage than VGE(th) hasto be applied.The following diagram shows the variation of the normalized threshold versus temperatureFigure 17. Normalized VGE(th) vs junction temperatureAM17395v1VGE(th)(norm)VCE VGEIC 1mA1.00.90.80.70.6-50050100150TJ( C)The VGE(th) value decreases by a factor of approximately: -2.2 mV/ C.2.6Dynamic characteristicsTable 9. Dynamic characteristicsSymbolParameterCiesInput capacitanceCoesOutput capacitanceCresReverse transfercapacitanceQgTotal gate chargeTest conditionsVCE 25 V, f 1 MHz,VGE 0VCC 480 V, IC 40 A,VGE 15 VQgeGate-emitter chargeQgcGate-collector chargeDocID026535 Rev nC-95-nC21/3535
Datasheet explanation2.6.1AN4544Input, output and reverse transfer capacitances (Cies), (Coes) and (Cres)IGBT dynamical characteristics are influenced by parasitic capacitances. The typical valuesof the capacitance are measured under specific conditions: VCE 25 V, f 1 MHz andVGE 0 V, and its decrease is inversely proportional to the biased voltage introduced in thecollector-to-emitter.Figure 18. IGBT section and equivalent model with parasitic capacitances betweenterminals2.6.2Input capacitance (Cies)This is the input capacitance measured between the gate and emitter terminals with thecollector shorted to the emitter for AC signals. Cies is given by the gate to collectorcapacitance (CGC) in parallel with the gate to emitter capacitance (CGE):Equation 9C ies C GE C GCThe input capacitance has to be charged to the threshold voltage before the device beginsto turn on, and discharged to the plateau voltage before the device begins to turn off.Therefore both the impedance of the drive circuitry and Cies, have a direct relationship to theturn on and turn off delays.2.6.3Output capacitance (Coes)This is the output capacitance measured between the collector and emitter terminals withthe gate shorted to the emitter for AC voltages. Coes is given by the collector-to-emittercapacitance (CCE) in parallel with the gate to collector capacitance (CGC):Equation 10C oes C CE C GCFor soft switching applications, Coes can affect the resonance of the circuit.22/35DocID026535 Rev 1
AN45442.6.4Datasheet explanationReverse transfer capacitance (Cres)This is the reverse transfer capacitance measured between the collector and gate terminal
IGBT datasheet tutorial Introduction This application note is intended to provide detailed explanations about parameters and diagrams included in the datasheet of trench-gate field stop IGBTs offered in discrete packages such as: TO-247, TO-220, D2PAK, etc. This document helps the user to better