Transcription
ANSYS Workbench SoftwareRELEASE 11 -PurdueUniv.IndianapolisDelphiElectronics& www.schroffeurope.com
6CopyrightedMaterialIntroduction to FiniteElement SimulationCopyrightedMaterialHistorically, finite element modeling tools were only capable of solving the simplestengineering problems which tended to reduce the problem to a manageable size andscope. These early FEA tools could generally solve steady-state, linear problems intwo dimensions. The factors that forced these simplifications were lack of efficientcomputational techniques and the computing power to model more complex real-lifeproblems.As numerical computation techniques have advanced and computing power hasincreased, analysis tools have also advanced to solve more complex problems. Areal-life engineering problem may involve different physics such as fluid flow, heattransfer, electromagnetism and other factors. The finite element method has beenused to solve engineering problems in all of these areas successfully and the goal ofmost software developers is to include as much of the real-world in the simulationthey perform as possible.CopyrightedMaterialHowever, in many situations, use of simplifying assumptions such as symmetry,axisymmetry, plane stress, plane strain, etc., is still preferable to using a completethree dimensional model because of the efficiency they provide. These assumptionsshould be used if the problem being solved requires it. In other words, there is noneed or justification to perform a full three dimensional analysis if symmetry ispresent in the problem being solved.The ANSYS philosophy can be summarized as one that aims to simulate the completereal-life engineering problem. The simulation usually begins by using a threedimensional CAD model to construct a finite element mesh followed by imposingloads and boundary conditions and then computing the solution to the finite elementproblem.CopyrightedMaterial
6-2ANSYS Workbench Software TutorialCopyrightedMaterial6.1 Steps required to solve a problemIn general you follow the same steps to perform a finite element analysis. However,it is important to note that it is possible to use Workbench to perform a large numberof different analysis types. These analysis types may include various material nonlinearities, transient loads, rigid body dynamics, etc. which may require additionalsteps to be performed. The steps described below are aimed at solving a static,linear stress, heat transfer or free vibration analysis. Also remember that thefollowing steps are performed in the Simulation application of Workbench.1.2.3.4.5.6.7.8.Attach to geometryDefine/Assign material propertiesDefine the analysis typeSet loading and boundary conditionsRequest resultsSolveReview the resultsGenerate a reportCopyrightedMaterialBelow is a brief explanation of each step.1. Attach to geometry. In this step you identify the geometry (CAD) model thatwill be used in your simulation. The model may have been created inDesignModeler or in some other CAD tool.2. Define/Assign material properties. In this step you specify the type ofmaterial each part of your model is made of. You can assign material types froma small database supplied with Workbench or if the material is not in thedatabase you must define it using the Engineering Materials application.3. Define the analysis type. In this step you set the type of analysis you will beperforming such as Static Structural, Modal or Steady-state heat transfer.4. Set loading and boundary conditions. In this step you specify how yourmodel is constrained and what loads are acting on it.5. Request results. In this step you specify the results quantities that you want tosee once the problem has been solved.6. Solve. In this step you request that Simulation solve the problem you havedefined and compute the results you requested.7. Review the results. In this step you review the analysis results that yourequested in step 5.8. Generate a report. This step is optional but is recommended. In this step yougenerate an HTML report which includes the inputs to your simulation, the resultsand any comments you want to add. You can publish the report or e-mail it invarious formats.CopyrightedMaterialCopyrightedMaterial
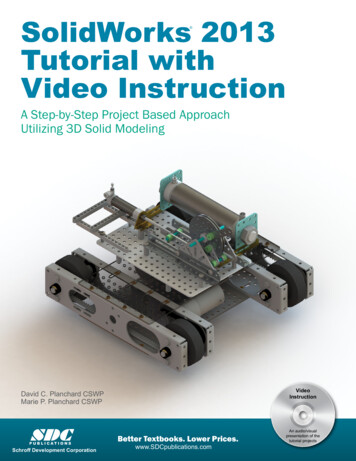
Introduction to Finite Element Simulation6-3CopyrightedMaterial6.2 Tutorial 6 1 – 4”x1”x1” 3-D cantilevered beamIn this tutorial you will create a cantilevered beam, and perform a stress analysisafter constraining it and loading it with a 500lb load. The beam is 4 inches long andhas a 1 inch square cross-section.CopyrightedMaterialManual calculation of the deflection at the end of the cantilevered beam can be doneusing the following formula introduced in strength of materials courses: δ (PL3)/(3EI), along with an additional term that takes into account the deflection dueto shear (6PL)/(5AG). Although the deflection due to shear for the cantileveredbeam is small, we will include it here for sake of completeness1. Since the beam ismade of structural steel, we will be using a modulus of elasticity E 29,007,557psi,and determining the shear modulus, from the formula G E/(2 (1 µ) ) 11,156,753psi (based on the values stored in the ANSYS database for structuralsteel). Substituting these values into the deflection equation yields an expecteddeflection of:CopyrightedMaterialδ PL3 6 PL 3EI 5 AG(500lb)(4in) 36(500lb)(4in) 0.004627in35(1in) 2 (11.16e6 psi)(1in)(1in)3(29.01e6 psi)()12The maximum bending stress in the beam is expected to occur at the top and bottomof the beam where it contacts the wall. Again, from strength of materials, we wouldexpect a maximum bending stress value of:CopyrightedMaterialσ Mc (500lb)(4in)(0.5in) 12,000 psiI(1in)(1in) 312We will use these two values to compare with our finite element results.
6-4ANSYS Workbench Software TutorialCopyrightedMaterialStep 1 – Start a new DesignModeler database and select Inch in the unit selectiondialog box.Step 2 – On the XZPlane construct a 1”x1” square section.CopyrightedMaterialStep 3A.B.C.D.– Create a beam by extruding the section 4 inches in the Y direction.Switch to Isometric view by clicking on the ISO icon in the toolbar.In the Details View switch the Direction to Reversed.Enter 4 for FD1, Depth( 0).Click p 4 – Save the solid model. Click on the Save (Floppy disk) icon, browse to adesired location and save the file as Tutorial 6 1.
Introduction to Finite Element lStep 5 – Begin a simulation using the solid model of the beam.A. Go to the project page by clicking on the project tab.B. Select the solid model (Tutorial 6 1.agdb) and click on New Simulation.CopyrightedMaterialStep 5 (continued) – The simulation window will open and the part file will bebrought in and displayed as shown.CopyrightedMaterialNote: If you see the Map of Analysis Types window pane on the right hand side,click on the X at the top of the window pane to close it. See section 3.6.2 for stepsto prevent the map from being displayed when the Simulation application starts.Check the bottom right portion of the Simulation window to make sure the units areset correctly. In this tutorial the working units are “US Customary(in,lbm,lbf,F,s)”. If a different system is displayed, use the Units pull down menuto change working units.
6-6ANSYS Workbench Software TutorialCopyrightedMaterialCopyrightedMaterialStep 5C.D.E.(continued) – Rename the solid model to Beam.In the Outline pane expand the Geometry object.Click the RMB on Solid and select Rename.Type Beam.CopyrightedMaterialStep 6 – Set the material type. By default, the Simulation application sets allmaterials in the model to be Structural Steel. In this step we simply check that thematerial type has been set.Select Beam in the Outline pane look at the Material setting in the Details panebelow.CopyrightedMaterial
Introduction to Finite Element lSee section 3.5 in chapter 3 for instructions on adding new material types to yourproject.Step 7 – Define the analysis type. Click on the New Analysis pull-down menu andselect Static tep 7 (continued) – The Static Structural folder and the Solution folder areadded to the Model in the Outline pane.Note the question mark icons next to the Static Structural folder and the Solutionfolder. The reason for the question marks is that we have not yet defined anyloading, boundary conditions or desired results for this analysis. Once thesequantities are specified, the questions marks will be replaced by green check marksor other appropriate icons.
6-8ANSYS Workbench Software TutorialCopyrightedMaterialStep 7 (continued) – Set the load. The loading for this analysis consists of a 500lbfforce in the –Z direction.A. Select the Static Structural folder in the Outline view. The Environmenttoolbar is displayed.B. Orient the beam by rotating it so that the Z axis is in the vertical directionand one end of the beam is visible as shown. The Y-axis should pointtowards you.C. Change the selection mode to Face by clicking on the face icon in theCopyrightedMaterialandgraphics toolbar (called the Selection toolbar in DesignModeler)then select the visible end face.D. Click on Loads in the toolbar and select Force from the menu.E. In the Details pane, change Define By to Components if it is not alreadyset.F. Enter -500 for the Z component and 0 for the X and Y tep 8 – Set The boundary conditions. The boundary condition for this analysisconsists of a fixed support at one end of the beam.
Introduction to Finite Element SimulationCopyrightedMaterialA. Orient the beam by rotating it so that the Z axis is in the vertical directionand the opposite end of the beam (opposite end on which you imposed theforce in step 7) is visible. The Y axis will point away from you.B. Select the visible end face of the beam.C. Select the Static Structural folder.D. Click on Supports in the toolbar and select Fixed Support.E. Click on Apply in the Details window pane.CopyrightedMaterialCopyrightedMaterialStep 9 – Request results. First request deformation.A. Select the Solution folder.B. In the Solution toolbar click on Deformation and select DeformationDirectional.C. In the Details pane change the Orientation to Z Axis.CopyrightedMaterial6-9
6-10ANSYS Workbench Software rightedMaterialStep 9 (continued) – Request normal stressD. Click on Stress in the toolbar and select Stress-Normal.E. In the Details pane change the Orientation to Y Axis.CopyrightedMaterial
Introduction to Finite Element Simulation6-11CopyrightedMaterialThe Project Outline pane now appears as shown below. The question mark next toStatic Structural folder has been replaced by a green check mark indicating thatloads and boundary conditions sufficient to solve this simulation haven beenspecified. The question mark next to the Solution folder is replaced by a yellowlightning bolt. This icon indicates that the solution has not been calculated yet.CopyrightedMaterialStep 10 – Solve.Click on the Solve icon in the toolbar.CopyrightedMaterialThe solution status window will appear and display the various stages of the solutionprocess. The solution is complete when this window disappears.Step 10 (Continued) – Once the solution is successfully completed, green checkmarks will be placed next to the solution quantities you had requested.CopyrightedMaterial
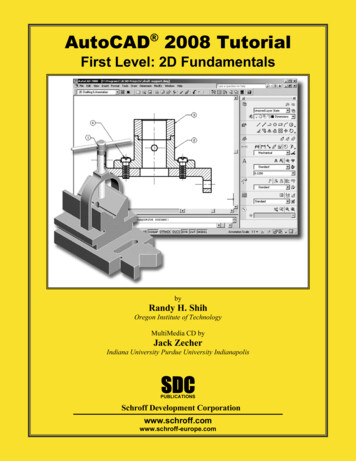
6-12ANSYS Workbench Software TutorialCopyrightedMaterialCopyrightedMaterialStep 11 – Save the analysis. Click on the floppy disk icon in the toolbar and clickthe Save button in the dialog box that appears next. The file name will beautomatically entered as Tutorial 6 1.dsdb and the directory will be the same oneyou selected when you saved the DesignModeler file.Step 12 – Review the results. When the solution is complete, click on one of thesolution quantities you requested such as Directional Deformation or NormalStress to display those quantities as contour plots. For example, the figure belowshows the contour plot of the normal stress in the Y direction superimposed on thedeformed shape of the beam. Note that since in most cases deflections anddeformations are too small to be perceptible, these quantities are automaticallyscaled (exaggerated) to make them easily visible. In this way you can quicklydetermine if you have set the loads and boundary conditions correctly. The scalefactor can be modified from the Result toolbar and set to various values including1.0 (True Scale).CopyrightedMaterialCopyrightedMaterial
Introduction to Finite Element Simulation6-13CopyrightedMaterialStep 12 (continued) – Enlarge the displayed results area.By default, when displaying graphical results, a considerable portion of theWorkbench window is occupied by window panes such as the Timeline and TabularData window panes. These window panes can be unpinned (collapsed) in order toenlarge the graphical results display as described in section 3.4.3, Window ManagerFeatures. To unpin the Timeline and Tabular Data Window panes, click on thepush-pins located at the top right hand corner of each pane. The resulting display isshown below.CopyrightedMaterialCopyrightedMaterialStep 12 (continued) – The displayed contour plots can be modified in several waysin order to better represent the results of the analysis. The modifications areperformed from three pull-down menus as shown below.CopyrightedMaterialThe previous display is set to display Exterior, Contour bands and NoWireFrame.
6-14ANSYS Workbench Software TutorialCopyrightedMaterialStep 12 (continued) – Select Contours Bands and Show Elements from the pulldown menus. The resulting display is shown below.CopyrightedMaterialStep 12 (continued) – Click on Directional Deformation. The resulting display isshown below.CopyrightedMaterialCopyrightedMaterial
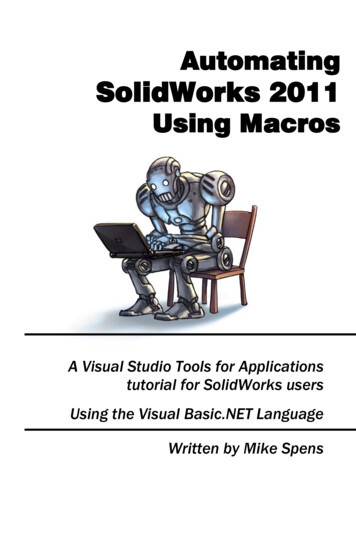
Introduction to Finite Element Simulation6-15CopyrightedMaterialStep 12 (continued) – Note that the maximum and minimum values displayed arethe range values for the contours. For example, on the Normal Stress plot, the redcontours represent stress values ranging from 12,454. PSI to 16,012. PSI. In orderto get a more precise value, use the Probe tool:A. Rotate the beam and position it as shown below.B. Click on Probe in the toolbar.C. Move the cursor over the contoured part and observe the contour values atthe position of the cursor.D. Click the LMB to place a tag indicating the value at that location.CopyrightedMaterialCopyrightedMaterialTo remove a tag, click on the Label icon in the toolbardeleted and press the Delete key on the keyboard., select the tag to beStep 13 – Generate a report. A simple HTML report can be automatically generatedby simply clicking on the Report Preview tab.CopyrightedMaterialThe report generated in this way includes basic information about the analysis suchas the type of analysis, material properties of the materials used, boundaryconditions, etc.
6-16ANSYS Workbench Software TutorialCopyrightedMaterialStep 13 (continued) – The table of contents of the default report is shown below.The entries in the table of contents are hyperlinked to the location of the informationin the report.CopyrightedMaterialStep 13 (continued) – The default report includes the calculated results in tabularform but deformed shapes and contour plots are not automatically included in thereport. Below is an example of tabular results.CopyrightedMaterialCopyrightedMaterialStep 14 – Include contour plot of normal stress in the report.A. In the Project tree click on Normal Stress.B. Click on the Geometry tab at the bottom of the window.C. Adjust the figure as desired by zooming, rotating, etc.D. From the Figures pull down menu in the toolbar select Figure.
Introduction to Finite Element alStep 14 (continued) – A figure of the contour plot of normal stress has been insertedin the project tree under Normal Stress. The figure can be renamed using theRMB and you can also add text that appears as caption with the figure.CopyrightedMaterialCopyrightedMaterialStep 15 – Regenerate the report. Click on the Report Preview tab as before toregenerate an updated report which includes the contour plot figure.Note: Figures inserted in the project tree are updated with the latest results everytime a new report is generated. Therefore, they always reflect the latest conditionsof the analysis. In order to include a static picture, select Image in Step 14, substep D.
6-18ANSYS Workbench Software TutorialCopyrightedMaterialStep 16 – Save the project as Tutorial 6 1.SummaryAs we can see by comparing our manual calculations with the values calculated byANSYS, the displacements are fairly close. However, the stress values do not havevery good correlation.Manual CalculationANSYS Results% difference0.004627 in.0.0045486 yrightedMaterialMax. DeflectionMax. Bending StressThe primary reason for the poor correlation of stress values was due to the boundarycondition occurring at the same location as our maximum stress values. However,our goal during this chapter was to become familiar with the steps needed to get avery simply job to run, and not to be concerned with the accuracy of the results.During the next chapters we will investigate several different techniques that can beused to improve the results of our analysis.ReferenceCopyrightedMaterial[1] Popov, E. P., Mechanics of Materials, 2nd Edition, Prentice-Hall, Englewood CliffsNJ, 1976Exercises:1. Use ANSYS Workbench to build a finite element model of the beam shown below,that has a 20mm x 20mm cross section and is made from structural steel.Determine the maximum deflection and bending stress in the beam. Thencompare these values with those that you manually calculate using strength ofmaterial formulas from your textbooks (you do not have to take into account thedeflection due to shear, as was done in the example problem in this chapter).CopyrightedMaterial
Introduction to Finite Element Simulation6-19CopyrightedMaterial2. Use ANSYS Workbench to model and analyze the 36 inch long beam shownbelow. Imprint lines on your model of the beam, to use as edges on which toapply the 1500 lbs. loads. The beam is made from 1/2” thick, structural steel.Determine the deflection and normal (bending) stress at the center of the beam.Then compare these values with those that you manually calculate using strengthof material formulas from your textbooks (you do not have to take into accountthe deflection due to shear, as was done in the example problem in this chapter).CopyrightedMaterial3. Use ANSYS Workbench to build a finite element model of the cantilevered beamshown below, that is made from structural steel. Determine the maximumdeflection and bending stress in the beam. Then compare these values withthose that you manually calculate using strength of material formulas from yourtextbooks (you do not have to take into account the deflection due to shear, aswas done in the example problem in this chapter).CopyrightedMaterialCopyrightedMaterial
6-4 ANSYS Workbench Software Tutorial Step 1 – Start a new DesignModeler database and select Inch in the unit selection dialog box. Step 2 – On the XZPlane construct a 1”x1” square section. Step 3 – Create a beam by extruding the section 4 inches in the Y direction. A. Switch to I