Transcription
Building aSecurity DashboardJoel M Snyderjjms@opus1.com@ pSenior PartnerOpus One
Agenda WhatWhat’ss a Dashboard? How do I build one (part 1)? partsp2 throughg n don’t fit in anhour
A Security Dashboard Provides Provides “AtAt a Glance”Glance view of your securityposture
“Security Posture?”What’sWhats that? SinceSecurity is Risk Avoidance, Joel’sD fi itiDefinitionis:iSecurity Posture: TheDegree to Which YouAre Exposed to Risk
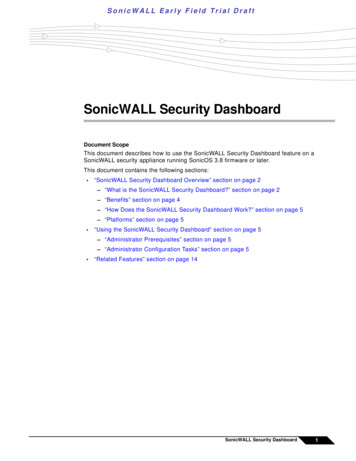
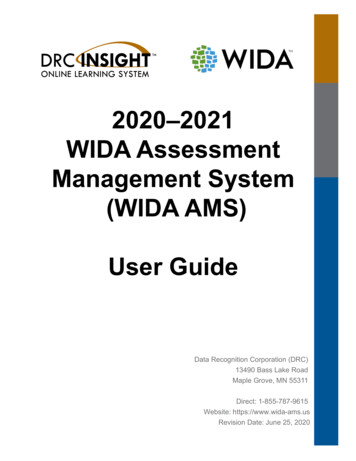
Risk Mitigators Reduce RiskRISKRiskMitigatorRISK
For Example:BeforeMitigatorAfterLots of virusesAnti-virusA few virusesL t off spamLotsA tiAnti-spamA fewfspamLots of attacksIntrusionPreventionA few attacksLots ofinappropriatetrafficContentfilteringA littleinappropriatetrafficLots of leakeddataData LeakProtectionA little leakeddataLots of portscansFirewallA few portscans
Anomaly Detectors canDetect Risk 1 standard deviationSecondary signs of increase inrisk are also visible in the formof anomalous activity
Step 1 ofBuilding A Dashboard Identify Sources of Risk Information Risk mitigation technologies Anomaly detection technologies Traffic flow and information
Example: Opus OneSource ofI fInformationtiType of InformationFirewall TrafficLogTraffic in/out of the network; prohibitedinbound/outbound attemptsMail SecurityGatewayLevel of inbound email traffic; number of viruses andspam blockedIDS/IPSAlerts on suspicious traffic; alerts on blocked trafficNetworkMonitoringSystems up/down; ping latency;link/disk/memory/CPU usageBandwidthGraphingTraffic levels at network port granularityVulnerabilityAnalyzerSystem vulnerability detection; deltas invulnerabilities; changes in open portsLog CollectorInformation from SYSLOG, Windows Event Log, SNMPTripwireChanges in system security or sensitive files
How Do We MeasureRisk Exposure?Identify assets anddefine their valueIdentify threatsto assetsCalculateSLE (EF x Value) DowntimeALEbeforeCalculate ARObefore * SLEbeforeFigure out a solutionthat mitigates riskALEafterChange EF,ALE, and AROCalculate AROafter * SLEafterCompare ALEbeforewith ALEafter
OK, Better Question:What Do Our Data Tell Us? Mitigators cancan’tt tell you when they’rethey rebroken But you may be able to see it Anomaly detectors can’t tell you whensomethingg is broken But you may be able to see it
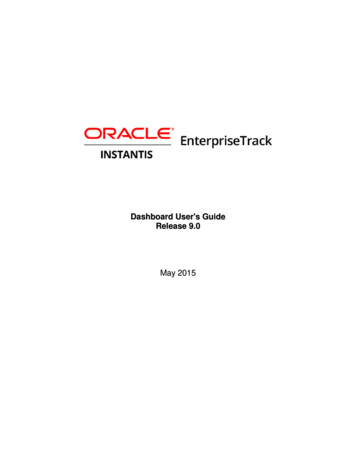
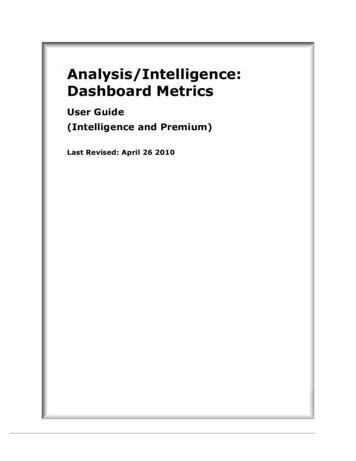
For Example,Mail Security GatewayWhat can you see in this information that helpsyou to evaluate security posture and risk?
This Turns Into Into1 hr, 8 hr, 100hr
Or Possibly
Example 2: Network Status
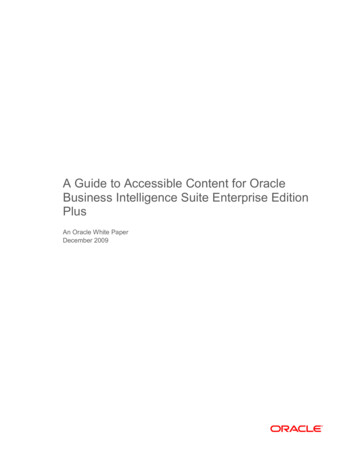
How About:Who is Slow?Slow?”“WhoRemember: “who is down” is not securitydashboard—you’llygetg alerts for that stuff. Wewant additional insight on un-alertable datahere.
Too Generic:“Who is Unusually Fast/Slow?”Better but would be good tocolor code based on how faroff of normal behavior this is.Even better don’t fixate on“ping” but extend responsetime to applications
Step 2 ofBuilding a Dashboard2 Reduce output of risk mitigation tools2.to minimum needed to determinesecurity posture!If you want the full boat, you canalways click-through to theoriginal data or a more detaileddisplay
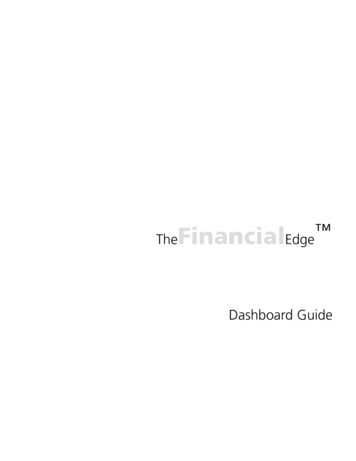
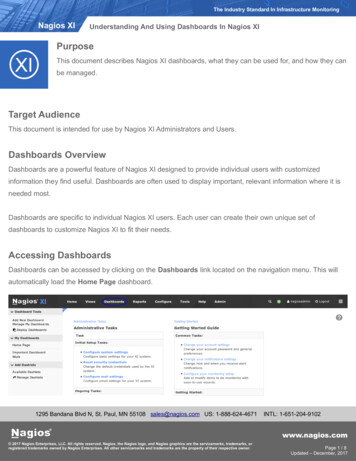
Incorporating Anomaly DetectionRequires BaseliningQuick: is there something wronghere or not?
Without Baselining,You’llYoull Never KnowLooks like we kick off backups onTuesdayy at midnightg for this systemy
Examples of Baseline DeviationSource ofInformationDeviation To Look ForFirewall TrafficLogTraffic high/low; outbound “deny” highNetworkMonitoringApplication “slower”slower than normalVulnerabilityAnalyzeryDelta in open ports/responding servicesLog CollectorSYSLOG/Windows Log/SNMP Trap above normal levelsfor each systemTripwireTripwire is all about deviations!
Step 3 ofBuilding a Dashboard3 Determine sliding baseline for3.security metrics and report whenbaseline is exceededYou will also want to have purebandwidth graphs on yourdashboard but you don’tdashboard,don t haveroom for too many
Next Steps4. Identify most critical 12 to 16 “panes”of data giving insight into securityposture5. Bring together into graphical format6. Reconcile with alerting7. Get promotion from drooling boss
Thanks!Joel M Snyderjjms@opus1.com@ pSenior PartnerOpus One
Type of Information Information Firewall Traffic Log Traffic in/out of the network; prohibited inbound/outbound attempts Mail Security Gateway Level of inbound email traffic; number of viruses and spam blocked IDS/IPS Alerts on suspicious traffic; alerts on blocked traffic Network Monitoring Systems up/down; ping latency; link/disk/memory/CPU usage