Transcription
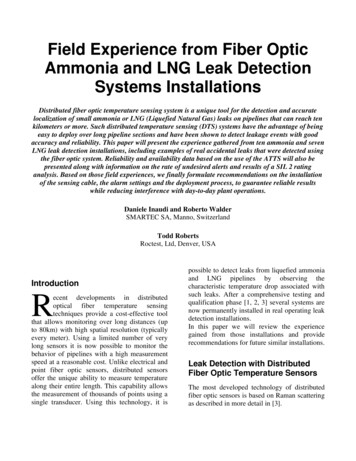
Leak detection on water pipelines in unsaturated ground by discrete fibre optic sensingS.W. JacobszDepartment of Civil Engineering, University of Pretoria, Private Bag X20, Hatfield, 0028sw.jacobsz@up.ac.zaS.I. JahnkeDepartment of Civil Engineering, University of Pretoria, Private Bag X20, Hatfield, 0028AbstractThe paper describes a study using discrete fibre optic sensing as a means of leak detection on waterdistribution pipes installed in unsaturated ground. A short length of pipe fitted with artificial leakpoints was installed, to which a fibre optic cable with fibre Bragg grating (FBGs) was attached. Anoptical fibre with FBGs was also installed in the ground parallel to, but separate from the pipe.Thermistors were installed at selected locations to measure temperature changes independent ofstrain. It was found that a simulated water leak resulted in clearly detectable temperature changes andthermally induced FBG wavelength changes in the ground around the pipe. However, significantlylarger deformation-induced FBG wavelength changes were measured on the pipe walls and also in theinitially unsaturated ground in response to leaks.A wetting front originating from a water leak propagating through unsaturated soil is associated withsignificant effective stress changes because the infiltrating water alters the ambient matric suction inthe soil. This effective stress change is associated with significant ground deformation resulting in aFBG response which significantly exceeds the thermal response associated with (usually) colder waterleaking into unsaturated soil. The study illustrates advantages of measuring ground deformationinduced FBG wavelength changes over pure temperature changes as an efficient means of leakdetection in unsaturated ground. However, due to the limited number of FBGs that can be monitoredalong a single optical fibre, a leak detection system suitable for practical implementation should bebased on distributed fibre optic strain sensing, an aspect requiring further research.Keywords: Fibre optic leak detection, unsaturated ground, temperature measurement, FBGwavelength measurement, Bragg gratings, pipe leakIntroductionIt is estimated that approximately 26% of the potable water distributed by the City ofTshwane/Pretoria (capital of South Africa) is lost due to leakages from the aging distribution system(McKenzie et al. 2012). Just in the City of Tshwane this amounts to approximately 75 million cubicmetres per annum. It is often mentioned in the media that up to a third of potable water distributed inSouth Africa is lost from distribution systems, a situation that cannot be afforded in a water-scarcecountry with a growing population and rapid urbanisation. This problem is a global phenomenon asillustrated by the statistics of estimated ratios of non-revenue water from a number of countries inFigure 1.[Insert Figure 1]Aging water distribution networks eventually develop leaks, which is a major contributor to nonrevenue water volumes around the world (McKenzie et al., 2012). Leaks from distribution networksare generally not easily detected before a large volume of water had been lost. This results inremedial action normally being implemented late. The simplest form of leak detection is fieldinspections, followed by mass balance methods, relying on isolating sections of the water distribution1
network and comparing metred inflow to outflows. To assess extended water networks using suchmethods is labour intensive. Advances in technology has resulted in a variety of more sophisticatedleak detection methods becoming available. Examples include a range of acoustic detection methods(Van Zyl, 2014; USEPA, 2010), chemical detection methods using tracer gas or liquid techniques(USACE, 2001; USEPA, 2010), thermography (USEPA, 2010), ground penetrating radar (Eyubogluet al., 2003), satellite based spectral analysis (Agapiou et al., 2013) and others. A shortcomingcommon to all these methods is that a third party has to be appointed to search for leaks. Given theextent and complexity of water reticulation networks in urban environments, the risk of non-detectionis significant.A number of technology streams are commercially available to monitor strains and temperature inoptical fibres. The first sensor type provides discrete strain measurements using Bragg gratings.Bragg gratings can be etched into photo-sensitive optical fibre using a suitable laser source to create aperiodic variation in the fibre refractive index (Rao, 1997). Several of these gratings, each with aslightly different wavelength are typically created in a single fibre. When a broad-band light source ispassed along the fibre, some light is reflected back by each Bragg grating. The reflected wavelengthis influenced by both the mechanical strain and temperature changes that the Bragg grating issubjected to as defined in equation 1. 𝑙𝑙 𝑘𝜀𝜉𝛼 𝑇(1)with l0 the original FBGs wavelength, ε the mechanical strain and ΔT temperature change imposed onthe Bragg grating, while k is the strain-optic coefficient, ξ the thermo-optic coefficient and α thethermal expansion coefficient for silica. If the Bragg grating is subjected to strain, the wavelength ofthe light reflected back will change and by analysing changes in the reflected wavelength, strain canbe determined to a high resolution, provided that the associated temperature change is known. Astemperature changes result in changes in the wavelength of light reflected back from each Bragggrating, Bragg gratings isolated from mechanical strain can also be utilised for temperature sensing.Analysis of Raman, Rayleigh and Brillouin back-scatter in optical fibres enables the determination ofmechanical strains and temperature that the fibre is subjected to. Mechanical strains and temperaturecan be detected in optical fibres using Brillouin optical time-domain reflectometry/analysis (BOTDRor BOTDA) (Nikles et al. 1997). These methods represent optical measurement techniques tomeasure the Brillouin frequency shift in an optical fibre. The shift in the Brillouin frequency islinearly correlated to either the mechanical strain or temperature that the optical fibre is subjected to,but the two quantities cannot be resolved independently if both vary (Nikles et al. 1997; Motil et al.2016). Therefore, by using a tight buffered fibre optic cable, the mechanical strain in the medium inwhich or to which the fibre is attached can be resolved and, by using an optical fibre which ismechanically isolated from its surround, temperature can be resolved. Several commercial systemshave become available over the past 20 years that provide distributed strain and temperaturemeasurements capability over many kilometres of fibre optic cable to a spatial resolution down to0.05m or better (Motil et al. 2016). Both Bragg gratings and distributed strain technology are usedwith success in many monitoring applications, including monitoring deformations of buried structuressuch as pipes.The sensing capabilities resulting from the development of fibre optic strain, temperature andvibration sensing technology are finding application across most civil engineering disciplines. Someexamples in geotechnical engineering include ground movement detection and monitoring associatedwith tunnelling (Klar and Linker, 2010; Mohamad et al., 2011; Hauswirth et al., 2014, Klar et al.,2014), sinkhole formation (Linker & Klar, 2017) and landslides (Iten et al., 2008). Numerousapplications are found in structural monitoring, including the monitoring of the performance ofadvanced composite materials (Green et al., 2000), concrete structures (Mendez and Morse, 1992),bridges (Holton 1998; Maaskant et al. 1997), tunnel linings (Beck et al. 2016), monitoring of pipelinestructural integrity in the nuclear industry (Lee et al., 2012), with new applications being devised2
regularly. The use of these monitoring systems provides real time or near-real time information onthe actual performance of working infrastructure, allowing for timeous mitigation of deficiencies.Fibre optic technology is also employed in leak detection. Fibre optic leak detection systems typicallyoperate by detecting leakage-induced temperature fluctuations (e.g. Nikles et al., 2004; Mishra &Soni, 2011), with some applications in which strain in the pipe wall itself is measured (e.g. Inaudi &Branko, 2010; Feng et al. 2016). Many examples of leak detection applications can be found on oil,gas and brine pipelines. Leakage in oil, gas and brine pipelines are usually associated with substantialtemperature deviations as warm or cold fluid leaks from a pipe or as adiabatic cooling occurs duringleakage from pressurised gas mains. In the case of water distribution pipelines, the temperaturedifferential between the water in the pipe and the ground outside the pipe is typically much smaller.Detection of a small leak-induced temperature deviation may be difficult before a large volume ofwater had been lost because of substantial daily and seasonal temperature fluctuations. Limitedinformation on such detection systems for water distribution networks in the literature suggests thatthe implementation of such systems on water distribution networks is still in its infancy compared towhat is available in the oil and gas industries.Experimental study into leak detection using Fibre Bragg GratingsThis paper describes a study investigating the potential application of the discrete sensing capabilitiesof fibre Bragg gratings (FBGs) as a means of leak detection on water pipelines. It was hypothesisedthat because FBGs can detect strains and/or temperature changes at a very high resolution, they canpotentially be used to measure pipe and ground strain and/or temperature changes associated withwater leaks.Thermal monitoring of the ground profileIt was hypothesised that the most efficient detectable parameter to indicate a leak would be a thermaleffect (i.e. a temperature change) near a pipe caused by the leakage of usually colder water into theground. For a leakage detection system to be successful, leakage-induced temperature changes mustbe distinguishable from naturally occurring fluctuations. A temperature measurement array wastherefore set up to measure ground temperature variation with depth over the course of the two yearstudy period, as well as the variation in the water temperature in a water distribution main (monitoredfor six months). A set of thermistors was buried at depth increments of 0.25m to a depth of 2m, witha deeper thermistor at 3m.The ground conditions on site comprised of a slightly moist, red-brown, slightly clayey silty sand ofmedium dense to dense in situ consistency (Jahnke et al., 2018). The soil profile in this trial wasunsaturated with an in situ moisture content of about 13%, corresponding to a degree of saturation ofabout 15%. The water table was deep and did not affect the site.Ground temperature profiles are dependent on climatic conditions. It is therefore important to assesswhether a measurable temperature differential exists between the water temperature in distributionmains and the surrounding soil where such systems will be implemented. Figure 2 presents groundtemperatures, as well as the temperature in the monitored water main over an approximately sixmonth period. The temperature fluctuation in the water main significantly exceeded that in theground, but the maximum water temperature was consistently approximately 2 C lower than theground temperature at 0.5m. This indicates that a leak detection system based on temperaturemonitoring has potential to be successful in the environment investigated. The influence of leakageinduced mechanical ground strain changes is considered later in this paper.[Insert Figure 2]3
Laboratory leak testsHaving measured a distinct temperature difference between the water main and the ground, thequestion arose whether the temperature of water slowly leaking from the pipe will not soon rise to thatof the surrounding ground, eliminating the temperature differential, impacting negatively on theperformance of the leakage detection system. A small-scale laboratory study was carried out to assesswhether temperature measurement can be effective in detecting a passing wetting front from a leak inwhich the water temperature is given time to equilibrate to that of the soil. A transparent plasticcontainer measuring 790mm x 400mm x 590mm high was filled with a fine dry silica sand (D50 of70 m) in which a number of thermistors (Vishay NTCLE305E4) were embedded. A slow leak rate of2.3 ml/sec was imposed and the propagation of the wetting was visually monitored as it advanced pasta number of thermistors.Immediately upon passage of the wetting front, a clearly measureable increase in temperature of0.2 C to 0.5 C was observed, after which the expected temperature reduction followed, resulting in afinal temperature lower than the initial. The initial temperature increase was not anticipated and wasinvestigated further by monitoring temperature changes on wetting fronts in five different granularmaterials. For this purposes five Perspex cylinders (100 mm high x 50 mm diameter) were filled withrespectively dry fine silica sand (D50 of 70 m), gold tailings (D50 of 113 m), platinum tailings (D50of 100 m) and iron tailings (D50 of 8 m), while the fifth cylinder was filled with dried soil from thetest site where the field monitoring was carried out (D50 of 88 m). After filling, the cylinders werelightly tapped to nominally compact the contents until visible settlement of the contents had stopped.The particle distributions of the sand and tailings all fell within the fine sand and silt size ranges,while the soil from site also contained approximately 9.2% clay. Thermistors were positioned at middepth in each cylinder and the cylinders with their contents were placed in Petri dishes into whichwater was poured. A wetting front advanced upwards in each cylinder under capillary rise.The temperature records from the experiment are presented in Figure 3. The ambient roomtemperature was 26 C. It can be seen that in all materials tested, a clearly measurable temperatureincrease occurred upon first wetting, followed by a reduction in temperature as the flux of colderwater advanced past the thermistors. The net effect was still, as initially expected, a reduction intemperature. The soil from site, which contained a significant clay fraction, showed a nearly 20 foldgreater temperature increase (plotted on the secondary vertical axis) compared to the tailings andsand.A literature search revealed that initial rise in temperature can be attributed to the release of surfaceenergy from the surfaces of the soil grains upon wetting with water. The process of wetting of a solidsurface by a liquid involves interaction between three interface types, i.e. solid-liquid, solid-air andliquid-air. Wetting results in a solid-air interface along the particle surfaces being replaced by a solidliquid interface. Each solid surface has its own specific surface energy, which is associated with theway in which atoms are bonded into that solid (e.g. co-valent, ionic or hydrogen bonding) (Parks,1984). A certain amount of energy (i.e. surface energy) needs to be added to a surface to allow atomsto be removed from the lattice structure. Wetting can result in a net increase or a net decrease in totalsurface energy. When energy is released upon wetting, wetting occurs spontaneously and the surfaceis hydrophilic. Should energy be required to be added for wetting to occur, the surface will not wetnaturally and will be hydrophobic (Wenzel, 1936).Wetting of quartz by water results in a reduction in the specific surface energy of quartz by about72 mJ/m2 (Parks, 1984). Due to the fine-grained particulate nature of soils, the surface area of a smallvolume of material rapidly becomes large as grain size is reduced. Wetting a fine-grained soil, whichis known to occur spontaneously, is therefore associated with a measurable release of surface energy.This release of surface energy is responsible for the small rise in temperature associated with thepassage of the wetting front. Because of a different value of specific surface energy and thesubstantially increase surface area of clays compared to silts and sands, the release of surface energy4
is much greater upon wetting. This process was also investigated by Aslannejad et al. (2017) andothers, who ascribed the rise in temperature upon first wetting to the said phenomenon.In addition to the exchange of surface energy, a rise in temperature is also possible due to theexothermic reaction associated with hydration of many minerals, which may be present in the soil asthey come into contact with water upon passage of the wetting front.After passage of a wetting front, the thermal mass of the colder liquid released by the leak will resultin a drop in temperature which, if measured, should allow the leak to be detected. This illustrates thepotential success of a leakage detection system based on temperature measurement installed in closeproximity along a pipeline.The impact of the reported initial temperature increase is not considered to be significant in terms ofthe performance of a temperature-based leakage detection system because, as can be seen in the leakrecord (Figure 3), the temperature increases were of short duration and only noticeable for a fewminutes after wetting had occurred. Due to the large volume of colder water potentially followingbehind a leakage-induced wetting front, a net reduction in temperature seems reasonable to expectgiven the conditions tested. Also, in a leak detection system implemented in practice it is likely thatthe interval at which readings are recorded will not allow the initial temperate spike to be clearlyobserved. The rate and magnitude of reduction in temperature due to a leak is a function of the heatflux associated with the ingress of colder water originating from the leak into the ground. In practice,the rate of temperature reduction will therefore be a function of the leakage rate and the difference intemperature between the leaking water and the ground.[Insert Figure 3]Field trialA field trial was carried out at the Hillcrest Campus of the University of Pretoria to investigate theperformance of a FBG-based leakage detection system on a short length of pipe. The test arrangementwas designed to allow effects from changes in pipe strains, ground strains and ground temperaturescaused by artificially imposed leaks to be observed. The trial is described in detail by Jacobsz (2018)and Jahnke (2018).The installation comprised of a 12 m long (two lengths of 6m, with an outer diameter of 110mm)uPVC water pipe equipped with artificial leak points. The pipe installation is illustrated schematicallyin Figure 4. The installation included a fibre optic cable (Draw Tower Grating Low Bend Loss fibre –DTG -LBL-1550-F) with 16 discrete fibre Bragg gratings along its length, spaced at 1m. The FBGwavelengths ranged from 1510 nm to 1570 nm in 4 nm increments. The cable comprised of anoptical fibre coated with an organically modified ceramic (Ormocer ) which offers benefits in termsof sensing properties and ease of handling / stripping over polyimide or acrylate (FBGS, 2019). Thecoated fibre was protected by a glass fibre reinforced plastic surround to 1mm diameter, surroundedby a layer of high-density polyethylene, producing a cable with an outer diameter of 2mm in wireform. According to the manufacturer, the effective elastic modulus of the cable exceeds 48GPa andthe maximum tensile strain 25000µε (FBGS, 2019).The fibre optic cable was attached along the length of the pipe so that the first eight FBGs weresecured to the outside of the pipe invert by means of a structural adhesive to record longitudinal pipewall strains. The pipe surface was first roughened using sand paper, then cleaned using ethanol, afterwhich the cable was attached to the pipe using Richem M100 Methacrylate Structural Adhesive. Theunbonded part of the cable was looped back so that the remaining eight FBGs were located in the pipetrench parallel to the pipe, with each free FBG opposite a fixed FBG. The separation between the freeand fixed FBGs was on average 300mm. The looped back part of the fibre optic cable was sleevedinside a 4mm OD, 2.7mm ID polyethylene tube of 0.65mm wall thickness (manufacturer Festo). The5
on-average 0.35mm wide annulus between the fibre optic cable and the tube was filled with a multipurpose low viscosity lubricating oil.The sleeved fibre optic cable was placed in the pipe trench corner before the pipe was backfilled. Theintention of sleeving and lubricating the fibre optic cable was an attempt to isolate it from mechanicalstrain in the soil so that it would respond to thermal effects only. Polyethylene was selected as asleeve material for its chemical resistance, including resistance to lubricants. This sleeve arrangementshould have been relatively effective to isolate the FBGs from axial strains acting along the sleeve.However, due to the small annulus between the cable and the sleeve and because the cable wouldhave been in contact with the sleeve in many places, the sleeved FBGs would still have responded tobending of the sleeved cable, should it have occurred. Significant bending was, however, notanticipated at conception of the project.Sleeving and lubricating the fibre optic cable would have added to its thermal inertia, resulting in aslight delay and attenuation in the FBGs’ thermal response. However, calculation showed that thethermal inertia of the sleeved fibre was similar to that of the equivalent cross section of soil. Also,because of the small thermal mass of the sleeved cable and the slow rate of temperature changeobserved (1.5 C in 12 hrs, see Figure 5), the thermal inertia is not considered significant.In addition to the optical fibre, nine thermistors (Vishay NTCLE305E4) around the pipe at the leaklocations, as shown in Figure 4, were used to allow soil/water temperature variations to be verifiedindependently during leak tests.Backfill from the original trench was placed around the pipe and hand compacted to the pipe crown,after which the remainder of the pipe trench was backfilled and mechanically compacted toapproximately 90% Mod AASHTO density.The pipe was connected to the municipal water network. Inlet and exit valves were provided to allowthe flow through the pipe to be regulated. The pressure in the pipe was monitored using a pressuregauge at the upstream end. The water temperature in the pipe was measured using a thermistor at theupstream water intake.Three artificial leak points were located at 2m offsets along the length of the pipe as shown in Figure4. Each leak point comprised a 4mm diameter polyethylene tube tapped into the pipe from where itwas routed to the ground surface and back to its start point on the buried pipe. A valve was installedin each tube at the ground surface, which allowed the leakage rate to be controlled to the desired flowrate. This configuration was used to allow water to be leaked from the pipe itself so that the leakedwater would have the same temperature than that in the pipe.[Insert Figure 4]Leak testsA number of short duration leak tests were carried out by opening the valves at the leak points andallowing water from the pipe to be discharged immediately next to the pipe. Effects from pipe andground strains and temperature changes were monitored using the FBGs from at least 24 hours beforethe leak tests started until approximately 48 hours after the leak had been terminated. After the shortduration tests, the installation was monitored for a period of approximately 9 month after which alonger term leak test, lasting 17 days, was carried out.6
ResultsBecause only a number of the FBGs had thermistors installed near them to measure temperatureindependently, only some FBG results could be temperature compensated. For this reason, FBGresults are generally presented in terms of wavelength change.Leak induced pipe and ground deformation changesFigure 5(a) presents wavelength changes measured by the eight FBGs glued to the pipe before, duringand after imposing a leak. The leak duration was approximately 14 hrs during which water wasreleased into the ground at leak location 1 (see Figure 4) at a flow rate of 85 ml/sec. The initiationand end times are indicated by the broken vertical lines. Figure 5(b) shows wavelength changesmeasured using the eight FBGs located in the pipe trench corner. The leak location was closest toFBG6 (on pipe) and FBG11 (in soil) (see Figure 4). Thermistors were present next to FBG1, 6, 11and 16 and allowed the components of FBG-measured wavelength change caused by the leak-inducedtemperature variation to be quantified and subtracted from the measured wavelength change usingEquation 1. A thermal coefficient (ξ α) of 6.5E-6/K was provided by the fibre optic cablemanufacturer. The thermally compensated results are represented by the thin lines plotted in Figure 5,visible next to the uncompensated values for FBG1, 6, 11 and 16. The temperature records used forthe thermal compensation of FBG1, 6, 11 and 16 are plotted in Figure 5(c). As observed in thelaboratory, temperatures near the leak first exhibited an initial increase, after which a reduction intemperature followed.[Insert Figure 5]It can be seen from Figure 5(a) that leak initiation was immediately accompanied by clearlymeasurable deformation of the pipe. Strains were detectable at all FBGs mounted on the pipe, withthe effect generally reducing with increasing distance from the leak point. Deformation continued tooccur throughout the entire leak duration. Once the leak had been closed, the wavelength variationsgradually returned to their seasonal trend, i.e. a gradually increasing ground temperature.A similar response was observed by the free FBGs in the pipe trench corner, although the change inFBG wavelength was considerably smaller compared to those on the pipe itself. Despite muchsmaller values, the leak-induced effects were clearly measurable despite the attempt to mechanicallyisolate this part of the fibre optic cable from mechanical strains.Figure 5(a) shows that the thermal component of the FBG measurements represented a smallcomponent of the leak-induced effect measured on the pipe itself. Given a maximum temperaturedeviation during the leak test of about 1 C relative to the start of the experiment, a maximumthermally induced wavelength change of about 10pm (pico meter) was calculated (Equation 1), asmall portion of the total wavelength change as demonstrated in Figure 5(a). Due to the smaller effectmeasured by the FBGs in the ground, the thermal effect represented a larger fraction of the total leakinduced effect as shown in Figure 5(b). It is apparent that the component of wavelength change frommechanical strain was much larger than the thermal effect.Figure 6(a) and (b) present the wavelength changes during the leak test referred to above, plotted withdistance along the length of the pipe and in the ground respectively. Positive values represent tensilestrains. It is apparent that the leak resulted in sagging of the pipe near the leak location, although themaximum leak-induced wavelength change (strain) was measured at FBG 7, 1m from the leak. Thereason for this was most probably attributable to the pipe trench invert, which sloped from FBG1towards FBG8. Negative strains to the left in Figure 6(a) indicated compression, i.e. hoggingdeformation of the pipe outside the sagging zone, as would be expected.Although of a smaller magnitude, Figure 6(b) demonstrates that wavelength changes measured in theground generally corresponded with those observed on the pipe. The hogging deformation thatoccurred on the pipe was largely absent due to the low bending stiffness of the sleeved fibre opticcable compared to that of the pipe. It appears that the fibre optic cable registered bending strains as7
the soil near the leak settled due to leak-induced inundation. The maximum values coincided with theleak location. Changes to the right in the diagram reflect the trench slope as discussed above.[Insert Figure 6]Effect of network pressure fluctuationsThe pressures in most water distribution networks fluctuate depending on water use and supplycharacteristics and are not constant over time. Such pressure fluctuations will result in mechanicalstrain changes in the walls of water distribution pipes. It is important that these strain changes mustbe distinguishable from changes resulting from a water leak. The application of internal pressure inan “infinitely” long elastic thin-walled cylinder such as a water distribution pipe results in an outwardlateral expansion of the cylinder, accompanied by a negative (shortening) axial strain (𝜀 ofmagnitude𝜀(2)where p is the internal pressure in the pipe, R the pipe radius, ν the Poisson ratio, E the elasticmodulus and t the pipe wall thickness.Figure 7 presents FBG measured wavelength changes measured on the pipe installation during whichthe internal pipe pressure was incrementally raised and lowered, imposing three pressure cycles.Temperature measurements from thermistor string 2 (see Figure 4) for the test duration are presentedin Figure 7(b). It can be seen that significant wavelength changes were generated in parts of the pipedue to the applied pressure cycles. The largest changes occurred near the middle of the 12m length ofpipe where a coupling, which was not completely pushed tight during installation, allowed for acertain amount of freedom, permitting some axial deformation. Changes in FBG measurementsreduced away from the coupling where the pipe was longitudinally restrained by the surroundingcompacted soil. The maximum wavelength changes were large and of a similar order of magnitude tothose resulting from the leak demonstrated in Figure 5(a).The temperature record (Figure 7(b
Fibre optic technology is also employed in leak detection. Fibre optic leak detection systems typically operate by detecting leakage-induced temperature fluctuations (e.g. Nikles et al., 2004; Mishra & Soni, 2011), with some applications in which strain in the pipe wall itself is measured (e.g. Inaudi & Branko, 2010; Feng et al. 2016).