Transcription
Research Reports in Software Engineering and Management2015:02ISSN 1654-4870Dashboard development guide - How to build sustainableand useful dashboards to support software development andmaintenanceMiroslaw StaronDepartment of Computer Science and Engineering
Dashboard development guideHow to build sustainable and useful dashboards to support software developmentand maintenanceMiroslaw Staron Miroslaw Staron, 2015Report no 2015:02ISSN: 1651-4870Department of Computer Science and EngineeringChalmers University of Technology and University of GothenburgChalmers University of TechnologyDepartment of Computer Science and EngineeringSE-412 96 GöteborgSwedenTelephone 46 (0)31-772 1000Göteborg, Sweden 2015
Research Reports in Software Engineering and Management No. 2015:02Dashboard development guideHow to build sustainable and useful dashboardsto support software development andmaintenanceMiroslaw StaronDepartment of Computer Science and EngineeringCHALMERS University of GothenburgGothenburg, Sweden 2015
Dashboard development guideHow to build sustainable and useful dashboards to support software development andmaintenanceMiroslaw Staron, miroslaw.staron@gu.se1 IntroductionVisualizing of organizational performance is a basis for the monitoring, controlling andimprovement of the operations of organizations. Dashboards are often used for this purposeas they are a powerful tool to comprise relevant information in a single view providinggraphical overview of the current status (Staron 2012). A dashboard is defined as an easy toread real-time user interface, showing graphical presentation of the current status(snapshot) and historical trends of an organizations Key Performance Indicators to enabledecisions.Dashboards can be used for multiple purposes and their design, technology and scope differbased on these usage scenarios:1. Information radiators – dashboards designed to spread the information about the statusto large audiences, often designed as information screen placed in central places forprojects, teams, or groups.2. Management dashboards – dashboards designed to provide information to themanagers on the status of the project and the underlying parameters of the status, oftendesigned as desktop reports with the possibility to drill-down in the data.3. Business intelligence dashboards – dashboards designed to support product managers inaccessing, visualizing and analyzing the data related to product development and itssurrounding market, often designed as a desktop application with a potential for webbased access to reports.4. Hybrid dashboards – dashboards combining two or three of the above usage scenarios.In this document we describe how to develop and deploy a dashboard for visualizingsoftware metrics. The document is intended for architects and designers of the dashboardand includes for following elements: Architecture of the dashboard Methods for selecting the right dashboard Overview of the techniques and tools for dashboard development Roles and responsibilities related to the dashboard developmentThe document is structured as follows. In section 2 we describe a reference developmentprocess for the dashboards based on the dashboard selection model (designed in Sprint 8)and the lean start-up principles of minimum-viable-product. In section 3 we present thedetails of how to select the right dashboard for the purpose of the organizations. In section 4we describe a typical architecture of a dashboard and discuss its variants based on the usagescenarios. In section 5 we describe what a typical content of a software engineeringdashboard is and in section 6 which roles are involved in the design of a dashboard and theresponsibility of these roles. Section 7 concludes this document.Software Center metrics project1
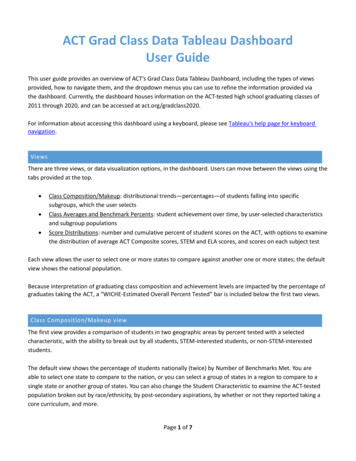
2 Dashboard development processDashboard should be developed iteratively in close collaboration with the users of thedashboards or the personas representing the users. However, the stages of the developmentprocess should progress from requirements elicitation where the dashboards areconstructed to understand the information needs and their presentation to the maintenanceof the dashboards where the corrective maintenance activities and support take place. Theoverview of the stages is presented in Figure 1.FIGURE 1. DASHBOARD DEVELOPMENT PROCESS OVERVIEWThe stages can be briefly described as follows: RQ Elicitation: the goal of this stage is to collect high level expectations for thedashboard and create the first mock-ups of its content. The dashboard designers need tomake interviews in the organization to identify the stakeholders, information providersand users of the dashboard. During this stage the dashboard designers need to workwith the goals for the dashboard (e.g. by finding what the information needs are to besatisfied, which metrics to visualize, etc. (Staron, Meding et al. 2011)). The result is aninformation model for the indicators of the dashboard and the mock-up of its visualcontent. Dashboard type selection (see also section 3): the goal of this stage is to find thetechnology which is to be used to realize the dashboard. The result of this stage is a firstprototype of the working dashboard as a feasibility study of the technology. Dashboard design: depending on the chosen technology the dashboard designers needto iteratively design and evaluate the dashboard. We recommend the concept of theMinimum Viable Product and the Build-Measure-Learn for this stage (Ries 2011). Thisstage should conclude with a working dashboard placed according to the initialrequirements. Impact evaluation: after the dashboard has been put in place the dashboard designersneed to observe what the impact the dashboard had on the organization. For this werecommend the theory of organizational learning by Goodman and Dean (Kontogiannis1997). A successful dashboard, in this context, would show signs of influencing thepractice at the company, which would show in the dashboard’s indicators/metrics afterthe influenced change was introduced. Dashboard maintenance: the final stage is to place the dashboard in a maintenancewhere the dashboard designer or a dedicated person monitors that the dashboard isoperational and that it shows the information required. The designer also needs to beinvolved in the updates of the dashboard once the company’s goals change or the datasources change over time.Designing and maintaining of the dashboards depend on the chosen technology, thereforethe designers of the dashboard need to evaluate the needs of the organization and choosethe technology wisely. In the next section we describe a technique for selecting the rightdashboard.Software Center metrics project2
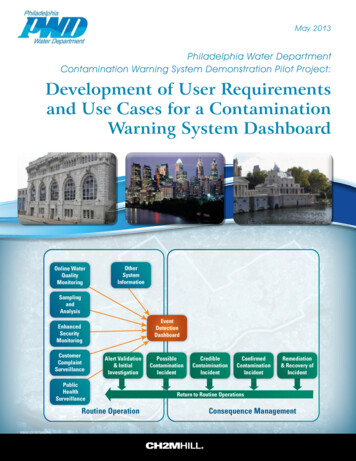
3 Selecting the right dashboardTo select the right dashboard we can use the dashboard selection model described in thefollowing paper - (Staron, Niesel et al. 2015) which is based on similar principles as(Mellegard, Staron et al. 2012). The dashboard selection model consists of seven categoriesdescribing seven aspects of dashboards.1. Type of dashboard - defining what kind of visualization is needed. Many dashboards areused as reports where the stakeholders input the data and require the flexibility of theformat -- the alternative is named report whereas some require a strictly pre-definedvisualization with the same structure for every update -- the alternative designated asdashboard. There is naturally a number of possibilities of combining the flexibility andthe strict format, which is denoted by the scale between fully flexible and fully strict.2. Data acquisition - defining how the data is input into the tool. In general thestakeholders/employees can enter the data into the tool -- e.g. making an assessment -the alternative is named manual or they can have the data being imported from othersystems -- this alternative is named automated. The previous selection of a dashboardfor visualization quite often correlates to the selection of the automated dataprovisioning.3. Stakeholders - defining the type of the stakeholder for the dashboard. The dashboardswhich are used as so-called information radiators often have an entire group as astakeholder, for example a project team. However, many dashboards which are designedto support decisions often have an individual stakeholder who can represent a group.4. Delivery - defining how the data is provided to the stakeholders. On the one hand theinformation can be delivered to a stakeholder in such forms as e-mails or MS Sidebargadgets -- the alternative is delivered or on the other hand it can be fetched, whichrequires the stakeholder to actively seek the information in form of opening a dedicatedlink and searching for the information -- which is denoted as fetched.5. Update - defining how often the data is updated. One alternative is to update the dataperiodically, for example every night with the advantage of the data being synchronizedbut with the disadvantage that it is not up-to-date. The other alternative is thecontinuous update which has the opposite effects on the timeliness and synchronization.6. Aim -- defining what kind of aim the dashboard should fulfill. One of the alternatives is touse the dashboard as an information radiator -- to spread the information to a broadaudience. The other option is to design the dashboard for a specific type of decision inmind, for example release readiness.7. Data flow - defining how much processing of the data is done in the dashboard. One ofthe alternatives is to visualize the raw data which means that no additionalinterpretation is done and the other is to add the interpretations by applying analysismodels and thus to visualize indicators.Graphically the dashboard selection model can be presented as a set of “sliders” which allowto prioritize between polar in these dimensions – as presented in Figure 2.Software Center metrics project3
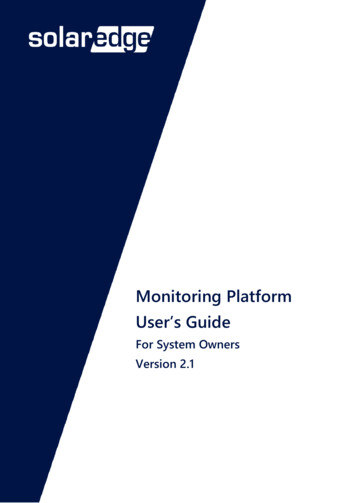
FIGURE 2. VISUAL REPRESENTATION OF DASHBOARD SELECTION MODELIn the published paper we provide more details on what kind of combination of sliderposition correspond to which type of a dashboard.However, regardless of the position of the slider or the type of the dashboard, eachdashboard has the same architecture which is based on the “layered” architecture style.4 Dashboard architectureThe layered architectural style is the most common one for dashboards as it allows toprocess the information as a “flow” without the need to provide star-like connectionsbetween all components of the dashboard. Depending on the type of the dashboard thesecomponent have different characteristics (e.g. wrt interactivity).FIGURE 3. TYPICAL ARCHITECTURE OF A DASHBOARDThe front end is naturally the part of the dashboard which is the most visible one, but farfrom being the most important one. Depending on the type of the dashboard the set-up ofthe front-end can differ significantly. For the reporting dashboards the front end needs to beSoftware Center metrics project4
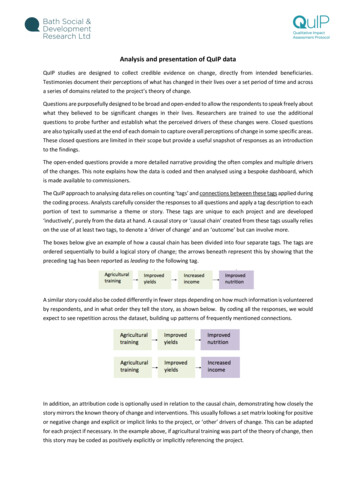
interactive and support easy-to-use data input (e.g. reporting of time) whereas thevisualization part is of less importance. For the information radiator dashboard the type thevisualization and graphical layout are the most important elements whereas the data input isalmost not required at all.The back end layer consists of all the components which support the visualization – datasources, files storing the metrics/indicators, scripts making predictions and similarcomponents. These components are necessary to store the data acquired from sourcesystems, allow to analyze the data and prepare for its visualization.The data acquisition layer is a set of scripts and programs used to collect the data fromsource systems. It could be metrics tools, static analysis tools, scripts for mining datarepositories and similar components. The responsibility of this layer is to harvest the datafrom the source systems (e.g. a source code repository) and place that data in form of metricvalues in the storage of the back end of the dashboard.Finally the components which are “outside” of the dashboard, but are crucial for adashboard to function (hence delineated using the dashed line) are the source systems.These systems are part of the normal operations of the company from which data can beacquired. Examples of such systems are source code repositories, defect databases, orintegration engines (e.g. Jenkins).5 Monitoring information qualityThe architecture presented in the dashboard is based on the pipes-and-filters architecturewith the data flow. Therefore it is important to monitor that the calculations are correct.For the we recommend to implement the information quality indicators based on theprevious research from the software center (Staron and Meding 2009) and (Staron andWohlin 2006).6 Dashboard contentA typical dashboard contains three elements: Heading explaining the content of the dashboard and its purpose Diagram visualizing the metrics Short explanation of the status and information in the diagramIn designing the pages of the dashboard the principles of cognitive perception abilitiesshould be taken into account, such as:1. Elements of the dashboard should be logically and conceptually related to each other2. The number of elements in the dashboard (diagrams, text fields, explanations, buttons)should be no more than 7 ( 2 if necessary) as this is the number of elements an averageperson can keep in the short term memory.3. The use of colors should be limited to the minimum and the colors should extrapolatethe diagrams and the important information in the dashboard.An example of a dashboard is presented in Figure 4, which presents a set of metrics forarchitecture of a software product. These metrics are logically connected and shows theSoftware Center metrics project5
changes in the architecture’s components, complexity of the architecture and changes to theinterfaces of the architecture. The dashboard is build using the Google chart framework.FIGURE 4. EXAMPLE OF A DASHBOARD - INTERACTIVE DASHBOARD FOR ARCHITECTURE METRICSAnother example of a dashboard (Figure 5) is the dashboard for the architecturaldependencies visualizing implicit relationships in the architecture based on the previousstudies in the software center (Staron, Meding et al. 2013) and outside (Mellegard, Staron etal. 2012). The dashboard contains only one diagram and shows how strongly differentarchitectural components (A-R) are connected to each other.Software Center metrics project6
FIGURE 5. ARCHITECTURAL DEPENDENCIES DASHBOARDThe presented dashboards illustrate the principles of using graphs to communicate theinformation and show the simplicity required to prepare a dashboard which should be aninformation radiator.The set of metrics which we collected as part of the literature studies, with the links to thecorresponding papers, is presented in Appendix A.7 TechnologiesThe choice of technology depends primarily on the use of the dashboard and the resourcesavailable. Below we presents a subset of technologies with a short description of theiradvantages and disadvantages.A number of technologies and framework exists which can support the development of adashboard, for example: Dashing.io (open source): http://dashing.io/ - a ready-to-use dashboard software basedon XML file links to the web server. The framework is simple to set up, but limited in itsgraphical abilities. It also requires a backbone processor of data as it cannot process thedata itself. The dash (free): https://www.thedash.com/ - an alternative to dashing.io, with similarrequirements on backbone processor scripts, but more flexible in terms of availablevisualizations (e.g. diagrams).Software Center metrics project7
Google dashboard (free): charts dashboard - a set of simple-to-set-up javascript and SVG basedcharts which can be customized very easily. The main advantage is that it is simple andeasy to use but it also requires backbone processing of the data.D3 (Data Driven Documents, open source): http://d3js.org/ - a more flexible (powerfuland expressive) alternative to Google charts/dashboard.Tibco Spotfire: ?gclid CjwKEAjwkK6wBRCcoK JBqn6VqhoCLO3w wcB – abusiness intelligence tool which allows to easily create drill-down reports anddashboards. The main advantage is that once the data is in a database the tool has agraphical way of creating the charts (no programming needed as in the previoustechniques); the main disadvantage is that it is commercial and that setting up thedatabase and importing the data requires programming and more effort than in the caseof the scripts for the previous techniques.Tableu: http://www.tableau.com/ and ctices-for-effective-dashboards - an alternative to Spotfire.Qlikview: http://www.qlik.com – another alternative to Spotfire8 Roles and responsibilitiesThe roles and responsibilities in the dashboard design reflect the roles in the internationalstandard ISO/IEC 15939 - Software and Systems Engineering – Measurement processes (IEEE2007) and the process of development of measurement systems (Staron and Meding 2009,Staron, Meding et al. 2009, Staron, Meding et al. 2011) and have been shown to beimportant for the robust design of the entire measurement program (Staron and Wohlin2006, Staron and Meding 2015). Table 1 presents the roles and responsibilities.TABLE 1. ROLES AND RESPONSIBILTIES IN DASHBOARD DEVELOPMENTRoleResponsibilityStakeholderProduct owner of the dashboard; acts as a customer for thedashboard providing: Information needs Evaluation of the dashboardMetric designerDesigner and developer of the dashboard; responsible for thetechnical part of the development and maintenance of thedashboard. In particular: Develop the dashboard Develop the visualization and update mechanisms Monitor the daily operation of the dashboardMeasurementSponsor paying for the development and maintenance of thesponsordashboard.MeasurementA specialist in the metrics area designing the metrics to be includedanalystin the dashboard; the responsibilities include: Designing of the metrics according to the internationalstandards ISO/IEC 15939, ISO/IEC 25xxx and metrology (e.g.fulfilling the properties of well-constructed measures)Software Center metrics project8
Metric championMeasurementlibrarianMeasurementprogram leaderAssessment of the validity of the metrics proposed by themetric champions Maintaining the validity of the metrics over timeA specialist in the product/process/management area proposingnew metrics/changes to the existing metrics based on theinformation needs of the organization, in particular: Articulate the information need for a particular area or metric Propose new base and derived measures, indicators Propose the measurement method and measurementfunction Support the metric designer and measurement analyst indefining the right metric and its visualization Develop the value proposition of the metrics (Staron andMeding 2015)A dedicated person for cataloguing the dashboards, metrics andrelated good/bad practices, in particular: Collecting the lessons’ learned from the usage of eachdashboard and metric Evaluate the value of the metrics Maintain the measurement experience base as specified inISO/IEC 15939Coordinating the measurement team and the measurementprogram; assuring that all relevant information needs areprioritized and satisfiedThe roles presented in the table can be either full-time or part-time roles depending on thesize of the organization and its measurement program. It is important, however, that thenumber of individuals is at least two – playing the roles of stakeholders and metricchampions on the one side and the designers and measurement analysts at the other side.9 Summary and wrap-upUsing dashboard for visualizing the organizational performance has gained a considerableattention in recent years. Together with the coining of the concept of information radiatorsfor Agile software development teams the number of frameworks supporting this kind ofinformation dissemination has increased exponentially.In this document we presented the main guidelines on how to develop a dashboard for anorganization. We have presented the process of selecting a dashboard, a tool for choosingthe type of the dashboard, principles of building a dashboard and a set of roles involved inthe development of a dashboard.Further readingIn this document we focused on dashboards for software development support. However,there exists a number of tutorials on how to construct a dashboard without the specificfocus on software engineering, for example:Software Center metrics project9
Visualization aspects in software engineering (focused on graphics): Telea, A. C.(2014). Data visualization: principles and practice. CRC Press (Telea 2014).Visualization of code repositories (Voinea, Telea et al. 2005, Telea and Auber 2008)Visualization of areas of interest in software architecture (Byelas and Telea 2006)Designing and building great dashboards: gn/#.VgwU5 mqqkoDigital dashboards: Strategic and tactical: lding dashboards that people love to use:http://www.cpoc.org/assets/Data/guide to dashboard design1.pdfExamples of 24 web dashboards: How to build an effective d gallery: board-gallery/Software Center metrics project10
Appendix A – Metrics portfolioFIGURE 6. MINDMAP WITH THE METRICS COLLECTED IN THE PORTFOLIOSoftware Center metrics project11
ProductProduct backlog Product backlog, -21843-9 5 Code coverage, 42-44930-7 3Readiness Readiness/Running tested features sion pdfs/Rawsthorne AgileMetrics v6d.pdf Number of passed acceptance tests, 42-44930-7 3Defects Defect backlog, 0950584910000832 642-44930-7 3 Defects carried over to next iteration,Http://ieeexplore.ieee.org/xpls/abs all.jsp?arnumber 1667571&tag 1 Number of External Trouble Reports (TR) 42-383144 12 # of system failures (ISO/IEC 25021) # of failures, QME #7 (ISO/IEC 25021) # of faults (ISO/IEC 25021) # of errors (ISO/IEC 25021) # of fatal errors (ISO/IEC 25021) Number of problem reports Critical problem reports per normalization unit per year Major problem reports per normalization unit per year Minor problem reports per normalization unit per year Problem reports per normalization unit per year Problem report fix response time formulas Major problem report fix response time Minor problem report fix response time Problem report fix response time Overdue problem report fix responsiveness formulas Major overdue problem report fix responsiveness Minor overdue problem report fix responsiveness Overdue problem report fix responsiveness On-time delivery formulas On time items delivery On time service delivery Service impact outage formulas Service impact all causes outage frequency per NU per year Service impact all causes outage downtime per NU per year Service impact product attributable outage frequency per NU per year Service impact product attributable outage downtime per NU per yearSoftware Center metrics project12
Network impact outage Network element impact outage frequency - Customer attributable Network element impact outage (weighted) downtime - Customer attributable Network element impact outage frequency - Product attributable Network element impact outage (weighted) downtime - Product attributable Engineering or installation caused outage formulas Engineering caused outage frequency Installation caused outage frequency Field replaceable unit returns formulas Early return index Long-term return rate Normalized one-year return rate Corrective fix quality Software fix quality Software problem reports formulas Critical software problem reports per normalization unit per year Major software problem reports per normalization unit per year Minor software problem reports per normalization unit per year Service quality formulas Defective service transactionsProduct properties Total product size, r 1609800 Maturity/Software reliability growth,Http://web.student.chalmers.se/ rakeshr/files/SRGM embedded journal.pdf Branding Product global awarenessMaintenance, http://ieeexplore.ieee.org/xpls/abs all.jsp?arnumber 131381Change Change count per X (e.g. category like fix, enhance, .1002/smr.412/epdfoper status, /epdfoper maintenance type, /epdfoper change effort, /epdfoper defect source, /epdfoper quality focus, /epdfoper change span, /epdfoper detection, /epdfoper change span, /epdfoper developer span, /epdf Average number of change size, /epdf Change request backlog, http://ieeexplore.ieee.org/stamp/stamp.jsp?tp &arnumber 565000 Number of changes per type, http://ieeexplore.ieee.org/stamp/stamp.jsp?tp &arnumber 565000Software Center metrics project13
Proportion of defect type ey.com/doi/10.1002/smr.412/epdf % of content changes per delivery, http://ieeexplore.ieee.org/stamp/stamp.jsp?tp &arnumber 565000 KLOC change to the code, http://ieeexplore.ieee.org/stamp/stamp.jsp?tp &arnumber 565000 Current change backlog, http://ieeexplore.ieee.org/stamp/stamp.jsp?tp &arnumber 565000 Code change metric (CM), custom, http://ieeexplore.ieee.org/stamp/stamp.jsp?tp &arnumber 565000 Change interval, /epdfTime Time trend in change count, /epdf Total test time, http://ieeexplore.ieee.org/stamp/stamp.jsp?tp &arnumber 565000 Time to close urgent software change requests p &arnumber 565000 % of duplicate and invalid change requests closed by p &arnumber 565000 % of on-time deliveries, http://ieeexplore.ieee.org/stamp/stamp.jsp?tp &arnumber 565000 Proportion of time trend, /epdf oDelayed, /epdfoSolved/unsolved, /epdfoRejected/non-rejected, /epdfoChange interval used to close urgent 2/smr.412/epdfTime trend in change count per maintenance r.412/epdfEffort Staff days expended/change type, http://ieeexplore.ieee.org/stamp/stamp.jsp?tp &arnumber 565000 Cost/delivery, http://ieeexplore.ieee.org/stamp/stamp.jsp?tp &arnumber 565000 Proportion of Change effort ey.com/doi/10.1002/smr.412/epdf Cost/activity, http://ieeexplore.ieee.org/stamp/stamp.jsp?tp &arnumber 565000 Change effort per, /epdfoactivity, /epdfomaintenance type, /epdfochange size, /epdfochange count, /epdfoorigin, /epdfProduct Software Reliability, http://ieeexplore.ieee.org/stamp/stamp.jsp?tp &arnumber 565000oTotal failures, http://ieeexplore.ieee.org/stamp/stamp.jsp?tp &arnumber 565000oMTTF, http://ieeexplore.ieee.org/stamp/stamp.jsp?tp &arnumber 565000oRemaining failures, http://ieeexplore.ieee.org/stamp/stamp.jsp?tp &arnumber 565000oTime to next failure, http://ieeexplore.ieee.org/stamp/stamp.jsp?tp &arnumber 565000Computer resource utilization, http://ieeexplore.ieee.org/stamp/stamp.jsp?tp &arnumber 565000Software Center metrics project14
Proportion of defect source ey.com/doi/10.1002/smr.412/epdf # of interruptions (ISO/IEC 25021) Complexity, http://ieeexplore.ieee.org/stamp/stamp.jsp?tp &arnumber 565000 Software maintainability, http://ieeexplore.ieee.org/stamp/stamp.jsp?tp &arnumber 565000DesignDesign stability Product/code stability, http://www.cse.chalmers.se/ miroslaw/papers/2013 mensura heatmaps.pdf System design instability, 016412120400007X Code churn, 42-44930-7 3 % Of ontime delivery of development projects, 074/pdfComplexity, Http://ieeexplore.ieee.org/xpls/abs all.jsp?arnumber 6747165 Model based, arnumber 4351352oAverage number of transitio
Dashboard type selection (see also section 3): the goal of this stage is to find the technology which is to be used to realize the dashboard. The result of this stage is a first prototype of the working dashboard as a feasibility study of the technology. Dashboard design: depending on the chosen technology the dashboard designers need