Transcription
Building Your SecondOperations Dashboard
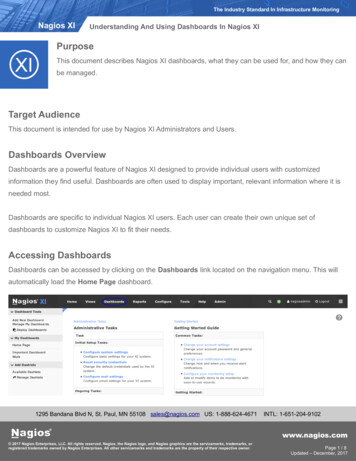
Lesson OverviewIn the first lesson for Operations Dashboard for ArcGIS, you constructed adashboard showing live wind and hail storms, as well as tornadoes, across theUnited States. In this lesson, you’ll build on the knowledge from the first lesson tocreate a real-time dashboard involving live and ongoing traffic accidentsthroughout the USA.This lesson includes six elements involving three maps (showing weather and roadconditions), two charts (detailing ongoing and recent accidents), and one header(which syncs all the dashboard elements). A sample of the completed dashboardcan be viewed here.Builds skills in Building the Operations Dashboard Tailoring data to your audience Constructing a meaningful interfaceSoftware Requirements ArcGIS Online account (create a free ArcGIS Public Account or get a free ArcGIStrial)Estimated Time 60 – 90 minutesExercise
Traffic crashes, collisions, and incidents, although more common in heavily populated areas,can occur anywhere. Similarly, they seem to occur more in foul conditions but can happenduring pleasant weather. In this lesson, you’ll build an Operations Dashboard that monitorsaccidents in real-time regardless of location or weather.(As you complete this lesson, keep in mind that the elements within your map originate withdifferent sources; as a result, loading times may vary among any one or several elements.)Step 1: Construct three mapsThe three maps must be created before you can construct the dashboard.1. Sign into ArcGIS Online.2. In ArcGIS Online, click the Map tab.Here, you’ll access World Traffic Service, an Esri map service.3. On the ribbon, click Add and select Browse Living Atlas Layers.4. In the search box, type World Traffic Service and press Enter.5. Click the blue World Traffic Service title for a description and explanation.
This pop-up explains the layer in detail, including traffic speeds and colors as well as detaileddescriptions.6. Close the box by clicking the X in the upper right corner.7. Click the Add button to download that layer to your map.8. Click the back button and click the Content tab.9. In Contents, click the black arrow to expand World Traffic Service.The World Traffic Service consists of groups of layers representing continents. Within eachcontinent group are layers of incidents in varying degrees of detail. You’ll need only the layerfor North America, so you’ll use a keyboard shortcut to turn off all the unneeded layers.10. On your keyboard, click and hold the Crtl button while, in Contents, checking NorthAmerica.All the red dots disappear on the map and the continental layers are turned off in Contents.11. Check North America.12. If necessary, expand and uncheck every sublayer within the North America layer; leave onlythe Traffic Incidents Detailed layer checked.The Traffic Incidents Detailed layer is grayed out because it’s visible only between one mile orless from the Earth’s surface.13. Zoom into any major American city until the map scale, in the lower left corner of the map,shows a scale with a maximum of one mile.Clicking any point on the map opens a pop-up, which specifies traffic-related incidents,construction, closures, accidents, etc.
14. Click any point on the map.You can add additional context by changing basemaps. By switching to Open Street Map, you’lladd meaningful information in terms of major roads users might recognize.15. Click Basemap and select Open Street Map.The World Traffic Service layer has a default interval setting of 5 minutes. You can change thatto update every minute to make your map as real-time as possible.16. On the World Traffic Service layer, click More Options and Refresh Interval.17. Change the interval from 5 to 1 minutes.18. Click Save and Save As.19. In the Save Map window: For Title, type Traffic Map 1 - Accidents For Tags, type traffic, accidents, real-time, USA. Press Enter after each tag For Summary, type Map researching USA real-time traffic accidents Save in your folder
Click Save Map.By resaving the same map using Save As, you can preserve the settings you just made and applythose changes to the duplicate map. This saves you time and effort with your second map.20. Resave the map, this time naming it Traffic Map 2 – Imagery.21. Zoom into to a scale from 0 to 600 feet and change the basemap to Imagery with Labels.22. In Contents, expand World Traffic Service.23. Check on the North America Traffic sublayer as well as its sublayer Traffic. (Leave the LiveTraffic sublayer unchecked.)In populated areas, you’ll see green, yellow, orange, and red lines representing trafficconditions.24. Save the map.You’re now ready for the third map, which will focus on weather.
25. On the ribbon, click New Map and Create New Map.Your map opens to a Topographic basemap of the continental United States. The map’s defaultis a scale of 0 to 300 miles. For your third map, you’ll focus on the Great Plains, an area in thecenter of your map where storms are frequent year-round. (If no storms are present, focus onany area within the United States showing turbulent weather.)26. Focusing on the Great Plains, zoom into a scale of 0 to 100 miles.27. Change the basemap to Streets, which emphasizes interstates, a meaningful referencepoint for drivers, a group often affected by adverse weather.28. Browse to a Living Atlas layer to the map called Recent Weather Radar Imagery by NOAAGeoPlatform.29. Add the layer to the map.
The data is live, so your map will look different. But this is a new map, and to save it, you mustcomplete the Save Map window.30. Click Save As, and in the map and in the Save Map window: For Title, type Traffic Map 3 – Weather. For Tags, type weather, real-time, USA (Press Enter after each tag.) For Summary, type Map researching USA real-time weather Save in your folder and click Save Map.All three maps are complete. Now, you’ll construct the Operations Dashboard.Q1. How does changing basemaps help your audience?A1.
Step 2: Construct the Operations Dashboard1. On the ribbon, click Home and Content.2. On the Content page, and in the folder you used to save the maps: check all three maps you created in the first step click Share Click Everyone (public) Click OK.3. Below the Content ribbon, click Create and Using Operations Dashboard.4. In the Create a web app window: For Title, type Recent Traffic Accidents For Tags, type traffic, accidents, real-time, USA
For Summary, type Web app researching real-time accidents Save in your folder Click OK.The dashboard is empty. You must import the elements.5. Click the plus button and select Map.
6. Select your first map, Traffic Map 1- Accidents, and in the Map box, click Done.After loading, this map consumes your entire screen.7. Add the second map, Traffic Map 2 – Imagery.The maps are evenly split.8. Drag the center divider left so the Streets map occupies most of the screen.You’ll add your third map, the weather map, and dock it to the top of the dashboard so it isanchored to the top row just above the imagery map.9. Add the weather map.10. In the weather map, point to the expandable blue bar and click and hold the Drag Item icon.11. Dock the map as a row above the imagery map. (As you drag the icon, a small blue andwhite box appears and shows where you need to drop the map.)After docking, the three maps are arranged so the streets map consumes two-thirds of thescreen while the weather and imagery maps each occupy about one-eighth of the screen.
You’ll add ruler scalebars to all three maps.12. For each map, point to the expandable blue box in the upper left corner, click Configure,click Scalebar ruler, and then Done.)13. Save.Q2. How do you adjust the elements within your map so your dashboard is easier tocomprehend? And are these changes permanent?A2.Step 3: Add a List to the DashboardThe next element you’ll add is a list of the most recent traffic conditions. You’ll enable panningand flashing, which by clicking an incident, centers the map and flashes its location. You’ll alsosynch the maps so they center on that incident. Together, you’re focusing all the elementswithin your dashboard on a single incident your audience wants.1. Click the plus button and select List.2. Click Traffic Incidents Detailed, North America Traffic Incidents. (This is the layer we’reworking with.)3. For Data Options, choose the List tab.4. In the Line Item Text box: For the top line, click the brackets button, select and bold Location, and press Enter.
For the middle line, add Full Description and press EnterFor the bottom, type Last Updated: and add lastupdated utctime. Put into italics.The list you just created shows all types of incidents. You just want to show accidents.5. Click the Data tab.6. Under Data Options: Click Filter In its drop-down menu, select incident type Click inside the empty Value field and select ACCIDENT Click Sort and select Descending
Click the General tab and edit the Title box by typing Most Recent Accidents. Put intobold.The Actions tab enables you to apply the same actions to all three maps.7. Click the Actions tab: Click Add Action and select Pan For Pan, click Add Target and select Traffic Map 1 – Accidents Repeat to add Traffic Map 2 – Imagery and Traffic Map 3 – Weather as targets Click Add Action and Flash For Flash, add all three maps as targets Click DoneThe list is added to the dashboard.
8. Using the expandable blue bar of Most Recent Accidents, click and hold the Drag Item anddock it to the right side of the app as a new column. Readjust the columns as necessary.9. Within Most Recent Accidents, click individual items and notice how the three maps readjustas they flash and zoom to the locations of the clicked accident.Q3. In the final steps, you got all three maps to sync with the Most Recent Accidents list.How does that help your audience?A3.Step 4: Add a Serial ChartA Serial Chart breaks down information in relation to time.1. Click the plus button and select Serial Chart.2. Click Traffic Incidents Detailed North America Traffic Incidents.The chart is empty. You’ll add the data.3. Under Data Options, in the Category Field, click the drop-down menu and selectstart utctime (may take moment to load).You’ll construct a filter to narrow the data to accidents occurring today.4. Click Filter and: In the first box, click the drop-down menu and select incidenttype In the Value box, click and select ACCIDENT Click And In the box, click and select start utctime
For Minimum Period, click the drop-down and change Day to MinuteAt the bottom of Data Options, Statistic is listed as Count, which means that, for each minute oftoday along the bottom axis, the number of traffic accidents that occurred within that minuteare counted along the left axis of the graph.You’ve done a lot of work on this Serial Chart. Now you need to clarify it for your audience.5. Click the General tab and edit the title by typing Accidents within the last 24 hours.6. Click the Category Axis tab and for Title, type Start Time of Accident.7. Click the Value Axis tab and for Title, type Count of Accident.8. Click Done.9. Dock the chart, as a row, to the bottom of the main map panel. Adjust the divider asnecessary.Q4. Look at the serial chart in step 8. What does this tell you? And what guesses couldyou make concerning the timing of these accidents?A4.
Step 5: Add a HeaderBy default, the dashboard’s title is the same as when you created it. Optionally, you couldchange the title by clicking the plus button and selecting Header.The Header, along the top of the screen, is the only element with five buttons. All the othershave four. You need to activate it first.1. Click the plus button and select Header.2. Point to the blue expandable bar, inside the header bar, and select Add Category Selector.3. Under Selector Options, for Categories From, select Features.4. Click Traffic Incidents Detailed North America Traffic Incidents.As before, you’ll construct a Filter that displays accidents.5. Click Filter and: Click inside the its box and select incidenttype Click inside the Value box and select ACCIDENT6. For Line Item Text, click Fields and, from the drop-down menu, select {location}.By default, the Maximum Categories is set to 50. You’ll change that setting so the single, andmost recent, accident displays.7. For Maximum Categories, change 50 to 1.To ensure that accident is the most recent, you’ll sort by start utctime descending.8. In the Sort By box: Click Sort Click inside the text box and select start utctime Click Descending
As you build the Selector, a window previews the changes.9. Under Selector, in the Label box, type Dashboard synched to:.Since we have one item to select, a drop-down makes no sense.10. For Preferred Display Type, click the box and select Button bar.Your Category Selector should resemble this image:As before, you’ll tie the Selector Options you just created with the pan and flash actions for allthree maps.11. Click the Actions tab.12. Click Add Action, select Pan, select Add Target, and add all three maps.13. Click Add Action, select Flash, select Add Target, and add all three maps.14. Click Done.The dashboard now contains all six elements: three maps, a list, a serial chart, and a header.The header contains a category selector that defaults to the most recent accident. Items in thelist are also selectable.
Finally, you want to verify that the public can see your dashboard, which contains informationfrom the Living Atlas.15. On the ribbon, click down arrow farthest to the right and select Subscriber Content.16. If necessary, click the Enabled button to the World Traffic Service.
Q5. What would happen if your subscriber content wasn’t enabled?A5.You’ve completed two lessons in which you constructed dashboards involving live weather andtraffic. In the third and final lesson, you’ll create a third dashboard with a live data feed aboutweather watches and warnings.
Exercise AnswerslQ1. How does changing basemaps help your audience?A1. Basemaps are the base layers providing context and detail for your reader. Changingbasemaps means finding a background that better illustrates the message you’re trying toconvey in your map.Q2. How do you adjust the elements within your map so your web app is easier tocomprehend? And are these changes permanent?A2. You can move the gray dividers or click and hold the Drag item icon and dock themap (or any element) to a location of your liking. No, these changes can be made any time.Q3. In the final steps, you got all three maps to sync with the Most Recent Accidents list.How does that help your audience?A3. By clicking the list, the Streets, Imagery with Labels, and Weather maps all sync withthe clicked report; by doing so, you immediately focus the attention of the audience onthe exact information they’re seeking. This saves the time of your audience and increasesthe relevance of your web app.Q4. Look at the serial chart in step 8. What does this tell you? And what guesses couldyou make concerning the timing of these accidents?A4. Most of the accidents occur in the early afternoon. You would need moreinformation to be more specific, but you could make an inference that these accidentsoccur while employees could be returning late from lunch.Q5. What would happen if your subscriber content wasn’t enabled?
A5. Your audience couldn’t see your work because your web app depends on a live feedof data from the Living Atlas.Esri License380 New York StreetRedlands, California 92373 – 8100 USACopyright 2019 EsriAll rights reserved.Printed in the United States of America.The information contained in this document is the exclusive property of Esri. This work isprotected under United States copyright law and other international copyright treaties andconventions. No part of this work may be reproduced or transmitted in any form or by anymeans, electronic or mechanical, including photocopying and recording, or by any informationstorage or retrieval system, except as expressly permitted in writing by Esri. All requests shouldbe sent to Attention: Contracts and Legal Services Manager, Esri, 380 New York Street,Redlands, CA 92373-8100 USA.
About the AuthorJason Smolinski is a Geospatial Analysis teacher at a Virginia high school.He’s a former GIS analyst.SupportIf you are unable to follow-through the workflow or having any issues with the lesson, you cancontact us with a detailed description via an e-mail. We will get in touch with you a possiblesolution.Share your WorkYou can share your lessons and any other educational resources with us through our LearnArcGIS Contributor program. Contact us with your idea.https://learn.arcgis.com/en/educators/
create a real-time dashboard involving live and ongoing traffic accidents throughout the USA. This lesson includes six elements involving three maps (showing weather and road conditions), two charts (detailing ongoing and recent accidents), and one header (which syncs all the dashboard elements). A sample of the completed dashboard