Transcription
Dashboard User's GuideRelease 9.0May 2015
ContentsAbout Dashboards . 5Navigating to the Dashboards Module . 5Working with Dashboards . 5Viewing Dashboards. 5Selecting Dashboards . 6Components in the Dashboard . 6Mouse-Over . 7Drill-Down . 7Using In-Line Filters . 7Modifying Filters and Display Options. 7Managing Dashboards . 9Creating a New Dashboard. 9Setting Dashboard Component Filters and Display Options. 10Working with Project Bubble Charts . 11Selecting the Filter and Display Options . 13Copying, Pasting or Deleting Dashboards . 13Sharing Dashboards. 14Available Dashboard Components . 14Alignment (Strategy) . 14Proposals (Charters) . 16Projects (Subcategory: General) . 16Projects (Subcategory: Count) . 20Projects (Subcategory: Cycle Time) . 23Projects (Subcategory: Finances) . 27Projects (Subcategory: Metrics). 31Resource . 32Legal Notices . 363
About DashboardsEnterpriseTrack Dashboards are designed to provide graphical displays of proposal, project,resource, finance information along various X axes like organization, time, classification fields,strategy nodes etc. It is highly flexible and enables you to create your own dashboards, sharebetween selected users, or globally to all dashboard viewers.EnterpriseTrack comes with a variety of pre-made dashboard widgets (components) that you canuse to build a specific dashboard view that meets the different needs of your business. Alldashboard widgets come with pre-built filters.Navigating to the Dashboards ModuleTo navigate to the Dashboards module: from the Top Navigation bar, select Go To Dashboards.Dashboards View, or from the Left Navigation bar, selectWorking with DashboardsIn This SectionViewing Dashboards . 5Managing Dashboards . 9Sharing Dashboards. 14Viewing DashboardsTo view dashboards:1) From the Top Navigation bar, select Go To Dashboards View. Your defaultdashboard is displayed.2) Use the Select Dashboards pull-down menu, to select the type of dashboard you want toview.5
Dashboard User's GuideSelecting DashboardsFrom the Select Dashboard pull down menu, you can view the list of available dashboards. Thedashboards are grouped with individual canvases under each group. My Dashboards Displays the dashboards that you have created.Shared DashboardsDisplays the dashboards that have been shared. You can copy and modify the shareddashboard.Pre-defined DashboardsThese dashboards are predefined in the system.Executive DashboardDisplays four high level visual reports: Project Count by Status Average cycle time by executive Aggregate Month-by-Month Financial Savings for all projects Associated Active MembersProject DashboardDisplays dashboards based on your project association. Project Timelines Primary Metrics Aggregate Month-by-Month Financial Savings for all projects Open Deliverables Open Tasks Open IssuesGlobal DashboardsThese dashboards can be viewed by all dashboard users.Components in the DashboardA component is a single graph that shows information on projects, proposals, resources, orfinances etc. A dashboard can contain multiple components. The table below describes the iconsthat are displayed on the component bar.IconsDescriptionClick to open the Inline Filter box. Inline Filters provide instantaccess to some of the most commonly used filter fields. InlineFilters are simple to use. For more information, see topic UsingIn-Line Filters.Click to set filters and display options for each component.6
Working with DashboardsIconsDescriptionClick to save a dashboard as a PDF file.Click to maximize the component screen.Click to minimize the component screen.Click to refresh the component.Click for a description of the component.Mouse-OverYou can mouse-over the components to view the values in the bars.Drill-DownOn some components, you can click on the bar to drill down to view detailed information. Theinformation is displayed either as a list or a graph.Using In-Line FiltersYou can use the In-line filters to quickly modify filter parameters without navigating to the detailedbutton on thefilter page associated with the dashboard component. Selecting the Inline Filtercomponent bar brings up a subset of filter parameters that you can modify. The dashboardcomponent is then refreshed based on the selected filter settings without disturbing the othercomponents on the page.Modifying the In-line FiltersTo modify the in-line filters and view the dashboard display, do the following:1) From My Dashboards, select a dashboard component you want to modify.2) Click the Inline Filtersicon.3) Change the filters you want to modify and click the Apply button. The dashboard component isupdated based on the filters you selected. When you select Apply, the change to the filtersettings are applied only for this session and is not remembered for the next time you displaythis dashboard. You can select Save to save these filter settings such that future displays ofthis component will use the new settings to begin with.Modifying Filters and Display OptionsYou can modify the filters, display options, and chart display options for each dashboardcomponent.Changing Dashboard Component FiltersTo change dashboard component filters, do the following:7
Dashboard User's Guide1) From the top banner of the component, click theEdit Filters and Display Optionsbutton.2) From the Filters tab, click theExpand All button to expand the filter categories. You canselect theCollapse All button to collapse the list. The filter list is either expanded orcollapsed based on the settings selected by your Administrator.3) Make the necessary changes and click the Apply button to set these filters for the current runof the component, or click the Save button to save the filter settings for future use.Changing Display OptionsYou can personalize the look of your dashboard component by adding or modifying the header,footer, vertical axis title, horizontal axis title, left and right tics. You can also change the generaldisplay by changing the chart color, font, font color, size, or the background color.To edit the general display options associated with a dashboard component, do the following:Edit Filter and Display Options button.1) From the top banner of the dashboard, click the2) Click the General Display Options tab.3) Click theExpand All button to expand the categories. You can select theCollapse Allbutton to collapse the list. The list is either expanded or collapsed based on the settingsselected by your Administrator.4) Select a default font and text size.5) From the color table, select a color from the drop-down menu and click on the Add button. Thecolors displayed are the colors used to create your dashboard. Click on the right or left arrowbuttons to rearrange the color selection order. Click Remove to remove that color from thecolor table.6) Enter a name to display on the Header, Vertical Axis Title, Horizontal Axis Title, and Footer.7) Choose a font, font size, alignment, font color, and background color. You can also choose todisable the Header, Vertical Axis, Horizontal Axis and Footer by clicking the Disable box.8) Make the necessary changes and click the Apply button to set these options for the currentrun of the component, or click the Save button to save the settings for future use.Changing Chart Display OptionsYou can change the way data is displayed on a dashboard component chart by selecting theChart Display Options tab. You can choose to display the data as bar charts (with horizontalstacking, or vertical stacking), or as line charts (with row lines, percent lines or stack lines), or aspie charts.Note: The allowed chart types may vary from component to componentdepending on the data and functionality.To edit the chart display options associated with a dashboard component, do the following:Edit Filter and Display Options button.1) From the top banner of the dashboard, click the2) Click the Chart Display Options tab.3) Click theExpand All button to expand the categories. You can select theCollapse Allbutton to collapse the list. The list is either expanded or collapsed based on the settingsselected by your Administrator.8
Working with Dashboards4) Select the type of chart (Bar or Line). Select the type of bar chart (Stack Bars, Group Bars, orRow Bars), Line chart (Row Lines, Stack Lines, or Percent Lines), or Pie chart.5) The options you see may vary based on the type of chart you chose. Make the necessarychanges and click the Apply button to set these options for the current run of the component,or click the Save button to save the chart settings for future use.Managing DashboardsThe Manage Dashboards screen allows you to create, copy, paste, and share dashboards. Youcan customize your dashboard by adding, editing, or deleting components that make up yourdashboard. Filters can also be set for each component.To access the Manage Dashboard screen, from the Top Navigation bar select Go To Dashboards Manage. If you are already viewing your dashboard, you can click on theManage icon.Creating a New DashboardFollow the steps below to create a new dashboard.1) Navigate to the Manage Dashboard screen by selecting Go To Dashboards ManageManagefrom the Top Navigation bar. If you are already viewing a dashboard, click on theicon.2) From the Tree pane, select the My Dashboard folder and click on theAdd icon. All newdashboards must be created under the My Dashboard folder. The system creates a folder(New) under My Dashboards.3) In the Details pane, enter the following information:a. Enter a name for this dashboard.b. Choose if you want this dashboard to be active. Only active dashboards can be run.c. Enter a description for this dashboard.d. Select if you want this to be your default dashboard. If you select Yes, then this dashboardis displayed when you select My Dashboards from the Top Navigation bar or the LeftNavigation bar.4) Click Save.Selecting Components and Customizing Layouts1) From the Tree pane, select the dashboard you created.2) Click theEdit button in List pane.Note: Make sure that all your pop-up blockers are inactive. Clicking theedit button will open the component gallery in a new window.The Edit Dashboard screen is displayed. The Edit Dashboard screen allows you to createcustom dashboard by using the drag-and drop feature to select components from the layoutgallery.9
Dashboard User's Guide3) Select a category from the Category pull-down menu to see all the components in a particularcategory (for example, Project, Resource etc.). The component gallery is displayed on left sideof the screen.4) Drag and drop the component into the layout grid.You can use the blue title bar to reposition the component on the layout grid. Click on the greenarrow at the bottom right corner of the component to dynamically resize the component. Youcan remove components by dragging them into theTrash.5) Once you have selected all your components, click the Save Layout button. You can changethe filters and other characteristics of the component after saving your initial layout.6) The Manage Dashboard screen is displayed again. In the List pane, select the first componentby clicking on it. The General, Filter, General Display Options, and the Chart DisplayOptions tabs are displayed in the Details pane.7) Click theEdit button in the Details pane. Select the General tab to make changes to thecomponent name, or select the Filter tab to modify the preset filter selection, or select theGeneral Display Options tab to modify the general display options, or select the ChartDisplay Options tab to modify the chart display options.8) Click theSave button, or clickCancel to discard your changes.9) Click the Done button to return to the My Dashboard page.Setting Dashboard Component Filters and Display OptionsYou can set filters, general display options, and chart display options for the new dashboards youcreate. From the Filter tab, you can set filters for your component. From the General DisplayOptions tab you can customize a component chart by adding header, footer, vertical axis,horizontal axis, left tics and right tics. You can also control the font, color, size, and backgroundcolor used in your charts. From the Chart Display Options tab, you can choose the type of chart(Bar or Line or Pie). You can also use the various options to customize how the bar or line chartsare displayed.You can selectively narrow the component filters and display options to enable only a subset ofthese settings to be editable, visible or editable/visible from the inline filter box by dashboardusers. Check the Visible box if you want this filter or setting to be visible when the user clicks onthe Edit Filters and Display Options iconon the component. Check the Editable box if youwant to allow users to set a different value for this filter, or display option. Check the In-line box ifthis filter will be available as an in-line filter option when the user clicks on the In-line filter icon.To set the properties of the component filters, do the following:1) From the Details pane on the Manage Dashboards page, click the Filters tab.2) Click the Edit button to edit the component filters.3) Edit the various filter parameters. Check the Visible checkbox if you want the dashboard userto view this parameter on the filter page. Check the Editable box if you want to allow thedashboard user to edit the parameter on the Edit Filters and Display Options page. As adashboard composer you can uncheck the Editable checkbox if you want certain filterparameters to remain unchanged. Check the Inline box if you want the parameter to appearon the Inline Filter box for this component. For more information on Inline Filters, see topicUsing Inline Filters.10
Working with Dashboards4) From the Details pane click the General Display Options tab.5) Click the Edit button to edit the general display options. Check the Visible checkbox if youwant the dashboard user to view this parameter on Edit Filters and Display Options page.Check the Editable box if you want to allow the dashboard user to edit this parameter.6) From the Details pane click the Chart Display Options tab.7) Click the Edit button to edit the chart display options. Check the Visible checkbox if you wantthe dashboard user to view this parameter on Edit Filters and Display Options page. Check theEditable box if you want to allow the dashboard user to edit this parameter.8) Click theSave button when you are finished making edits to the component filters anddisplay settings.Working with Project Bubble ChartsBubble charts can give you powerful insights into your projects by allowing you to show projects ina 2 dimensional chart, with each project represented by a bubble. Bubble chart provides extensiveparameter options.You can use various parameters for the X axis and the Y axis. Both axes allow for choosing from aset of discrete properties of projects or from a set of values that can vary with time as the projectproceeds. Discrete properties include: classification field, alignment mode, programs, processarea, division, strategies, custom field of type list, or finance aggregate, etc. The time-varyingstatus/values include: % completion, risk, finances, etc.The following is a list of all available parameter options: Organization – DivisionOrganization – Business UnitOrganization – LocationOrganization – RegionClassification – Functional AreaClassification – Process AreaClassification – Project SourceProgramsRiskPlan EffortActual Effort% CompletionProject StatusNumber of Open IssuesNumber of Closed IssuesNumber of Open ActivitiesNumber of Closed ActivitiesProject DurationInitial Planned DurationCurrent Planned DurationActual Duration11
Dashboard User's Guide Current StageProject End DateInitial Planned Project Start DateInitial Planned Project End DateCurrent Planned Project Start DateCurrent Planned Project End DateActual Project Start DateActual Project End DateStrategiesScorecardsProcessesProgramFinance AggregateProject Tracking DetailsProject TypeRoadmapProject ManagerYou can swap the X and Y axes for a visual rearrangement of the bubbles. You can choose fixedsize or have it based on effort, team members (including and excluding TBD), or financeaggregate values. The bubble color can also be fixed or be based on completion status, risk orschedule.Like the other dashboards, you can mouse over the bubbles for more information and click on thechart to drill down. When you maximize the component you can view the dashboard componentlegends like the bubble color, and size.If Finance Aggregate values are chosen as the parameter for the axes or for the bubble size, thenadditional dependent filters are shown to determine which finance values will be used for the chart.Creating a Project Bubble ChartTo create a project bubble chart, do the following:1) Navigate to the Manage Dashboard screen by selecting Go To Dashboards Managefrom the Top Navigation bar. If you are already viewing a dashboard, click on theManageicon.2) In the Tree pane, click on the name of your dashboard.3) In the List pane, click on theEdit button. The Edit Dashboards page is displayed.Note: Make sure that all your pop-up blockers are inactive.4) From the Category pull-down menu, select Projects. From the Subcategory pull-down menuselect General.5) Select the Project Bubble Chart dashboard components from the gallery and drag it into thelayout grid.6) Click the Save Layout button to save your dashboard layout.12
Working with DashboardsSelecting the Filter and Display OptionsManage Dashboards screen, select the Project Bubble Chart component1) From thefrom the List tab.2) Select the Filters tab from the Details pane and click on theEdit button.3) Choose an Initiative for the dashboard.4) From the Dashboard section, select the number of projects to show.5) Check the Inline box associated with each filter parameter if you want to be able to edit theseparameters using the Inline Filters screen.6) From the drop-down list select a parameter for the X axis and the Y-axis. If you selectedFinance Aggregate for X or Y axis, then you will see options to select a finance category,finance window, finance dataset, and specify a snapshot for plan.7) Select the bubble size. You can choose fixed or have it be based on effort, or team members(including or excluding TBDs).8) You can select if the bubble color should be fixed, based on completion status, risk, orschedule.9) Click on the Select Color link to choose a color. If you selected the bubble color to bedetermined by the Completion Status, then enter a percentage for the bubble colors.10) Click the Save button to save your changes.11) From the Details pane, select the General Display Options tab and click on the Edit button.Make the changes and click the Save button to save your changes.12) From the Details pane, select the Chart Display Options tab and click on the Edit button.Select if you want to enable bubble shadow, and choose the color, X offset, Y Offset and thewidth of the bubble shadow.13) Click the Save button to save your changes.Swapping X-Axis and Y-AxisTo swap the X-axis and Y-axis parameters, click the Inline Filtersbutton on the top banner ofthe Project Bubble Chart dashboard. From the Inline Filters screen, check the Swap X and Y Axischeckbox to swap the axis parameters. Click Apply to refresh the dashboard, or click Save tosave the changes.Copying, Pasting or Deleting DashboardsCopy and Paste DashboardsYou can use the Tree pane to copy an existing dashboard and paste it into My Dashboards. Youcan then edit the dashboard to add or delete components, or adjust filters.Copy icon.1) From the Tree pane, select the dashboard you want to copy and click on the2) Click on the My Dashboards folder and click on thePaste icon. A copy of the selecteddashboard is now in your My Dashboards folder.You can change the name of the dashboard by clicking on the Edit icon in the Details pane.13
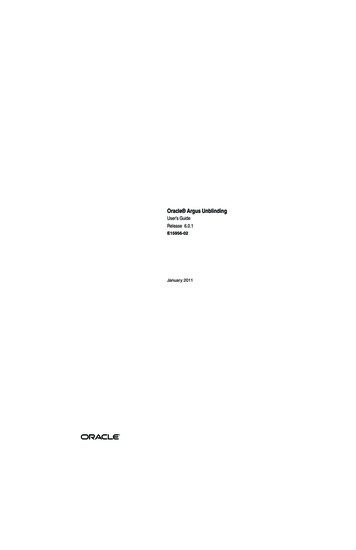
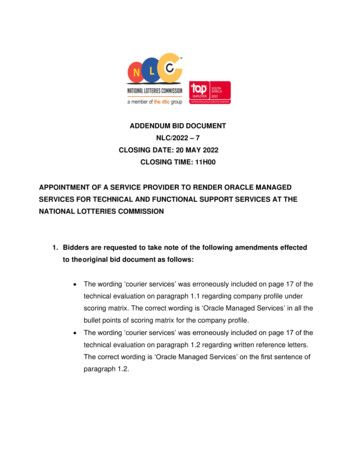
Dashboard User's GuideDelete DashboardsTo delete a dashboard, select the dashboard from the Tree pane and click on theDelete icon.Sharing DashboardsBased on your permissions, you may be able to share a dashboard. To share a dashboard:1)2)3)4)5)From the Manage Dashboards page, select the dashboard to be shared.From the Details pane click the Sharing tab.Edit button.Click theClick the Share Dashboard check box.Select the users you want to share this dashboard with, and specify the time period for whichthe dashboard should be shared. If you specify a time period, the dashboard will automaticallybe unshared when the time period comes to an end. You can also choose to allow other usersto copy your dashboard.6) Click theSave button, or clickCancel to discard your changes.Available Dashboard ComponentsAlignment (Strategy)The following dashboard components are available under this category:Alignment ListThis chart displays the list of child nodes with their Measure values for selected Alignment node.You can click on a link to drill down to next level in the Alignment hierarchy. You can also click ondata or chart icons on a particular row to change the view. If there is more than one Alignmentdefined in the system, you must select one Alignment to display as a default. You can change thislater.14
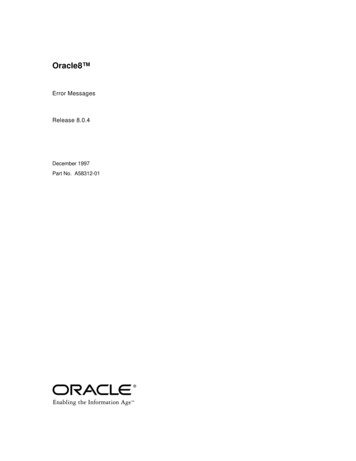
Available Dashboard ComponentsAlignment-Measure Time seriesThis chart displays Measure Data on Y-Axis for selected Alignment node and the reporting periodof X-Axis. For multi-Initiative system, choose an initiative that is to be displayed.Project % Completion by AlignmentThis chart displays the Percent Completion on Y-Axis for projects that qualify the filter criteria andProject Alignment (Strategy) on X-Axis. You can click on a bubble to drill down to the individualproject.Dashboard Component PropertiesComponent DataDataCategoryAvailable AvailableNamefor X-axis forY-axisAlignmentListAlignmentNodesAlignment- -Cate DefaultDrillgoryDownMeasureList, DataandChartAlignmentAlignme AlignmentProject % %Completion Complete ntbyAlignmentOptional SupportDrill Down edChartTypeTableLineProjectBasicsPageBubble15
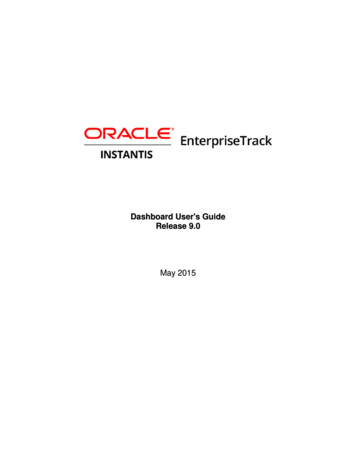
Dashboard User's GuideProposals (Charters)Proposal evaluation CriteriaThis chart displays bubble chart of proposal (charter) for Proposals (Charter) that qualify the filtercriteria. The X and Y Axis are represented by evaluation criteria. You must select the appropriateInitiative (if applicable) and the # of Proposal (Charter) to display. (Max 40 at a time).Dashboard Component PropertiesComponent DataDataCategoryAvailable AvailableNamefor X-axis e DefaultDrillgoryDownMeasureList, DataandChartOptional SupportDrill Down edChartTypeBubbleProjects (Subcategory: General)Project TimelinesThe chart displays project timeline by phases for projects that qualify the filter criteria. If you useprogram as a filter, then all projects belonging to the selected Program are displayed. You canalso select the display timeline (Actual and Plan, Actual, or Plan).16
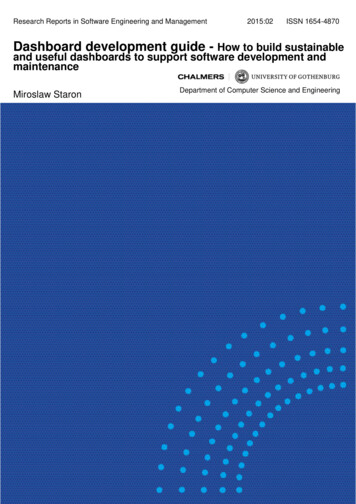
Available Dashboard ComponentsProject Activities ListThe chart displays the list of activities assigned to any user. You can filter the list to view Open, NotApplicable, Completed activities, Non-WBS, WBS, milestone, and key milestone activities. Youcan click on a link to drill down to view Activity details.Project Issues ListThe chart displays a list of project issues. You can filter to view issues that are not assigned to aresource. You can click on a link to drill down to view Issues details.Project Bubble ChartDisplays a project bubble chart based on your filter criteria. You can customize the chart byselecting the parameters to display on the X axis and Y axis. You can also swap the X and Y axisparameters. Click on a link to drill down to view the Project Basics page.My Project TimelinesThe chart displays project timeline by phases for projects that the user logged-in user is a teammember on. The set of these associated projects is shown as a list and you can choose whichones to display.17
Dashboard User's GuideThe Actual and Plan timelines are displayed This component is provided for backwardcompatibility. This component is deprecated for future use and the new Project Timelinescomponent (above) should be used instead.My Project Open Activities ListThis component displays a list of open activities on the projects that the logged-in user is a teammember on. There are no filters.This component is provided for backward compatibility. This component is deprecated for futureuse and the new Project Activities List component (above) should be used instead.My Project Issues ListThis component displays a list of Issues on the projects that the logged-in user is a team memberon There are no filtersThis component is provided for backward compatibility. This component is deprecated for futureuse and the new Project Issues List component (above) should be used instead.18
Available Dashboard ComponentsDashboard Component PropertiesComponent DataDataCategoryAvailable AvailableNamefor X-axis forY-axisSub-Cate DefaultOptional SupportedgoryDrill Down e tGeneralProjectRoadmapPageTableProjectIssues ListIssuesProjectGeneralProjectEdit IssuePageTableMy ProjectTimelinesGanttbarsTimeline ProjectGeneralProjectBasicsPageGanttMy rojectRoadmapPageTableMy ProjectOpenIssues ListIssuesProjectGeneralProjectEdit IssuePageTableMeasureList, Dataand ChartBubbleProposalEvaluationCriteriaProposal19
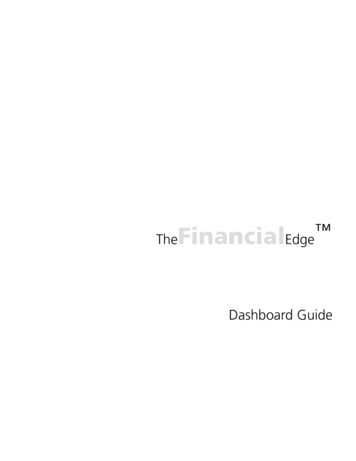
Dashboard User's GuideProjects (Subcategory: Count)Project Count by OrgThe chart displays the number of projects on Y-Axis that qualify the filter criteria and Organizationon X-Axis. You can select different level of organization to show on the X-Axis from the filtercriteria. Projects that aligned to multiple organizations will be counted in multiple organizations.You can click on a bard to drill down to the list of projects that contribute to the bar.Project Count by PeriodThe chart displays number of projects on Y-Axis that qualify the filter criteria and reporting periodon X-Axis. Projects that start in one year and end in the next year will be counted in both years.Current quarter figures are as of the current date. Current year is displayed as YYYYYTD e.g.2009YTD. YTD means Year to Date. Prior quarter and year-end figures are as of the last day ofthe period. Click on a bar to drill down to the list of projects that contribute to the bar.Project Count by StatusThe chart displays the number of projects on Y-Axis that qualify the filter criteria and CurrentProject Status on X-Axis. The chart shows system wide project counts, except confidentialprojects, depending on t
If you are already viewing your dashboard, you can click on the . Manage. icon. Creating a New Dashboard . Follow the steps below to create a new dashboard. 1) Navigate to the . Manage Dashboard. screen by selecting . Go To Dashboards Manage. from the Top Navigation bar. If you are already viewing a dashboard, cl ick on the . Manage. icon. 2 .