Transcription
Analysis/Intelligence:Dashboard MetricsUser Guide(Intelligence and Premium)Last Revised: April 26 2010
Table of ContentsDashboard Metrics (Intelligence and Premium) .1Section 1: Overview .1Replacing Reports. 2More Than Six Reports . 4Without the Dashboard . 4Section 2: Dashboard Metrics Descriptions and Samples .5Name: Advance Air Purchases Booked Average . 5Description . 5Sample. 5Name: Air, Hotel, & Car Expensed (Year Over Year) . 6Description . 6Sample. 6Name: Average Booked Air Ticket Cost . 7Description . 7Sample. 7Name: Average Difference Expensed vs. Negotiated . 8Description . 8Sample. 8Name: Average Hotel Night Expenses Year Over Year . 9Description . 9Sample. 9Name: Average Monthly Cell Phone Expensed . 10Description . 10Sample. 10Name: Booked by Airline . 11Description . 11Sample. 11Name: Booked by Car Rental Company . 12Description . 12Sample. 12Name: Booked by Hotel . 13Description . 13Sample. 13Name: Cliqbook vs. Agent Booking Percentage. 14Description . 14Sample. 14Name: Expense Report Approval Aging . 15Description . 15Sample. 15Name: Expense Reports Submitted. 16Description . 16Sample. 16Name: Expense Reports Submitted Year Over Year . 17Description . 17Sample. 17Name: Expensed By Airline . 18Analysis/Intelligence: Dashboard Metrics User GuideLast Revised: April 26 2010 2004 - 2022 SAP Concur All rights reserved.i
Description . 18Sample. 18Name: Expensed by Car Rental Company . 19Description . 19Sample. 19Name: Expensed by Cell Phone Provider. 20Description . 20Sample. 20Name: Expensed by Hotel . 21Description . 21Sample. 21Name: Hotel Expensed Cost Trend. 22Description . 22Sample. 22Name: Hotel Expensed vs. Booked Average Difference . 23Description . 23Sample. 23Name: Invoice Approval Aging . 24Description . 24Sample. 24Name: Invoice Cycle Time . 25Description . 25Sample. 25Name: Invoice Cycle Time Segments . 26Description . 26Sample. 26Name: Invoice Expense Type Spend Trend . 27Description . 27Sample. 27Name: Invoice Requests Processed Year Over Year . 28Description . 28Sample. 28Name: Invoice Spend by Expense Type . 29Description . 29Sample. 29Name: Invoice Spend by Vendor . 30Description . 30Sample. 30Name: Invoices Processed per AP User. 31Description . 31Sample. 31Name: Invoices Processed per Origination Source . 32Description . 32Sample. 32Name: Overall Invoice Vendor Spend . 33Description . 33Sample. 33Name: Percent Air Advance Purchase Window . 34Description . 34Sample. 34iiAnalysis/Intelligence: Dashboard Metrics User GuideLast Revised: April 26 2010 2004 - 2022 SAP Concur All rights reserved.
Name: Percent Approved Reports with Uncleared Exceptions . 35Description . 35Sample. 35Name: Percent Invoice Requests with Uncleared Exceptions . 36Description . 36Sample. 36Name: Spend Trend by Expense Type . 37Description . 37Sample. 37Name: Tickets Booked by Airline . 38Description . 38Sample. 38Name: Top 10 Expense Types Average MTD vs. YTD . 39Description . 39Sample. 39Name: Top 10 Invoice Expense Types Average MTD vs. YTD . 40Description . 40Sample. 40Name: Top 10 Invoice Vendors . 41Description . 41Sample. 41Name: Top 15 Cities Average Hotel Rate . 42Description . 42Sample. 42Name: Top 15 Exception Codes . 43Description . 43Sample. 43Name: Top 15 Expense Types by Spend . 44Description . 44Sample. 44Name: Total Airline Ancillary Fees. 45Description . 45Sample. 45Name: Total Expensed by Month . 45Description . 45Name: Total Invoice Requests Processed . 46Description . 46Sample. 46Name: Total Invoice Spend by Expense Type . 47Description . 47Sample. 47Name: Total Invoice Spend by Expense Type Trend . 48Description . 48Sample. 48Name: Total Invoice Spend by Month . 49Description . 49Sample. 49Analysis/Intelligence: Dashboard Metrics User GuideLast Revised: April 26 2010 2004 - 2022 SAP Concur All rights reserved.iii
Revision HistoryDateRevision Notes/CommentsJanuary 13, 2022Updated the copyright year; no other changes; cover date not updatedMarch 29, 2021Updated the copyright year; no other changes; cover date not updatedFebruary 4, 2020Updated the copyright; no other changes; cover date not updatedMarch 6, 2019Updated the copyright; no other changes; cover date not updatedApril 5, 2018Updated the copyright; no other changes; cover date not updatedDecember 16 2016Changed copyright; no other content changes.January 19 2016Changed from book "chapters" to stand-alone guides; no content changesApril 9 2015Changed the name of Concur Insight to Analysis/Intelligence; no other contentchangesMarch 10 2014Changed the name of Analysis/Intelligence to Concur Insight; updated thecopyright; no other content changesJanuary 21 2011Updated the copyright; no content changeApril 26 2010Added samples of the metricsApril 16 2010Added this metric report: Total Airline Ancillary FeesMarch 19 2010Added these metrics: Average Difference Expensed vs. Negotiated Booked by Airline Booked by Car Rental Company Booked by Hotel Percent Air Advance Purchase Window Top 15 Cities Average Hotel Rate Top 15 Exception CodesivFebruary 19 2010Changed the chapter number from 7 to 8January 15 2010Added Invoice metrics that can be added to the dashboardOctober 16 2009Dashboard Metrics folder moved from Public Folders Concur Intelligence- Standard Reports to Public FoldersSeptember 18 2009Initial publicationAnalysis/Intelligence: Dashboard Metrics User GuideLast Revised: April 26 2010 2004 - 2022 SAP Concur All rights reserved.
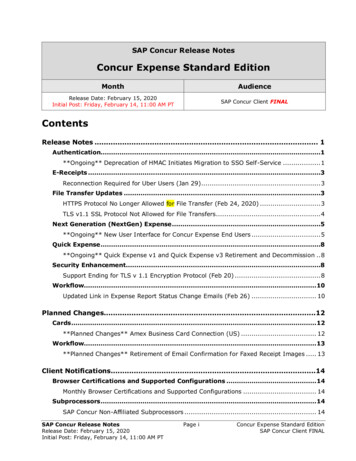
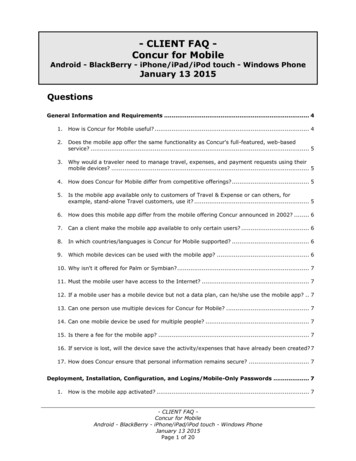
Section 1: OverviewDashboard Metrics (Intelligence and Premium)Section 1: OverviewThe Concur Dashboard is available to Intelligence and Premium clients. Thisfeature allows the user to see a variety of key metrics in a single view.Upon first login after the release, the dashboard tab appears on the Intelligence userlanding page.Click the tab. The following page appears.This sample shows two ofthe six default reports.Analysis/Intelligence: Dashboard Metrics User GuideLast Revised: April 26 2010 2004 - 2022 SAP Concur All rights reserved.1
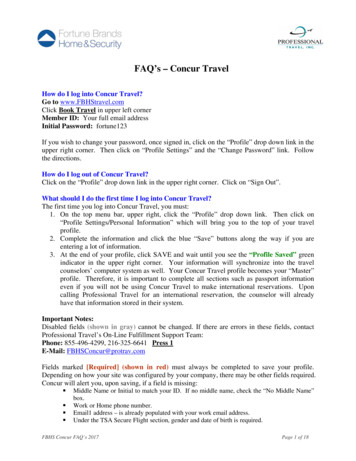
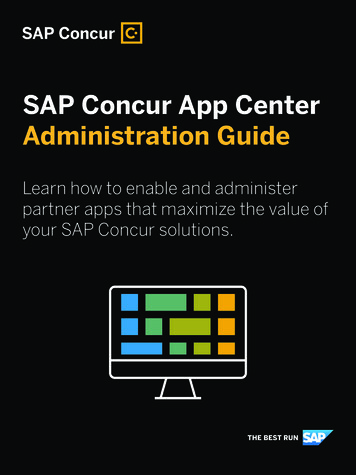
Section 1: OverviewThe following reports (known as dashboard metrics reports) appear on thedashboard: Air, Hotel, & Car Expensed (YearOver Year) Expense Report Approval Aging Expense Reports Submitted Hotel Expensed Cost Trend Top 10 Expense Types (AverageMTD vs. YTD) Total Expensed By MonthBy default, the above-listed six reports appear but the user can choose from any ofthe dashboard metrics reports listed in Dashboard Metrics Descriptions in thischapter.Replacing ReportsYou can replace any of the six default reports with any of the other reports.To replace a dashboard metrics report:1. Each report on the dashboard contains an editbutton in the upper rightcorner. Click the edit button on the report that you want to replace.The properties page for that report appears.2Analysis/Intelligence: Dashboard Metrics User GuideLast Revised: April 26 2010 2004 - 2022 SAP Concur All rights reserved.
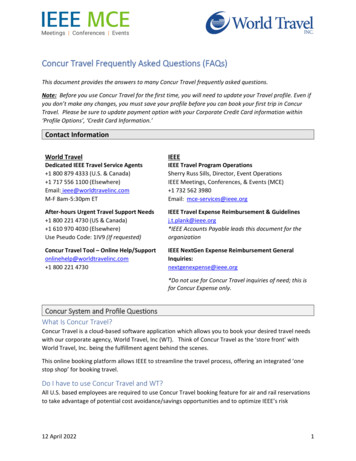
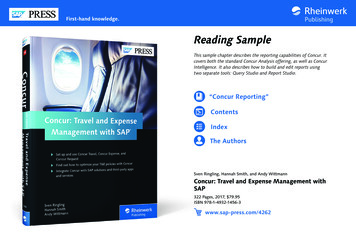
Section 1: Overview2. Click the Select an entry link.The list of all available reports appears.3. Select the desired report.4. Click OK. The report properties page again appears.5. Click OK to return to the dashboard. Once there, the selected report appears.Analysis/Intelligence: Dashboard Metrics User GuideLast Revised: April 26 2010 2004 - 2022 SAP Concur All rights reserved.3
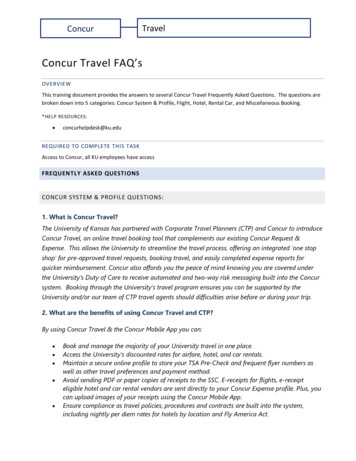
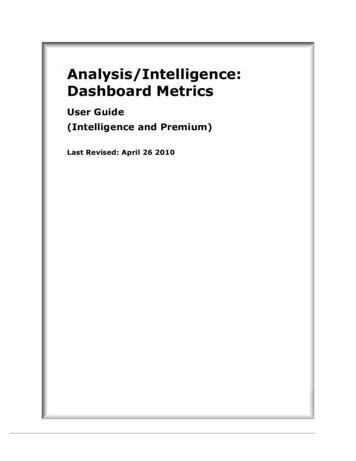
Section 1: OverviewMore Than Six ReportsIn the process describedabove, the user can tradeany of the six reports forother reports. In reality,the user is not limited tosix reports on thedashboard.For more information, clickHelp in the upper rightcorner and review the information about "pages" and "page properties." In addition,if you want the dashboard tab to be visible when you log in, move the tab to the leftmost tab position.Without the DashboardAll of these reports are available to be run individually, outside the ConcurDashboard at Public Folders Dashboard Metrics.4Analysis/Intelligence: Dashboard Metrics User GuideLast Revised: April 26 2010 2004 - 2022 SAP Concur All rights reserved.
Section 2: Dashboard Metrics Descriptions and SamplesSection 2: Dashboard Metrics Descriptions and SamplesUnless documented specifically for the report, all charts default to calendar year-todate. All reports have a second choice of date range that read Months and Years.For all charts that have a prompt for the Year to Date date range type, you canselect calendar or fiscal year.Name: Advance Air Purchases Booked AverageDescriptionThis report shows the average number of days that airline tickets were purchasedbefore the flight was taken.SampleAnalysis/Intelligence: Dashboard Metrics User GuideLast Revised: April 26 2010 2004 - 2022 SAP Concur All rights reserved.5
Section 2: Dashboard Metrics Descriptions and SamplesName: Air, Hotel, & Car Expensed (Year Over Year)DescriptionThis report shows the amount of spend year-over-year for air, car, and hotel.Sample6Analysis/Intelligence: Dashboard Metrics User GuideLast Revised: April 26 2010 2004 - 2022 SAP Concur All rights reserved.
Section 2: Dashboard Metrics Descriptions and SamplesName: Average Booked Air Ticket CostDescriptionThis report shows the average cost of purchased airline tickets, by month.SampleAnalysis/Intelligence: Dashboard Metrics User GuideLast Revised: April 26 2010 2004 - 2022 SAP Concur All rights reserved.7
Section 2: Dashboard Metrics Descriptions and SamplesName: Average Difference Expensed vs. NegotiatedDescriptionThis report shows the average dollar difference between the hotels negotiated nightlyrate and the actual nightly rate amount paid.Sample8Analysis/Intelligence: Dashboard Metrics User GuideLast Revised: April 26 2010 2004 - 2022 SAP Concur All rights reserved.
Section 2: Dashboard Metrics Descriptions and SamplesName: Average Hotel Night Expenses Year Over YearDescriptionThis report shows the average hotel night rate.Set the dial so that anything between 150 - 200 would be in yellow and anythingover 200 would be in red like the below example.SampleAnalysis/Intelligence: Dashboard Metrics User GuideLast Revised: April 26 2010 2004 - 2022 SAP Concur All rights reserved.9
Section 2: Dashboard Metrics Descriptions and SamplesName: Average Monthly Cell Phone ExpensedDescriptionThis report shows the average monthly cell phone expensed per report (not totalmonthly spend).Sample10Analysis/Intelligence: Dashboard Metrics User GuideLast Revised: April 26 2010 2004 - 2022 SAP Concur All rights reserved.
Section 2: Dashboard Metrics Descriptions and SamplesName: Booked by AirlineDescriptionThis report shows the total number of booked tickets by airline vendor purchasedthrough Cliqbook.SampleAnalysis/Intelligence: Dashboard Metrics User GuideLast Revised: April 26 2010 2004 - 2022 SAP Concur All rights reserved.11
Section 2: Dashboard Metrics Descriptions and SamplesName: Booked by Car Rental CompanyDescriptionThis report shows the total number of car rentals by vendor purchased throughCliqbook.Sample12Analysis/Intelligence: Dashboard Metrics User GuideLast Revised: April 26 2010 2004 - 2022 SAP Concur All rights reserved.
Section 2: Dashboard Metrics Descriptions and SamplesName: Booked by HotelDescriptionThis report shows the total number of hotel reservations by hotel property purchasedthrough Cliqbook.SampleAnalysis/Intelligence: Dashboard Metrics User GuideLast Revised: April 26 2010 2004 - 2022 SAP Concur All rights reserved.13
Section 2: Dashboard Metrics Descriptions and SamplesName: Cliqbook vs. Agent Booking PercentageDescriptionThis report shows the percent of online adoption by tickets.Sample14Analysis/Intelligence: Dashboard Metrics User GuideLast Revised: April 26 2010 2004 - 2022 SAP Concur All rights reserved.
Section 2: Dashboard Metrics Descriptions and SamplesName: Expense Report Approval AgingDescriptionThis report shows aging of expense report approved, based on the submit date tothe approved date (based on processor start date).SampleAnalysis/Intelligence: Dashboard Metrics User GuideLast Revised: April 26 2010 2004 - 2022 SAP Concur All rights reserved.15
Section 2: Dashboard Metrics Descriptions and SamplesName: Expense Reports SubmittedDescriptionThis report shows the number of expense reports submitted by month.Sample16Analysis/Intelligence: Dashboard Metrics User GuideLast Revised: April 26 2010 2004 - 2022 SAP Concur All rights reserved.
Section 2: Dashboard Metrics Descriptions and SamplesName: Expense Reports Submitted Year Over YearDescriptionThis report shows the number of expense reports submitted year-over-year.SampleAnalysis/Intelligence: Dashboard Metrics User GuideLast Revised: April 26 2010 2004 - 2022 SAP Concur All rights reserved.17
Section 2: Dashboard Metrics Descriptions and SamplesName: Expensed By AirlineDescriptionThis report shows the total amount spent on the airfare expense type, grouped byvendor.Sample18Analysis/Intelligence: Dashboard Metrics User GuideLast Revised: April 26 2010 2004 - 2022 SAP Concur All rights reserved.
Section 2: Dashboard Metrics Descriptions and SamplesName: Expensed by Car Rental CompanyDescriptionThis report shows the total amount spent on the car expense type, grouped byvendor.SampleAnalysis/Intelligence: Dashboard Metrics User GuideLast Revised: April 26 2010 2004 - 2022 SAP Concur All rights reserved.19
Section 2: Dashboard Metrics Descriptions and SamplesName: Expensed by Cell Phone ProviderDescriptionThis report shows the total amount spent on the cell phone expense type, groupedby vendor.Sample20Analysis/Intelligence: Dashboard Metrics User GuideLast Revised: April 26 2010 2004 - 2022 SAP Concur All rights reserved.
Section 2: Dashboard Metrics Descriptions and SamplesName: Expensed by HotelDescriptionThis report shows the total amount spent on the hotel expense type, grouped byvendor.SampleAnalysis/Intelligence: Dashboard Metrics User GuideLast Revised: April 26 2010 2004 - 2022 SAP Concur All rights reserved.21
Section 2: Dashboard Metrics Descriptions and SamplesName: Hotel Expensed Cost TrendDescriptionThis report shows the hotel cost trend.Sample22Analysis/Intelligence: Dashboard Metrics User GuideLast Revised: April 26 2010 2004 - 2022 SAP Concur All rights reserved.
Section 2: Dashboard Metrics Descriptions and SamplesName: Hotel Expensed vs. Booked Average DifferenceDescriptionThis report shows the average dollar difference found between the reserved hotelnightly rate and the expensed hotel nightly rate.SampleAnalysis/Intelligence: Dashboard Metrics User GuideLast Revised: April 26 2010 2004 - 2022 SAP Concur All rights reserved.23
Section 2: Dashboard Metrics Descriptions and SamplesName: Invoice Approval AgingDescriptionThis report shows the length of time each invoice took to be approved.Sample24Analysis/Intelligence: Dashboard Metrics User GuideLast Revised: April 26 2010 2004 - 2022 SAP Concur All rights reserved.
Section 2: Dashboard Metrics Descriptions and SamplesName: Invoice Cycle TimeDescriptionThis report shows the average length of time an invoice takes from creation to beingpaid.SampleAnalysis/Intelligence: Dashboard Metrics User GuideLast Revised: April 26 2010 2004 - 2022 SAP Concur All rights reserved.25
Section 2: Dashboard Metrics Descriptions and SamplesName: Invoice Cycle Time SegmentsDescriptionThis report shows the average length of time an invoice is at a given stage of thepayment lifecycle.Sample26Analysis/Intelligence: Dashboard Metrics User GuideLast Revised: April 26 2010 2004 - 2022 SAP Concur All rights reserved.
Section 2: Dashboard Metrics Descriptions and SamplesName: Invoice Expense Type Spend TrendDescriptionThis report shows the spending trend for a user-selected Invoice expense type.SampleAnalysis/Intelligence: Dashboard Metrics User GuideLast Revised: April 26 2010 2004 - 2022 SAP Concur All rights reserved.27
Section 2: Dashboard Metrics Descriptions and SamplesName: Invoice Requests Processed Year Over YearDescriptionThis report shows the number of invoices processed by month, in comparison toprevious years.Sample28Analysis/Intelligence: Dashboard Metrics User GuideLast Revised: April 26 2010 2004 - 2022 SAP Concur All rights reserved.
Section 2: Dashboard Metrics Descriptions and SamplesName: Invoice Spend by Expense TypeDescriptionThis report shows the approved amount for a user-selected Invoice expense type.SampleAnalysis/Intelligence: Dashboard Metrics User GuideLast Revised: April 26 2010 2004 - 2022 SAP Concur All rights reserved.29
Section 2: Dashboard Metrics Descriptions and SamplesName: Invoice Spend by VendorDescriptionThis report shows the approved amount for a user-selected Invoice vendor.Sample30Analysis/Intelligence: Dashboard Metrics User GuideLast Revised: April 26 2010 2004 - 2022 SAP Concur All rights reserved.
Section 2: Dashboard Metrics Descriptions and SamplesName: Invoices Processed per AP UserDescriptionThis report allows the client to evaluate the efficiency of their AP Users.SampleAnalysis/Intelligence: Dashboard Metrics User GuideLast Revised: April 26 2010 2004 - 2022 SAP Concur All rights reserved.31
Section 2: Dashboard Metrics Descriptions and SamplesName: Invoices Processed per Origination SourceDescriptionThis report allows the user to track the percentage of invoices created by differentmethods, including manually, electronically, and via Intelligent Capture.Sample32Analysis/Intelligence: Dashboard Metrics User GuideLast Revised: April 26 2010 2004 - 2022 SAP Concur All rights reserved.
Section 2: Dashboard Metrics Descriptions and SamplesName: Overall Invoice Vendor SpendDescriptionThis report shows the top five Invoice vendors.SampleAnalysis/Intelligence: Dashboard Metrics User GuideLast Revised: April 26 2010 2004 - 2022 SAP Concur All rig
the dashboard metrics reports listed in Dashboard Metrics Descriptions in this chapter. Replacing Reports You can replace any of the six default reports with any of the other reports. To replace a dashboard metrics report: 1. Each report on the dashboard contains an edit button in the upper right corner.