Transcription
A Guide to Accessible Content for OracleBusiness Intelligence Suite Enterprise EditionPlusAn Oracle White PaperDecember 2009
Oracle White Paper—A Guide to Accessible Content for OBIEE
Oracle White Paper— A Guide to Accessible Content OBIEE Introduction . 1For Those New to the Issue of Accessibility. 2Starting Resources . 2For End Users . 2Keyboard Navigation . 2Notes for Screen Reading Software. 5BI Publisher: Turning on Accessibility Mode for the UI. 6IR & EPM Workspace: End User selection of Accessibility Mode . 8For Developers. 9Common Misconceptions . 9General Guidelines for Creating Accessible Content . 9Dashboard Specific Guidelines. 11OBIEE Specific Techniques for Implementing Accessibility . 13Oracle Dashboards: Turning on Accessibility Mode. 13Oracle Dashboards: Optional Accessibility Settings. 14Oracle Dashboards: Specific Content Techniques. 14BI Publisher: Turning on Accessibility Mode for Output. 27BI Publisher: Creating Accessible Content Templates . 28IR & EPM Workspace: Turning on Accessibility Mode . 30Accessible Ad Hoc Queries: Setting up for Casual Users . 33Accessible Ad Hoc Queries: Setting up for Power Users . 33Accessible Scheduling: Setting up the EPM Workspace. 36Conclusion . 37
IntroductionOracle Business Intelligence Suite Enterprise Edition Plus (OBIEE ) is used by manypeople in different organizations. Not everyone has mobility in his or her hands, perfecteyesight, or other physical skills which software designers too often take for granted.The accessibility features in the OBIEE aim to make aspects of navigating and using theproduct easier for persons with disabilities and for the aging population. The accessibilityfeatures support the use of standards based assistive technology hardware andsoftware. These OBIEE accessibility features fall into three general categories: Features used by third party assistive technology products. These featurescenter on providing a user interface (UI) which consists of standard HTMLrdelements that can be easily interpreted by 3 party assistive technologyproducts. Content design capabilities that make it possible for content creators to build BIcontent that supports users with accessibility needs. Keyboard shortcuts that make it easier to navigate content for users with limitedor no ability to use a mouse.1
For Those New to the Issue of AccessibilityWhen creating content that will be consumed by a wide variety of users, providing supportfor users with various disabilities is not simply a good idea – it is a legal requirement in mostlocations throughout the world.Discussion about accessibility, across the IT industry, can be found in several publishedbooks. This guide does not intend to duplicate those works. Accessibility standards andlegislation exist, such as the World Wide Web Consortium (W3C), and Section 508 of theU.S. Rehabilitation Act.Starting ResourcesFor more information regarding accessibility, please refer to the links below: U.S. Section 508http://www.section508.gov/ U.S. Section 508 Refreshhttp://www.access board.gov/sec508/update index.htm Web Content Accessibility Guidelines 1.0 (WCAG 1.0)http://www.w3.org/TR/WCAG10/ Starting Resources Web Content Accessibility Guidelines 2.0 (WCAG 2.0)http://www.w3.org/TR/WCAG/ Roadmap for Accessible Rich Internet Applications (WAI ARIA)http://www.w3.org/TR/aria roadmap/For End UsersThe information in this section is targeted for end users of the content delivered in an OBIEE installation. It provides details about keyboard navigation and the proper methods for turningon Accessibility Mode in the various OBIEE modules.Keyboard NavigationA variety of keyboard equivalents are provided by Oracle Dashboards, BI Publisher, EPMWorkspace, Interactive Reporting and Smart View.For the keyboard information for the EPM System 11 components, please refer to Appendix A,Accessibility in the EPM Workspace User’s Guide located on the Oracle Technology Network athttp://download.oracle.com/docs/cd/E12825 01/epm.111/bpmui user.pdf.2
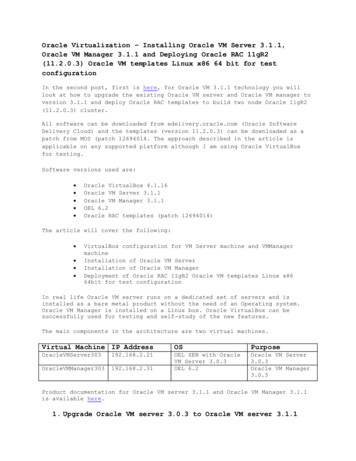
The available keyboard commands for Oracle Dashboards and BI Publisher are listed here,grouped based on module, menu and control as listed below.Keyboard Accelerators within Oracle DashboardsTo properly understand how the keyboard navigation shortcuts work within an OracleDashboards screen, you first need to understand how the screen is organized.Links to Available DashboardsPage Tabs“Menus”ElementElementDashboard Section (Container for Content Elements)Figure 1 The different regions of an Oracle Dashboard screenAt the top of the screen, in what is known as the banner region, are a series of links that areassociated with the various dashboards that are available to the user. Each user may see adifferent set of dashboard links, but the first dashboard link for every user is usuallyassociated with the personal dashboard named “My Dashboard”.The area immediately below the banner region is the dashboard header region. If thedashboard has more than one page, a set of named tabs will appear starting on the left sideof the dashboard header. Each tab corresponds to a page in the current dashboard.3
On the right side of the dashboard header is the menu area. Items in the menu area allowyou to select functionality associated with other OBIEE modules, to save dashboard filterselections as a named set for later use, to select a saved filter set to be applied, to edit thecurrent dashboard (if your security settings allow this) and to log out of the system.Below the dashboard header region is the content region. In this region will be one or moredashboard sections. A dashboard section is simply a content container. They allow adashboard designer to group related content elements together. Sections can be used toorganize content by stacking sections vertically or organizing them into columns. Sectionscan optionally be collapsed to temporarily hide their content.Within a dashboard section, you will have one or more content elements. These elementscan be dashboard filter prompts, charts, tables or other reporting objects.The keyboard shortcuts below can be used to navigate the dashboard regions and content.ActionKeyboard ShortcutFocus on the first link of Available DashboardsCtrl Shift F2Navigate to the next Dashboard linkTab (when focused on a link)Select the Dashboard whose link has the current focusEnterFocus on the first dashboard page tab on the currentlyselected dashboard (applies to multi page dashboards only)Ctrl Shift F3Navigate to the next Dashboard page tabTab (when focused on a tab)Select the dashboard page whose tab currently has focusEnterMove backward through sections on dashboard pageCtrl Shift UMove forward through sections on dashboard pageCtrl Shift SMove backward through elements of sectionCtrl Shift F7Move forward through elements of a sectionCtrl Shift F8Set focus to Table Object (to activate screen readerannotations)Tab, when screen readerannounces a tableNOTE: Users of the Firefox browser and some versions of Internet Explorer may notautomatically load the table annotations needed by screen reader software. JAWS userswill need to reload the screen reader’s buffer. You do this by pressing Insert Esc afteryou press Tab to set focus on the Table.4
Keyboard Navigation of Menus in Oracle Dashboards and BI PublisherActionKeyboard ShortcutOpen MenuEnterMove Up/Down menu or submenu itemsUp/Down Arrow KeyExecute Menu Item actionEnterOpen SubmenuEnterClose menu or submenuEscTIP:To quickly select the menu area, you can use Ctrl Shift F3 to select the first page tab,and then use Shift Tab to navigate back into the menu area (landing on the “Logout”menu item).Keyboard Navigation of Drop Downs and Combo Boxes in Oracle Dashboards and BIPublisherActionKeyboard ShortcutOpens drop down and combo boxesAlt Up/Down Arrow KeyShows next/previous item in a combo boxUp/Down Arrow KeySelects optionEnterActivate selected optionTab to “GO” button, then EnterNotes for Screen Reading SoftwareWhen navigating an Oracle dashboard, the virtual PC Cursor mode on your screen reader can beeither on or off. However, when navigating within table objects on the dashboard, the virtual PCCursor should be turned on. (For example: Insert Z when using JAWS.)Keyboard Navigation within a TableIn data tables and pivots, in order for assistive technology to work, each data cell must beassociated with the corresponding column and row headers through annotation. To improveoverall system performance, this annotation is not added when the Dashboard is initially loaded.Only when a table receives focus is the annotation generated.5
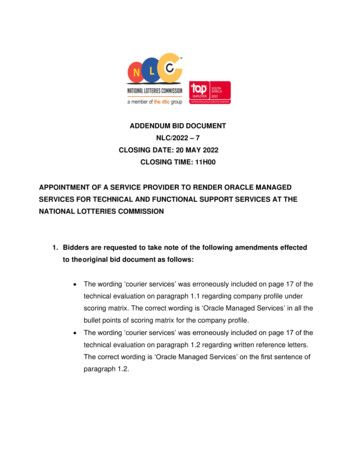
To navigate the cells within a table, ensure that virtual PC Cursor Mode is turned on. Youshould then use the screen reader table navigation keyboard shortcuts instead of tabbing, as notevery table cell can be tabbed into. For instance, if using JAWS, Alt Ctrl Right arrow will takeyou to the next cell on the right. Please refer to your assistive technology documentation for allof the applicable table navigation shortcuts.Example of navigating through a dashboard using the JAWS screen readerThe following example illustrates how a JAWS user would navigate within an Oracle dashboard.1. Navigate to the desired dashboard:a.Press Ctrl Shift F3 to move the focus to the first dashboard link.b. Hit TAB until you focus on the desired dashboard, then hit Enter.2. Navigate to the desired page on the dashboarda.Press Ctrl Shift F2 to move the focus to the page tabs.b. Hit TAB until focus moves to the desired page, then press Enter.3. Use the TAB key or Ctrl Shift S to move through sections of a dashboard. Youmay use TAB or Ctrl Shift F7 to move through different elements of a section.4. Once you bring focus to a pivot or table, hit TAB. If you are using the Firefoxbrowser, then hit Insert Esc to refresh the virtual screen buffer to access the tableannotations.5. Make sure the Virtual PC Cursor mode is on (Insert Z in JAWS). You will then beable to use the Table navigation keys documented in your assistive technology.BI Publisher: Turning on Accessibility Mode for the UIThe BI Publisher module has its own user preferences settings, apart from OBIEE itself. TheAccessibility Mode for the BI Publisher user interface is set for each individual user. (TheOBIEE Accessibility Mode for Oracle Dashboards is turned on by an administrator via aglobal configuration setting discussed later and is not available to end users.)Users can turn on Accessibility Mode in BI Publisher themselves by selecting the “Preferences”link from the main BI Publisher screen.6
Figure 2 BI Publisher User PreferencesThe first entry on the BI Publisher’s Preferences screen allows you to turn on accessibility modeby selecting the “Yes” radio button. Selecting this option will render the BI Publisher folders inan accessible tree structure that supports keyboard based navigation.NOTE: When setting this mode from the user’s Preferences screen, you must select “Apply”,then log out entirely and log back in for the system to recognize this change.If using BI Publisher in stand alone mode, this setting is also available on the login screen as acheckbox.7
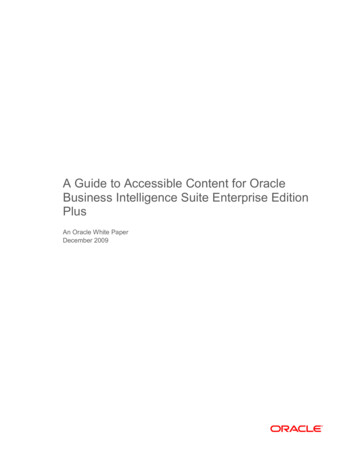
IR & EPM Workspace: End User selection of Accessibility ModeYou can turn on Accessibility Mode in the User Preferences screen in the EPM Workspace. Ifyou have low visual acuity but do not rely on a screen reader, you can select a high contrastdisplay mode on the same screen.Figure 3 EPM System 11 Accessibility SettingsFrom the main EPM Workspace screen, select File User Preferences from the main menu.The General Preferences screen will then appear. In the lower right portion of the screen, youcan turn on screen reader support and/or select a high contrast display theme. Turning onscreen reader support tells the system to provide the additional HTML markup those assistivetechnologies need.NOTE: You will have select “OK”, then log out, close your browser entirely and log back infor the system to recognize any changes.8
For DevelopersA number of general guidelines exist that should always be kept in mind when designing contentthat will be consumed by a variety of people with differing abilities. These concepts apply to anycontent you create, whether or not it is OBIEE content. In addition, there are specificOBIEE tool features you need to use to ensure your OBIEE content designs supportaccessibility requirements.Common MisconceptionsMany developers make certain assumptions about technology and accessibility. Some of themore common ones include: HTML automatically equals accessible Accessible tools automatically create accessible content Automated testing tools can reliably determine accessibilityNone of these assumptions, however, is correct. Developers can create non accessible contentusing HTML. A tool that can produce accessible content may not do so by default, or may allowa developer to select options that will turn off the accessible features within existing accessiblecontent. Automated testing tools do not always interact with content the same way end userswill. As a result, they may erroneously report accessible elements as non accessible. Therefore,accessibility is ultimately the responsibility of the content creator. When creating content,developers must be aware of certain common practices to ensure the content is accessible to all.General Guidelines for Creating Accessible ContentAlways remember to consider the fact that multiple disabilities exist and that multiple disabilitiesmay manifest in the same individual. You also need to remember that there are varying degreesof certain disabilities (such as the various types of color vision deficiency). Your designs musttake all these possibilities into account.Font SelectionUsers with low visual acuity will often use screen magnification software to make the screeneasier to read. The fonts you use should be readable even when magnified by accessibility toolsby as much as 20 times. Some fonts do not display well when magnified, while others do.Oracle Dashboards use style sheets to set standard display definitions. Make sure these stylesheets consistently use font selections that magnify well. That way, content creators willautomatically default to using fonts that are accessible.9
Use of ColorMany different types of color vision deficiency exist, from an inability to see the differencebetween one common color pair such as red green (the most common deficiency), all the way tofull color blindness where a person can only see varying shades of grey and black. Using justcolor to convey critical information means that certain users will not be fully aware of all thepertinent information about a subject. And, of course, a blind user will need any informationconveyed by color to also be present in an alternate textual format.As a developer, this means that you must not create any content that provides key informationby color alone.Examples of Inaccessible DesignsOne example of a non accessible design is to denote negative numbers solely by coloring the textred. Another example is a typical “stoplight” indicator where the only context informationcomes from its color – green for good and red for bad.Alternate Accessible DesignsUse of color is acceptable only as long as it is accompanied by some other indication of the sameinformation. For example, you can add a minus sign or parentheses to denote negative numbersin tables and pivots. For stoplight displays, you can add descriptive text (e.g. “Status: good”) anduse different shaped icons in addition to the color (e.g., green circles for “good”, yellow trianglesfor “warning” and red octagons for “bad”).Remember you need to consider multiple disabilities, so text should always be included. Thatway, the information will also be provided to users relying on screen readers.Color ContrastBecause color vision deficiency can also manifest as an inability to distinguish between subtleshades of similar colors, overall color design of all screen elements must provide a large amountof contrast. It is recommended that you try to achieve a minimum of a 4.5:1 color luminositycontrast ratio.For example, use black text on a white background instead of dark grey text on a light greybackground.An example of a tool that can test for the proper level of contrast can be found athttp://www.paciellogroup.com/resources/contrast analyser.html. If you want to see what yourweb site looks like to individuals with various types of color vision deficiency, try the tools at thehttp://colorfilter.wickline.org/ web site.10
Accessible ChartsDifferent types of charts require different design elements to insure that they are accessible. Thedefault settings for most chart types will not create accessible charts automatically. Nearly allsoftware packages create pie charts, bar charts and line charts that default to using only color todistinguish between different data series. Therefore, the content designer must change thedefault design to use some other display means to tell which data series is which.Recommended changes are shown in the table below:Chart TypeChange Recommended for AccessibilityPieUse different cross hatch patterns for each data seriesBarUse different cross hatch patterns for each data seriesLineUse different data marker shapes for each data series, with markers largeenough to be distinguishable from the lines and from each otherAdditionally, to insure that charts are accessible, you should always include the following chartelements: Chart Legend X Axis and Y Axis labels Data Labels for each data item in a seriesFinally, to promote a high color luminosity contrast ratio, charts should not use colored orpatterned chart backgrounds, as this may mask the data for certain color deficient users.Dashboard Specific GuidelinesA number of general guidelines apply to how you design dashboards for accessibility. Theseguidelines apply to any technology that creates dashboards.ConsistencyWhen creating multiple dashboards make the structure consistent. If multiple dashboardscontain similar functions or content, keep those links or forms in the same place on alldashboards. Buttons and links that have the same functions or destinations should have thesame text and labels. Icons used for the same function should also have the same ALT textassociated with them throughout the product.11
SimplicityTry to keep dashboards simple. Do not try to put too many objects on one screen. It’s better tohave multiple pages that are easy to navigate than one that is cluttered and difficult to navigate.On Screen ContentJust like in charts, to promote a high color luminosity contrast ratio, do not use colored orpatterned dashboard backgrounds. In addition, the styles you use should also support highcontrast between background and text, both in the dashboard header area as well as in the tabson multi page dashboards. Finally, you should place the most important content at the top ofthe page so screen reader users will be able to access it without having to navigate the entirescreen.Provide sufficient Textual InformationGraphics can not be read by assistive technologies, and low vision users may not be able todiscern the meaning of a graphical element. Therefore, all graphical elements must haveadditional text to describe the functionality.Graphical icons need to have what is known as ALT text – good descriptive text associated withthe graphical element that adequately describes its function when selected. If a graphical elementis merely present for aesthetics and has no functional purpose, it still needs a null ALT text(alt “”) assigned to it so that screen readers know it should be skipped.Other graphical elements that do not support creation of ALT text should have text fields addedto the top or side to denote functionality, such as “Select a Display View Below”.Consistency of Graphical ElementsWhen graphical elements are used to identify controls, status indicators, or other programmaticelements, make sure that the meaning assigned to each graphical element is consistentthroughout the application.Alternate DisplaysFor displays that are inherently visual such as interactive GIS maps or audio video feeds, nomethod may exist for making these specific content elements directly accessible. When youdeploy this kind of content, you must also provide a text based equivalent display of the sameinformation with similar interaction capabilities. Typically this means either creating anequivalent table/pivot of the related data (if applicable), or providing a caption and textdescription in the case of audio visual content.12
General ProhibitionsCertain application features should not be used at all, such as elements that blink with afrequency between 2Hz and 55Hz, or that use excessive animation (such as a “stock ticker”display widget). Make sure that you are familiar with all legally mandated design prohibitions thatapply in your locality as well and avoid using those elements.OBIEE Specific Techniques for Implementing AccessibilityIn addition to the above listed general guidelines that apply to any software development project,certain techniques that are specific to OBIEE should also be employed. The full OBIEE product suite consists of a number of modules, each of which covers different aspects ofaccessibility. Therefore, a completely accessible solution requires several different configurationsteps. In addition, different modules employ different specific techniques to create accessiblecontent.Specifically, the modules included in an OBIEE Plus license that apply for accessibility purposesare: Oracle Dashboards – for content consumption and casual user ad hoc queries BI Publisher – for production (canned) reporting Hyperion Interactive Reporting – for ad hoc querying by power users EPM Workspace – for schedulingThe Hyperion Interactive Reporting module (IR) is accessed from within the EPM Workspace,so configuring accessibility for the EPM Workspace will also cover the UI portion of InteractiveReporting. There are, however, a few additional steps to configure IR and the EPM Workspacefor use as the accessible ad hoc query and scheduling tools, which are noted below.Oracle Dashboards: Turning on Accessibility ModeIn order for Oracle dashboards to be read by assistive technologies, you must first enable theAccessibility mode. To do this, you need to edit the file instanceconfig.xml. Open this file inedit mode and add the line: Enable508 true /Enable508 Adding this tag allows assistive technologies to read dashboards. It enables tables and pivots tobe annotated with the necessary information for screen readers and flattens the menu items inreport links to become simple HTML links that are easier to navigate.The instanceconfig.xml file is typically found in the OracleBIData\web\config directory.13
NOTE: Any changes made to the instanceconfig.xml file are global and will affect all users.You will have to stop and restart the Oracle Presentation Server for the system torecognize any changes made to the instanceconfig.xml file.Oracle Dashboards: Optional Accessibility SettingsChanging the following settings in the instanceconfig.xml file is not required. However, theymay be helpful to make dashboard navigation more accessible.The DashboardMaxBeforeMenu SettingWhen more than 15 dashboard names are available for display, the default behavior of OracleDashboards is to create a drop down list of the dashboards from which users can choose. Bymodifying the instanceconfig.xml file, you can change the number of dashboard names to displayas links before the presentation is changed to a drop down list. This modification can make iteasier for users of assistive technology to navigate the dashboard list.Modify the following entry in the instanceconfig.xml file. The minimum value is 1. DashboardMaxBeforeMenu 1000 /DashboardMaxBeforeMenu The DashboardInlineLoad SettingBy default, Oracle dashboards only refresh those portions of the screen that need to be updatedwhen a user changes a filter setting or selects a display option such as a View Selector. Thisfeature is also known as Partial Page Refresh and is designed to provide better overall displayperformance. By turning off the DashboardInlineLoad feature, the entire dashboard page will berefreshed upon any action that requires any portion of the screen to be updated. Forcing acomplete page refresh can facilitate screen reading by assistive technology.To force a full page refresh on any updates, modify the following entry in the instanceconfig.xmlfile as shown below. The default value is true. DashboardInlineLoad false /DashboardInlineLoad Oracle Dashboards: Specific Content TechniquesAside from general guidelines, certain technical features in Oracle Dashboards can be leveragedto create accessible content without impacting all users. In addition, certain aspects of assistivetechnologies may require slight deviations from normal Oracle Dashboards development.14
Screen OrganizationNormally, a dashboard designer can place any content elements anywhere on the screen. Therequirements of assistive technologies may force certain elements to be placed according to moreformal rules.For example, screen readers assume a logical screen flow from left to right and top to bottom.They also have no ability to tell if screen content they have already scanned has changed since itwas read, unless the entire page is refreshed. Therefore if the DashboardInlineLoad setting is setto true, then dashboard designers need to place any controls that might change the screen’scontent on the screen before the content that would be affected by the control.Navigation TargetsScreen readers require sufficient textual information to tell the user the navigation context oftheir current location. Since Oracle Dashboards are designed by populating containers calledsections, you must design each section in a way that provides the information a user needs to beable to tell where they are and where they have been. Being able to use the “Previous Section”keyboard shortcut only has meaning if the user can know which section they want.By default, dashboard sections are given sequential names (“Section 1”, “Section 2”, etc.) andthese default names are not surfaced to the end user. The accessibility requirement to supporttextual information for screen readers means that dashboard designers must create meaningfulnames for each section in a dashboard and make those section names “visible”. Turning on thissection naming feature will generate sufficient textual annotations. These annotations will beread by screen reader assistive technology and inform users of their current location within thedashboard.The following screen shot illustrates the default configuration of a dashboard, without thesection name feature. Each element on the screen has an element name (“simple table” and “testlink”) but the sections themselves do not. Note that, while a screen reader user can still usekeyboard shortcuts to navigate the dashboard, they will not have any information about whichsection they are in until they navigate to a specific element within the current section.15
Figure 4 Default display of a multi section dashboardTo define section names, select “Page Options” and choose “Edit Dashboard”. Once in theDashboard Editor, select the “Rename” button on top of the section object. In the dialog boxthat appears, type in a name that describes the contents of that section and turn on the “DisplaySection Heading” checkbox. Repeat this process for each section on the dashboard.Figure 5 Defining a visible Section Name16
When screen readers announce section names, Oracle Dashboards will automatically add theword “Section” in front of the name you define. So avoid using “section” as part of the name.The resulting dashboard now will look like this.Figure 6 A multi section dashboard with section names definedNotice that now a screen reader has enough textual information to announce the section name aswell as the previously defined element names when a user navigates to them. The user will thenbe able to decide if they want to navigate to the elements within that section, or navigate to thenext section.Working with Oracle Dashboard StylesThe overall look and feel of any Oracle dashboard is controlled by a set of skins and styles thatare available. You can create your own custom skins and styles to implement standard settingsthat support accessibility, such as default font selections, high contrast color schemes, etc. Youcan set a default style for all dashboards and you can also select a style to apply to an individualdashboard.17
Creating Custom StylesIt is recommended that you start by copying the default Oracle10 style and modifying it ratherthan starting from scratch. The styles and skins are stored in individual folders located in theOracleBI\web\app\res folder on the Oracle Presentation Server machine. These files will alsobe duplicated in the web\app\res folder under your web application server as well.Modifications to these files made in one location must be c
differentset of dashboard links, but the first dashboard link for every user is usually associatedwith the personal dashboard named "My Dashboard". Thearea immediately below the banner region is the dashboard header region. If the dashboardhas more than one page, a set of named tabs will appear starting on the left side ofthe dashboard header.