Transcription
REPORT June 2020CIPD Good WorkIndex 2020UK Working Lives Survey
The CIPD is the professional body for HR and peopledevelopment. The registered charity champions better workand working lives and has been setting the benchmark forexcellence in people and organisation development formore than 100 years. It has more than 150,000 membersacross the world, provides thought leadership throughindependent research on the world of work, and offersprofessional training and accreditation for those working inHR and learning and development.
CIPD Good Work Index123456789101112ReportCIPD Good Work Index 2020UK Working Lives SurveyContents1Introduction 2Occupations2 43Job progression and mobility94Pay and benefits 125Contracts 176Work–life balance 237Job design and the nature of work 268Relationships at work 339Employee voice 3810Health and wellbeing 4711Conclusions 5312Notes 55AcknowledgementsThis report was written by Mark Williams of Queen Mary University of London,Ying Zhou of the University of Surrey, and Min Zou of Henley Business School,University of Reading with Jonny Gifford of the CIPD.1
CIPD Good Work Index1123IntroductionThis report presents the CIPD Good Work Index, the CIPD’s annual benchmark of goodwork or job quality in the UK. It is based on the third UK Working Lives survey, whichdraws on a representative sample of UK workers. The CIPD Good Work Index measuresa wide range of aspects of job quality, including employment essentials, such as pay andcontracts, the day-to-day realities of work as experienced by workers themselves, and theimpacts on people’s health and wellbeing.5This year’s survey was conducted just before the COVID-19 pandemic and gives a snapshotof the UK jobs market at this important juncture. It is being supplemented with furtherCIPD surveys to monitor how the pandemic is affecting UK workers. This report is alsoaccompanied by a summary report and appendices of data tables and methods. Theseresources are available at www.cipd.co.uk/goodwork6In our first chapter, we give an overview of the survey data and look across the seven coredimensions we identify as good work.4789101112What is good work?The CIPD’s purpose is to champion better work and working lives by improving practicesin people and organisation development for the benefit of individuals, the economy, andsociety. We believe that good work is fundamental to individual wellbeing, supports astrong, fair society, and creates motivated workers, productive organisations and a strongeconomy. The CIPD’s definition is: Good work is fairly rewarded. Good work gives people the means to securely make a living. Good work gives opportunities to develop skills and a career and ideally gives a sense offulfilment. Good work provides a supportive environment with constructive relationships. Good work allows for work–life balance. Good work is physically and mentally healthy. Good work gives employees the voice and choice they need to shape their working lives. Good work should be accessible to all. Good work is affected by a range of factors, including HR practices, the quality ofpeople management and by workers themselves.Across each of these areas of activity or influences, employers need to develop an effectivepeople strategy that includes: values, culture and leadershipworkforce planning and organisational developmentemployment relationspeople analytics and reporting.Background to the CIPD Good Work IndexMeasuring good work or job quality is increasingly acknowledged in both policy andorganisational spheres as being centrally important to assessing contemporary work andthe employment relationship, understanding their impact on our lives and productivity, andmaking sure we improve them wherever we can. In the UK context, the 2017 Taylor Reviewof Modern Working Practices identified several key concerns of relevance to job quality inthe modern labour market. In the same year, the CIPD embarked on a project to review theresearch on job quality and good work and develop a tool to measure the main dimensions2Introduction
CIPD Good Work Index123456789101112of job quality. To this end, it commissioned two reviews: first, from the perspectives ofworkers, on what constitutes good or poor job quality and what the opportunities andpitfalls are in measuring it; and second, on the capacity workers have to influence their jobquality and the shifting balance of power between employers and employees. This surveyis based on this body of work and further consultation with academics, HR experts andgovernment officials. The Measuring Job Quality Working Group, of which the CIPD was amember, drew up seven dimensions of good work and recommended approximate indicatorsto them – very similar or identical to the ones reported.1The CIPD Good Work Index provides a key indicator of the current state of work inthe UK, giving insight and reference points for those involved in research, policy andpractice relating to good work. More specifically, it presents a regular, comprehensive,and broadly representative survey of workers across job types, occupations and sectors,complementing other surveys of workers that are less frequent (for example, the UK Skillsand Employment Survey) or contain less detail on job quality and good work (for example,the Labour Force Survey).Seven dimensions of good workThe CIPD Good Work Index captures data on seven dimensions of good work, which aresummarised in Table 1. The CIPD Good Work Index includes both objective and subjectivemeasures. Objective measures capture aspects that in principle should be unbiased: forexample, data on contract type and the amount people earn. Subjective measures reflectan opinion, preference or feeling: for example, how meaningful people find their work,the quality of relationships at work, and measures of satisfaction with job or life. Further,we measure both aspects of good work that are universal – that is, what is good for oneperson will be good for anyone – and aspects that are relative – what’s good for oneperson may not be for good another. For example, no one would contest that more payis better than less pay, but part-time work and irregular hours are far less clear as theyare likely to vary with one’s personal circumstances. The same part-time job may be apoor deal for someone who is trying to feed a family or tie down their first mortgage, yetideal for a student who cannot commit full-time, or an older worker who has paid off theirmortgage and wants to wind down a little. To give a full view of working life, the CIPDGood Work Index describes both universal and relative aspects of job quality and relies onboth objective and subjective measures.Table 1: Dimensions of good workDimension3Areas included1 Pay and benefitsSubjective feelings regarding pay, employer pension contributions, and otheremployee benefits.2 ContractsContract type, underemployment, and job security.3 Work–life balanceOverwork, commuting time, how much work encroaches on personal life andvice versa, and HR provision for flexible working.4 Job design and thenature of workWorkload or work intensity, autonomy or how empowered people are in theirjobs, how well resourced they are to carry out their work, job complexity andhow well this matches the person’s skills and qualifications, how meaningfulpeople find their work, and development opportunities provided.5 Relationships at workSocial support and cohesion. The quality of relationships at work, psychologicalsafety, and the quality of people management.6 Employee voiceChannels and opportunities for feeding views to one’s employer and managers’openness to employee views.7 Health and wellbeingPositive and negative impacts of work on physical and mental health. Oftenconsidered as an outcome of job quality.Introduction
CIPD Good Work Index123456789101112A set of seven indices are calculated from the survey data, each one representing each ofthe seven good work dimensions. These indices in turn are derived from a set of 18 subindices, which, in turn are derived from many survey items (detailed in Appendix 2). In thisreport, we largely focus on the seven good work indices and their sub-indices. This year,the CIPD Good Work Index also includes detailed measures of sleep and substance misuse,important aspects of wellbeing.The UKWL survey designThe 2020 UK Working Lives (UKWL) survey was conducted in January 2020 and gave asample of 6,681 workers. It drew on the same YouGov UK panel of approximately 350,000adults in work as the 2018 and 2019 surveys. To make the samples representative of theUK as a whole, quotas were used to target the sample and subsequent weights based onONS figures were applied to the dataset. The sample is representative of the UK workforcein terms of gender, full- or part-time work status, organisation size within each sector, andindustry. While the 2018 and 2019 surveys drew fresh samples, new to the 2020 survey isthat a subsample of the 2019 respondents were re-surveyed in 2020, allowing us to observehow the quality of work evolves within jobs; this is outlined in more detail in Chapter 3.Focus and structure of this reportIn this year’s report, there are two special points of focus: occupations, and jobprogression and mobility. New for this year, we also introduce measures of performance,which we focus on throughout the report. The 2020 UKWL survey included questions onboth task (adherence to core job role tasks) and contextual (engagement in tasks beyondcore job role tasks) performance. Details on how these constructs were measured are inAppendix 2. The subsequent seven chapters each focus on a dimension of good work. Inthe final chapter, we draw together our conclusions and identify areas for future research.2 OccupationsKey findings In general, managerial and professional occupations have better scores across mostgood work indices, with routine and manual occupations generally scoring least well. However, there are exceptions where there are trade-offs, with occupations faring well insome areas but poorly in others. For example, various occupations that are low-paid have good health and wellbeing– these include jobs in animal care, housekeeping, cleaning, and sports and fitnessoccupations. They also report having (in varying degrees) good work–life balance andrelationships. On the other hand, there are various professional occupations that are high-paidbut have poor health and wellbeing. These include jobs in legal services, health, andconservation and environment professionals, and research and development managers.These occupations report some of the poorest work–life balance.An occupational perspectiveIn this report, we use classifications developed by the Office for National Statistics (ONS)to distinguish occupational groups and classes. The ONS classifications distinguish75 detailed occupations and seven National Statistics Socio-Economic Classification(NS-SEC) classes. More detailed explanations of these two constructs can be found inAppendix 2. The reason this report uses NS-SEC is that it has a clear conceptual basisrooted in differences in employment relations derived from decades of social science4Occupations
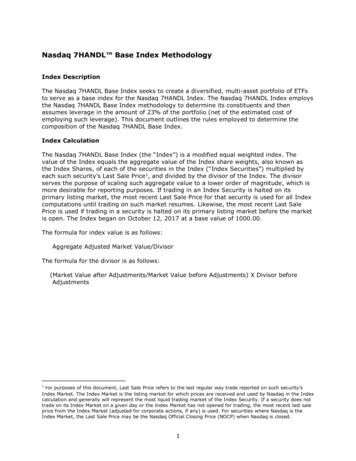
CIPD Good Work Index1234567891011125research. NS-SEC can broadly be thought of as a hierarchy of access to economicresources in the labour market and degree of authority and control within organisations.To simplify analysis by NS-SEC categories, we sometimes refer to occupational classes bytheir ‘reduced category labels’, which collapses the seven classes into three broader ones,as shown in Table 2. Finally, it separates out smaller employers and most self-employedworkers in class 4. This means that certain CIPD Good Work indices do not appear for thisgroup as they are either not relevant to non-employees or some questions were asked onlyto employees (mainly questions relating to being line-managed and voice).Table 2: National Statistics Socio-Economic Classification (NS-SEC) categories2Reduced category labels1 Managerial and professional occupationsNS-SEC categories1 Higher managerial and professional occupations2 Lower managerial and professional occupations2 Intermediate occupations3 Intermediate occupations4 Small employers and own-account workers3 Routine and manual occupations5 Lower supervisory and lower technical occupations6 Semi-routine occupations7 Routine occupationsAs outlined in Chapter 1, the CIPD Good Work Index includes seven indices, each of whichare in turn composed of various underlying sub-indices. In this chapter, we only explorethe seven overall indices, while the later chapters explore the more detailed sub-indices.Occupational class and good workExploring how the seven indices vary across occupational classes, several dimensions showa clear gradient, with managerial and professional occupations generally doing better,and routine and manual occupations scoring least well, with some noticeable exceptions.The indices fitting this pattern are the pay and benefits index, the contracts index, andemployee voice. Two indices (job design and relationships) broadly follow this pattern,with the noteworthy exception of small employers and own-account workers, who scoresimilarly in the job design index to higher managerial and professional occupations.The work–life balance index displays a ‘reverse gradient’. While those in managerialand professional occupations have greater access to flexible working (as shown inChapter 6), they also work more hours, including working more unpaid hours, and havelonger commuting times. Finally, the health and wellbeing index shows no gradient byoccupational class. This issue is explored in more detail next through analysing the 75occupational categories.Occupations
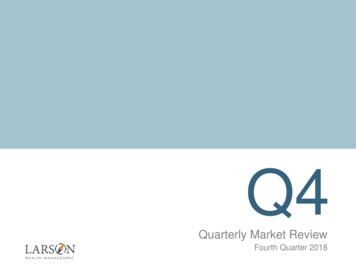
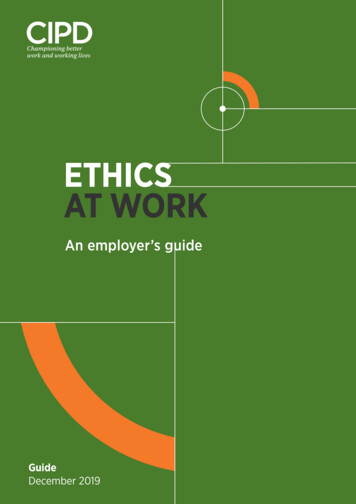
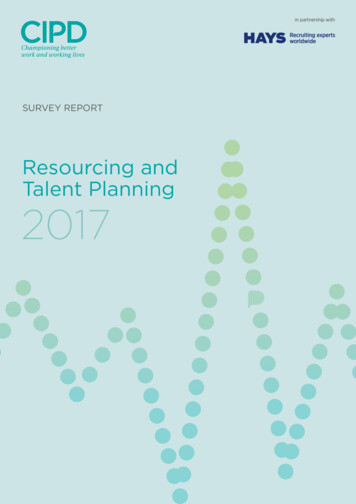
CIPD Good Work IndexFigure 1: Mean CIPD Good Work Index scores, by occupational y andbenefits indexContractsindexWork–lifebalance indexJob lth andwellbeingindexHigher managerial and professionalLower managerial and professionalIntermediate occupationsSelf-employed routine and manualLower supervisory and technicalSemi-routine occupationsRoutine occupationsTrade-offs between pay and aspects of good workThis section explores relationships between the pay of occupations and their scores on theseven good work indices. This helps us understand the dynamics of good work: specifically,how aspects of work can trade off against one another, such that workers who do better inone respect may do worse in another; or alternatively, how aspects of good work cluster,such that workers who are better off in one respect tend to be better off in general.These are presented in Figure 2 using simple scatterplots with a line of best fit added.Similar patterns emerge at this more detailed occupational level to the more aggregatedoccupational class level. We find that higher-paying occupations tend to score highernot only on the pay and benefits index, but also on other good work indices, with theexception of work–life balance again, where the correlation is negative. Again, we find noclear pattern for health and wellbeing.Figure 2: The relationship between mean pay and mean index scores across detailed occupationsPay and benefits indexContracts index0.9500.6000.9000.500Average contracts scoreAverage pay and benefits 0.200204060800.70020Average pay percentile6Work–life balance index0.6504060Average pay percentileOccupations0.750Job design index80
Aver0.3000.750CIPD Good Work Index0.2500.2002040600.7002080Average pay 000.4002080Relationships at work index6080Employee voice Average pay percentile12Health and wellbeing indexAverage health and wellbeing score0.7000.6500.6000.5500.500204060204060Average pay percentile0.75080Average pay percentile740Average pay percentile0.900Average relationships score100.600Average pay percentile790.6500.45068Average job design score40.750Average employee voice score3800.700Average work–life balance score260Job design indexWork–life balance index0.650140Average pay percentileOccupations80
CIPD Good Work Index123456789101112Why might there be a much weaker relationship between occupational pay and thehealth and wellbeing index given that, with the exception of work–life balance, higherpaying occupations tend to score better on the good work dimensions? One reason maybe the different composition of occupations. Some groups have different levels of healthand wellbeing and different groups select into different occupations (for example, manylow-paying occupations are female-dominated and females tend to report higher jobsatisfaction than men, while the reverse is true for many high-paying occupations, whichare often male-dominated). Another reason is that it is well known that work–life balance isan important factor strongly related to health and wellbeing, and lower-paying occupationstend to do quite well on this indicator relative to higher-paying occupations.A simple way to get a handle on this is to identify the top ten occupations that do muchbetter in terms of their health and wellbeing index rank compared with their pay rank, and theoccupations that do much worse in terms of their health and wellbeing index rank comparedwith their pay rank, and then explore further how they perform on the good work indices. Takingthose occupations that do very well in terms of health and wellbeing but poorly in terms of payfirst (Table 3), we find a quite varied set of occupations. These are all in the bottom third of theoccupational pay rankings but in the top third of the health and wellbeing rankings. Exploring theircharacteristics in more detail (not shown), we find they all tend to do well in work–life balance,with the cleaning-related occupations scoring very highly on this measure. These ten occupationsalso tend to do relatively well in relationships, with some instances in other areas too. Animal careand control services and sports and fitness occupations, for instance, score very highly in terms ofpurpose. These illustrate that poorly paid workers may be better off in some respects.At the other end of the spectrum, we have the top ten occupations with the largest reversediscrepancy between their pay and health and wellbeing rankings, reported in Table 4.These are in the top third of the pay rankings but in the bottom third of the health andwellbeing rankings. These are all managerial and professional occupations. Althoughhighly paid, these occupations tend to do less well in terms of work–life balance. Legalservices, health, and conservation and environment professionals, as well as research anddevelopment managers in particular have some of the poorest work–life balance. Thereare other instances where they do less well on certain indicators. For instance, engineeringprofessionals have below-average relationships. This analysis shows that while higherpaying occupations tend to do better overall, there are some interesting exceptions,reinforcing that good work is multidimensional and cannot be reduced to pay alone.Table 3: Top ten occupations with largest discrepancy between their pay and health and wellbeing rankingPay rankHealth andwellbeing rankAnimal care and control services693–66Housekeeping and related services, cleaning andhousekeeping managers and supervisors7411–63Elementary agricultural occupations, elementaryconstruction occupations652–63Elementary cleaning occupations7314–59Other administrative occupations6612–54Agricultural and related trades584–54Sports and fitness occupations481–47Administrative occupations: finance6417–47Metal forming, welding and related trades536–47Childcare and related personal n ranks
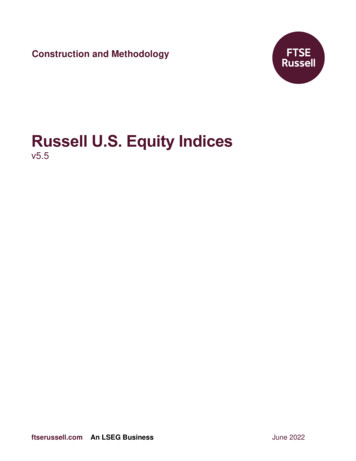
CIPD Good Work IndexTable 4: Top ten occupations with largest reverse discrepancy between their pay and health andwellbeing ranking123456789101112Health andwellbeing rankDifferencein ranks36865Health professionals76760Research and development managers25351Conservation and environment professionals217150Quality and regulatory professionals95445Legal associate professionals317544Engineering professionals44642Electrical and electronic trades, skilled metal, electricaland electronic trades supervisors155540Architects, town planners and surveyors114433Teaching and educational professionals255732OccupationPay rankLegal professionals3 Job progression and mobilityKey findings Around 12% of respondents had changed their job between 2019 and 2020. Job changeis more common among younger workers, less common among older workers. Jobchange rates are similar across genders. In general, good work is associated with a lower probability of turnover. In particular,workers are less likely to have changed jobs if they had excellent job design andexcellent relationships, and to some extent, excellent work–life balance, opportunities forvoice, and health and wellbeing. Excellent pay made little difference. CIPD Good Work Index scores hardly changed for those who stayed in their jobs. Bycontrast, there were substantial improvements in scores for those who changed jobs bymoving to a new employer, in particular with respect to job design and relationships. People’s new jobs tend to be better paid than the job they held previously, but one infive respondents are worse paid or have less responsibility than before. This could beout of necessity (for example, they were made redundant) or a deliberate choice (forexample, to downsize their careers and achieve a better work–life balance).Panel innovationA secondary key focus of this report is job progression and mobility. In the 2020 survey, anew panel component was introduced. A subsample of the 2019 survey respondents werere-surveyed in the 2020 survey (n 2,107), enabling us to track how job quality progresseswithin jobs and careers. First, it allows us to explore the effect of different dimensions ofgood work on career decisions and why some jobs experience persistently high turnover orstaff shortages. Second, it allows us to explore how good work progresses or deterioratesas workers’ tenure within jobs increases. This is an area we presently know much less about.This data will become increasingly useful as we continue to collect it over the coming years, butwe present early findings here from the limited one-year period we currently have data for. Wedistinguish between those who were still working in the same job when they were re-surveyedin 2020 (‘job stayers’) and those who had moved to a new job (‘job movers’), respectively, anduse them as comparison groups in our analysis. Within the job movers group, we further separatethem into those who have changed job with the same employer (for example, through promotionor lateral transfer) and those who have changed job by moving to a different employer.9Job progression and mobility
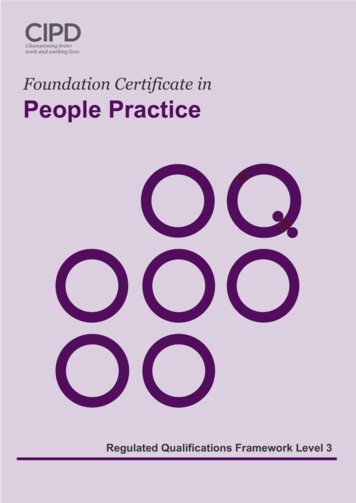
CIPD Good Work Index123Patterns in job mobilityOnly 12% of the panel subsample had changed jobs between 2019 and 2020. Job mobilityis least common among the youngest workers (18–24) and older workers (55 ). There isvery little overall difference between genders.Figure 3: Job mobility, by age and gender (% changed jobs in last 455 MaleFemaleDeterminants of job mobilityIn general, people who moved to new jobs tend to have more pay and responsibility as aresult. However, one in five respondents report their current job is lower paid or has lessresponsibility than their previous job. This highlights that while a new job is generally apositive career move in terms of seniority, there is a sizable minority for whom this is not thecase. This might be out of necessity (for example, they were made redundant) or a deliberatechoice to downsize their careers (for example to achieve a better work–life balance).Figure 4: Pay and responsibility compared with previous job Compared with last job, current job:10MoreAbout ityAnd compared with last job, current job involves:Job progression and mobility
CIPD Good Work Index123456789101112Next we explore how observed job quality in 2019 affects the probability of changing jobs by2020. In particular, we are interested in the relative importance of the different dimensionsof job quality on the probability of changing jobs. This was estimated using OLS regression,adjusting for a standard set of control variables (see Appendix 2 for more details). We found: The two most influential dimensions of job quality for the probability of changing jobs arerelationships at work and job design. Those who reported having excellent relationshipsat work in 2019 had an 18.2 percentage point (that is, almost a fifth) lower probability ofchanging their jobs by 2020 than those who had very poor relationships at work. Thosewho had excellent job design in 2019 had a 16.9 percentage point lower probability ofchanging their jobs by 2020 than those who had very poor job design in 2019. Excellent work–life balance and employee voice have slightly smaller effects onthe probability of changing jobs, but still reduced the probability of changing by asignificant amount (around 13 percentage points less likely). Pay and benefits and contracts have the smallest effects on the probability of jobchange, about half that of relationships at work and job design. Having excellent health and wellbeing reduced the probability of changing jobs bya similar amount to having excellent work–life balance or excellent employee voice(around 13 percentage points difference).All in all, these patterns clearly demonstrate that it is the more intrinsic aspects of work (inparticular relationships and job design) that are the most important in workers’ decision toremain or leave their jobs than the more extrinsic aspects like pay and contracts. However,all good work indices have statistically significant effects.Progression in job quality within jobs and careersWhile the previous section highlighted that job quality predicts the probability of jobchange, this section explores the relationship between job change and post-turnover jobquality. In general, scores on the good work indices hardly change for those who stayedin the same job. By contrast, for those who changed jobs, we do observe slight generalimprovements in job quality. These are most pronounced for job design but can also beobserved in most other dimensions.Figure 5: Progression in CIPD Good Work Index in the panel sample between 2019 and 20201.00.90.80.70.60.50.40.30.20.1011Pay andbenefits indexContractsindexJob designindexWork–lifebalanceJob stayer 2019 meanJob stayer 2020 meanJob mover 2019 meanJob mover 2020 meanRelationshipsindexJob progression and mobilityEmployeevoiceindexHealth andwellbeingindex
CIPD Good Work Index1234567891011We can further explore the sources of improved good work scores for job movers byseparating out job movers into two groups: those who changed their job within the sameemployer (for example, by promotion) and those who change their job by moving to a newemployer. For those changing job within their current employer, there is a relatively slightincrease in pay and benefits and work–life balance, and a slight fall in employee voice,with the other indices being essentially unchanged. For those changing jobs with a newemployer, we observe a more pronounced improvement in good work scores across alldimensions. It is particularly pronounced for job design and for relationships. All in all, thegood work indices are important determinants of changing jobs, and changing jobs bringsnoticeable improvements in the quality of work, especially when this involves a change ofemployer. Of all the seven good work indices, job design and relationships are found to bethe most important in both respects.Figure 6: Progression in the CIPD Good Work Index among job movers1.00.90.80.70.60.50.40.30.20.10124Pay andbenefits indexContractsindexJob loyeevoiceindexJob mover within organisation 2019Job mover within organisation 2020Job mover between organisations 2019Job mover between organisations 2020Health andwellbeingindexPay and benefitsKey findings Risk of low pay among full-time workers is highly uneven across occupational classes.Around two in five of those in routine manual occupations are low-paid. Low pay among full-time workers is also highly gendered, with one in five women beinglow-paid compared with one in seven men. It is particularly high among women inroutine and manual occupations. About a third of workers feel they are not paid appropriately, while only a quarter statedthey would not enjoy working if they did not need the money. Nearly two in five workersin the 2020 survey think a job is just a way of earning money. Benefits have improvedslightly since 2018 and are also unevenly distributed across occupational classes. Highermanagerial and professional occupations have the greatest provision of benefits, anddisparity between this category and the others has widened.12Pay and benefits
CIPD Good Work Index12345678910Pay is fundamental to assessing the quality of work as, for most people, it is central tomaterial standards of living and life chances outside of work. The distribution of pay ishighly uneven in the UK relative to other countries. Of the 42 countries the OECD collectsdata on, the UK has the 11th highest Gini coefficient (a measure of income inequality),3 withmany jobs being particularly low-paid. This latter issue is explored in further detail in thischapter. It also explores pensions and benefits from work – two other key components toworker compensation.Objective payAccording to the Office for National St
Seven dimensions of good work The CIPD Good Work Index captures data on seven dimensions of good work, which are summarised in Table 1. The CIPD Good Work Index includes both objective and subjective measures. Objective measures capture aspects that in principle should be unbiased: for example, data on contract type and the amount people earn.