Transcription
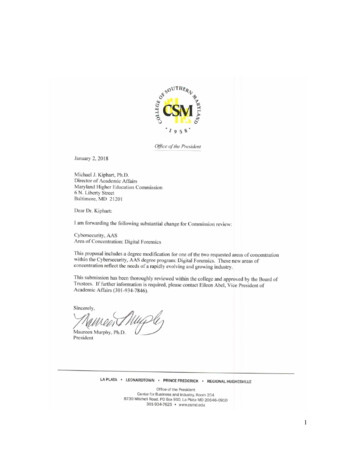
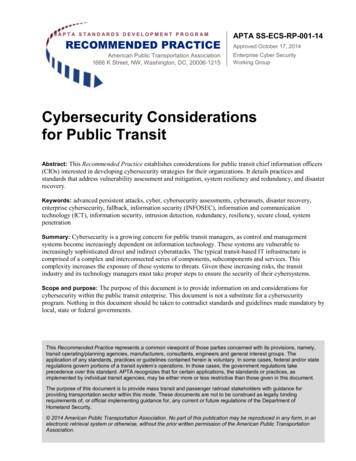
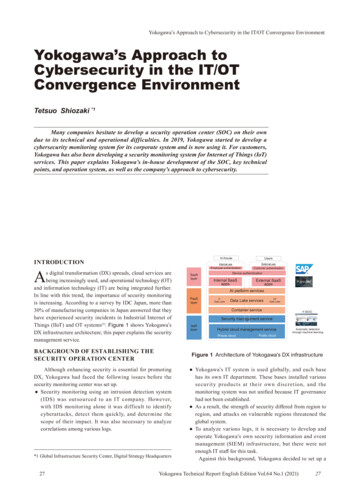
Yokogawa’s Approach to Cybersecurity in the IT/OT Convergence EnvironmentYokogawa’s Approach toCybersecurity in the IT/OTConvergence EnvironmentTetsuo Shiozaki *1Many companies hesitate to develop a security operation center (SOC) on their owndue to its technical and operational difficulties. In 2019, Yokogawa started to develop acybersecurity monitoring system for its corporate system and is now using it. For customers,Yokogawa has also been developing a security monitoring system for Internet of Things (IoT)services. This paper explains Yokogawa’s in-house development of the SOC, key technicalpoints, and operation system, as well as the company’s approach to cybersecurity.INTRODUCTIONAs digital transformation (DX) spreads, cloud services arebeing increasingly used, and operational technology (OT)and information technology (IT) are being integrated further.In line with this trend, the importance of security monitoringis increasing. According to a survey by IDC Japan, more than30% of manufacturing companies in Japan answered that theyhave experienced security incidents in Industrial Internet ofThings (IIoT) and OT systems(1). Figure 1 shows Yokogawa’sDX infrastructure architecture; this paper explains the securitymanagement service.BACKGROUND OF ESTABLISHING THESECURITY OPERATION CENTERUsersExternal useEmployee authenticationSaaSlayerCustomer authenticationDevice authenticationInternal SaaSappsExternal SaaSappsAI platform servicesPaaSlayerITData LakeData Lake servicesOTData LakeContainer serviceSecurity management serviceIaaSlayerHybrid cloud management servicePrivate cloudPublic cloudAutomatic detectionthrough machine learningFigure 1 Architecture of Yokogawa’s DX infrastructureAlthough enhancing security is essential for promotingDX, Yokogawa had faced the following issues before thesecurity monitoring center was set up. Security monitoring using an intrusion detection system(IDS) was outsourced to an IT company. However,with IDS monitoring alone it was difficult to identifycyberattacks, detect them quickly, and determine thescope of their impact. It was also necessary to analyzecorrelations among various logs.*1 Global Infrastructure Security Center, Digital Strategy Headquarters27In-houseInternal use Yokogawa’s IT system is used globally, and each basehas its own IT department. These bases installed varioussecu r it y products at thei r ow n discret ion, and themonitoring system was not unified because IT governancehad not been established. As a result, the strength of security differed from region toregion, and attacks on vulnerable regions threatened theglobal system. To analyze various logs, it is necessary to develop andoperate Yokogawa’s own security information and eventmanagement (SIEM) infrastructure, but there were notenough IT staff for this task.Against this background, Yokogawa decided to set up aYokogawa Technical Report English Edition Vol.64 No.1 (2021)27
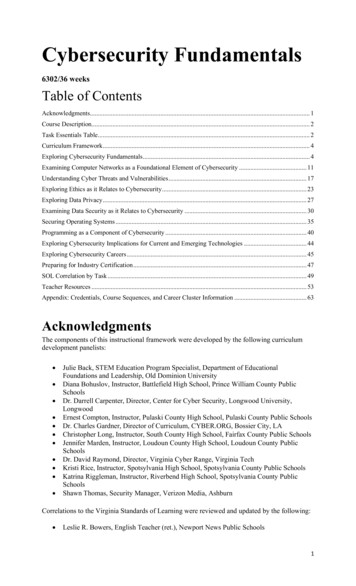
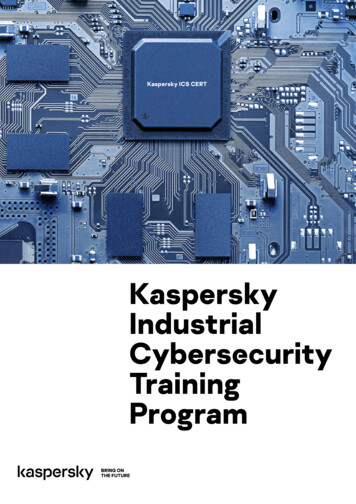
Yokogawa’s Approach to Cybersecurity in the IT/OT Convergence Environmentsecurity operation center (SOC). However, it needed a solutionthat could collect, process, and analyze logs and events fromvarious IT and OT data sources and respond quickly. Sincethe company planned to provide such a service to customersin the future, the monitoring solution had to be open and notdependent on specific products; it also had to support publicclouds such as Microsoft Azure and Amazon AWS. Therefore,we decided to set up a software as a service (SaaS)-typeSIEM in the cloud to reduce the man-hours required for itsdevelopment and achieve an early start-up.DEVELOPMENT HISTORY AND OVERVIEWOF SOCThere are two monitoring methods: distributed SOC,which performs monitoring in each region, and centralizedSOC, which perfor ms monitoring from a single place.Considering the scale of Yokogawa’s system, we chose thecentralized method. We built a reference model in Japan(Tokyo) and Singapore, and then expanded it to othercountries. The progress of this project is as follows. January to March 2019We conducted a proof-of-concept (PoC) of Elasticsearch(an open-source search engine for distributed processingand multi-tenancy) as a SaaS SIEM at the Tokyo andSingapore offices. We collected logs of IDS and ActiveDirectory (AD), Dynamic Host Configuration Protocol(DHCP), and Domain Name System (DNS) servers. In thePoC, we checked SOC requirements such as log collectionmethods, transfer time, detection of unauthorized access,analysis methods, and dashboard design. We also examinedthe effectiveness of Elastic Cloud. April to December 2019We set up the SOC development team in India (Bengaluru)and started security monitoring in six major regions (Japan,Europe, North America, Singapore, the Middle East, andIndia). January to June 2020We expanded monitoring to 15 regions (China, Russia,South America, Taiwan, the Philippines, Indonesia, etc.).We worked with IT departments in each region to improvethe structure of the Computer Security Incident ResponseTeam (CSIRT). July to December 2020Since the in-house monitoring function was proved to besufficient, we stopped outsourcing and switched monitoringto an in-house system. We also started monitoring usingMicrosoft 365-related security functions (Defender ATP,MCAS) and a cloud-based web application firewall (WAF).In addition, we introduced ServiceNow ITSM, whichprovides various workflows for IT services. From January 2021We established a 24-hour tripolar monitoring system fromJapan, Bengaluru, and Romania.Through this process, the Yokogawa Security OperationCenter (Y-SOC) currently offers the following functions.28(a) Collects security logs and events that occur in Yokogawa’sIT inf rast r uct ure (PCs, IDS, AD/ DHCP/ DNS, MailGateway, Cloud Service).(b) Uses Python scripts, Watcher (an alert detection pluginfor Elasticsearch), and Cyber Threat Intelligence (CTI: acollection of cyberattack traces and detection methods)to detect suspicious communications and events, andautomatically issues alerts.(c) Works with security personnel in each region to useServiceNow and automate incident response workflows.Figure 2 shows an overview of Y-SOC. The systemmonitors about 30,000 PCs, 83 IDSs, 111 ADs, and 100 DNSsall over the world.SIEM(automatic detection andalert notification by themachine learning function)PCsCloudY-AzureCritical SMailsecurityIDSDHCPMalware analysisAnti-spam, anti-virusThreat i intelligenceFigure 2 Overview of Y-SOCTable 1 shows the scale of the Y-SOC system, in termsof the number of events, log capacity, storage period, and hotnodes.Every day, 200 to 300 GB of logs and 500 million eventsare collected globally. The analysis target is the data of themost recent week. Three months’ data is retained to investigatethe existence of similar cyberattack techniques and relatedvulnerabilities.Table 1 Scale of Y-SOC systemItemSize, rate, periodData ingestion rate500-600 million logs/dayData ingestion size250-300 GB/dayFrequently accessed dataLast 7 daysInfrequently accessedLast 90 daysUptime SLA99.95%Data replication2 (primary and replication)Hot retention period30 days or 40 GB/index(whichever is earlier)Warm retention period60 days (extendable)TECHNOLOGIES FOR ESTABLISHING THESOCWe must consider a range of tasks to establish the SOC,Yokogawa Technical Report English Edition Vol.64 No.1 (2021)28
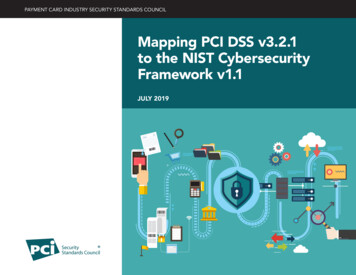
Yokogawa’s Approach to Cybersecurity in the IT/OT Convergence Environmentsuch as the method of collecting various logs, designing itsdata structure, preparing an efficient search infrastructure,developing a program for detecting unauthorized access, anddesigning a dashboard. This section explains the technologicalfeatures at each stage. Examining the Logs To Be MonitoredThe first step is to select logs and event informationto be monitored and estimate their volume. For example,authentication systems are crucial for companies, and thusAD logs are essential. IDS and DNS logs are needed tomonitor the communication of the command and control(C&C) server, which is used by hackers to gain unauthorizedaccess. It is also necessary to monitor each terminal formalware. Therefore, we chose the devices shown in Table 2 tomonitor their logs and event information.Defining Common Skimmer NamesIn various security products and systems, even if they areof the same type (e.g., firewalls) the field names and formats ofthe logs are not the same (e.g., src, client ip, source ip, src ipfor source address fields). However, since SIEM correlates andretrieves various log and event information, it is necessary tostandardize and normalize all fields.For Y-SOC, we developed an original index template(yokogawa ecs template) based on Elastic Common Schema(ECS)(2), and defined and indexed each field name accordingto the standard ECS naming rule. This made it possible toautomatically correlate different data sources.Table 2 Targets for collecting log and event informationCategoryDeviceNetworkFirewalls/IDS & IPSProxy serversVPN serversIn-house serverDNS & DHCP servers, etc.Dynamic Data Conversion and EnrichmentBefore being stored, the collected data need to bedynamically converted, integrated, normalized, and enrichedto make them suitable for analysis. Y-SOC uses Logstash toconvert the data into a unified data format. Logstash is anopen-source data collection engine with real-time pipelinefunctions and consists of three stages: input, filter, and output.Logstash can use plug-ins with various functions (Figure 3).User authentication Active directoryClient PCEndpoint protection (anti-virus)Cloud serviceWeb application firewalls (WAF)Designing the SIEM InfrastructureThe next step is to design the cluster configuration andnode type necessary to process the logs described above, andto estimate the disk space. In this case, we adopted the HotWarm architecture, which is widely used to handle logs andtime-series metrics data. In this architecture, the entire datais immutable and can be indexed in time series. Therefore,it is possible to manage the lifecycle of the entire index, i.e.,whether to retain or delete, by having each index hold datain a specific period. This architecture also creates a snapshotof all the indexes in the cluster every 30 minutes and keeps itfor 48 hours to ensure high availability for recovery in case offailure and accidental deletion. The design items of the SIEMinfrastructure using Elasticsearch are as follows. Cluster arrangement Node type (master, data, machine learning, etc.) Number of nodes and storage capacity Log storage periodCollecting Logs and EventsElasticsearch comes with a variety of log collecting agents(Beats) for servers and nodes to be monitored; Y-SOC uses thefollowing Agents. In SaaS-type services (Cisco WSA, CloudWAF, Microsoft 365, etc.), logs are collected in conjunctionwith application programming interfaces (API) or via cloudstorages (AWS S3, etc.).29Filebeat: Reads files from the system.Winlogbeat: Collects Windows events.Metricbeat: Collects metrics data from servers.Packetbeat: Monitors network latency, errors, and responsetime.Figure 3 Configuration of LogstashThe str ucture and functions of each plug-in are asfollows. Y-SOC uses multi-pipeline processing to improveperformance. The input plug-ins import various events into Logstash. File: Streams events from File. Beats: Collects logs from various Beats Agents. TCP: Reads events through a TCP socket. JDBC: Converts transactions into Logstash events. Filter plug-ins modify and manipulate events. Grok: Converts unstructured data into a structured format. Mutate: Renames, deletes, replaces, or modifies eventfields. GEOIP: Searches for IP addresses and adds geographicinformation to the log. KV: Automatically analyzes messages and breaks themdown into key-value pairs. T he out put plug-i n send s event d at a to a specif icdestination. Output is the final step of the event pipeline.Yokogawa Technical Report English Edition Vol.64 No.1 (2021)29
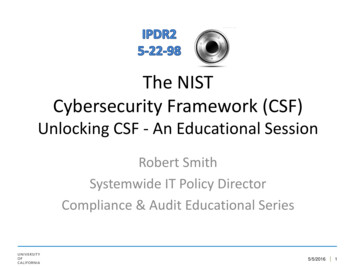
Yokogawa’s Approach to Cybersecurity in the IT/OT Convergence EnvironmentStandardized Dashboard DesignFor Y-SOC, we developed three dashboards: the toplevel dashboard, which collectively shows the security statusof each region, the region-wise alert dashboard, which showsthe security status of each region, and the detailed dashboard,which shows th ree-level i nfor mation for each device(FIgure 4).device, we developed detection rules by referring to materialsfrom JPCERT/CC(3) and other organizations (Table 3).Table 3 Examples of programs for detectingunauthorized accessPCIDSDNSFigure 4 Security dashboardThe top-level dashboard shows how many unauthorizedaccess and malware IDSs, ADs, and PCs have been detected ineach region and whether they have been addressed or not. Theregion-wise alert dashboard shows the time-series behavior ofIDSs, ADs, DNSs, and PCs. The YSOC dashboard is designedin a hierarchical structure with all the data segmented so thatthe cause of an anomaly can be identified by further drillingdown into the logs of each device.Drawing up SOC User RulesVarious members with different roles are needed tooperate the SOC. These include the general manager, SOCdevelopers, security analysts, infrastr ucture operators,and persons in charge of security in each region. For theauthentication of the SOC system and the dashboard, we usePingFederate (an SSO product that links the authenticationto access cloud applications with the authentication to accessthe in-house system). Access rights are granted to each useraccording to their role. Detects credential dump executable files such asmimikatz.exe and pwddump.exe. D etects the execution of unsupported scripts,etc. D etects spyware, viruses, and threat eventsrelated to vulnerabilities. Scans for suspicious DNS queries and networks. D etects malicious Tor (anonymizing TCP/IPconnection paths) and any access to the darkweb. Detects suspicious domains or hostnames thatexceed DNS thresholds, and encoded fullyqualified domain names (FQDN).Regarding AD, we monitor events recommended byJPCERT/CC (4) and Microsoft Corporation. For example,when AD is operated with a privileged right, the audit log iscompared with the operation history. When a large numberof successful or unsuccessful logins occur in a short time, thesystem looks at this as suspicious behavior, issues an alert, andasks the user to confirm it.To detect events, we use the machine learning (ML)function of Elasticsearch. Analysis applications are mainlydeveloped in Python and executed periodically by Jenkinsfor matching analysis with information from the indicatorof compromise (IOC) of various CTI (Figure 5). Theunsupervised machine learning function can automaticallyset thresholds and anomaly values based on time-seriesmodeling. This feature is also used to detect behaviors thatmay lead to incidents. These can be identified from behavioralcharacteristics such as communication destinations, number oflogins, data uploads, and suspicious DNS queries. The analysisresults are stored in the Alert Index and notified to the securityanalysts of Y-SOC. These detection programs are continuouslyrevised each time a new threat is reported.COLLECTING LOGS AND EVENTS ANDDEVELOPING A DETECTION LOGICFor cybersecurity defense, it is necessary to detectcyberattacks f rom the preliminar y stage of int r usion;after intrusion, it is important to prevent the damage fromspreading. Therefore, we use various types of cyber threatintelligence (CTI), which includes cyberat tack t racesand detection methods. We have set up a system that canautomatically collate IP addresses, URLs, and domains usedin unauthorized accesses with the detection logs.To detect log data of unauthorized access to each30Figure 5 Environment for executing Python scriptsYokogawa Technical Report English Edition Vol.64 No.1 (2021)30
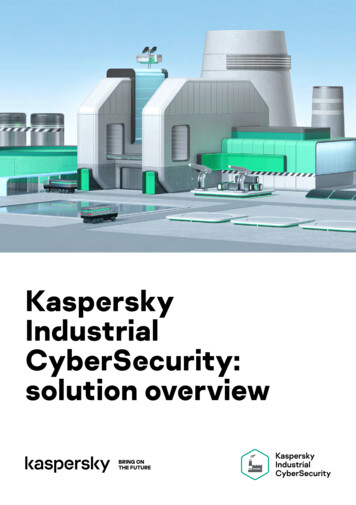
Yokogawa’s Approach to Cybersecurity in the IT/OT Convergence EnvironmentINCIDENT RESPONSE MANAGEMENT BYCSIRTAfter the SOC issues an alert, it is necessary to promptlyinvestigate the situation and take action. Therefore, weestablished an incident response workflow to smoothly workwith security personnel in each region. The flow is as follows(Figure 6).(1) T he analysis engine automatically detects anomalies anddetermines the significance of each alert based on a threatmatrix of categories and levels.(2) Alert information is collected in the Alert Index, and theY-SOC team is automatically notified (about 50 to 70 alertsper day on average).(3) Security analysts of the Y-SOC team determine whethereach alert is a true-positive (actual attack) or a falsepositive (misdetection). This determination follows thesteps below. A nalyze var ious log sou rces and cor relate them todetermine whether true or not. Examine internal communication traffic. Analyze external communications and files using variousCTI (Virus Total, MineMeld, online threat intelligenceplatform, online sand box).(4) A fter identifying the incidents that need to be reported,notify contact persons in each region of the incidentdescription, on-site investigation method, IoC, andmitigation measures.1The installedanalysis engineautomaticallydetects anomalies.Determines the level ofsignificance based on athreat matrix of categoriesand levels.3Y-SOC analysts analyze eachalert and determine whetherit is a false-positive.(routes and methods of unauthorized accesses) on a quarterlybasis to improve the detection rules and the security of the ITinfrastructure (Figure 7).Threat LandScape for YSOCMalicious File onEndpointsThreat Event Relatedto SpywareCredential FailedattemptMalicious IP/globalIOC communicationO365/MCAS7% 22%14%21%7%29%Figure 7 Y-SOC threat landscapeMONITORING THE SECURITY OF CLOUDSERVICESYokogawa actively uses public cloud services such asAmazon AWS and Microsoft Azure for promoting DX ininternal systems and external services. For external publicservers, we collect WAF logs and customize WAF policiesaccording to the core rule set (CRS) of OWASP, an opencommunity for web application security. This preventscommunication blocking due to over-detection.In addition, we developed a container application usingYokogawa’s Sushi Sensor and the cloud IoT hub as an externalDX service, and started a cloud-native IoT service. To ensuresecurity of the service, we use the Azure Security Center andmaintain security scores of 75% or higher.FUTURE DEVELOPMENTSWe are planning to collaborate with ServiceNow SecOpsin incident management, vulnerability response, and threatinformation (Figure 8).Y-SOC analyst (YIL)Alert Index2The alert information is collected in theAlert Index, and the Y-SOC team isnotified by e-mail.4CSIRT members ineach regionIf it is not a false-positive,the Y-SOC analyst asksCSIRT members in eachregion to investigate lianceVulnerabilityResponseFigure 6 Incident workflowTo analyze cyberattacks, we use MITRE ATT&CK (5),a framework that systematizes cyberattack tactics andtechniques by attack lifecycle. With this framework, weanalyze the attack methods and software used and estimate theattack group, revise detection methods, and draw up mitigationmeasures. In addition, we use MITRE ATT&CK Navigatorand other tools to predict cyberattack tactics.Each incident is ticketed using ServiceNow ITSM, andthe status of incidents (number of occurrences, number ofactions taken, number of actions not taken, and responsetime) is managed. In addition, we analyze changes in thenumber of incidents in each region and the Attack Vector31Y-SOCSIEMFigure 8 Collaboration with ServiceNowRegarding incident management, by integrating SIEMwith each security product it will be possible to automatework f lows such as i ncident discover y, i nvestigation,identification of the scope of impact, containment, andrecovery (SOAR: security orchestration, automation, andresponse).Yokogawa Technical Report English Edition Vol.64 No.1 (2021)31
Yokogawa’s Approach to Cybersecurity in the IT/OT Convergence EnvironmentFor vulnerability assessment, ServiceNow receivesvulnerability reports from Rapid 7 Insight VM vulnerabilityassessment sof t ware and cross- checks them with theconfiguration management database (CMDB) of ServiceNowto assign personnel in charge of patch response, manage theresponse status, and confirm the existence of vulnerabilities tocyberattacks.For threat intelligence, we are making the systemautomatically refer to cyber threat intelligence information.For an IoT cloud service for external use, we are planningto link it with Azure Security Center and ServiceNow toimprove the workflow of incident response and understand thesecurity situation. We are also planning to collect logs fromcontrol devices such as the e-RT3 (PLC).CONCLUSIONThis paper explained that SOC can be eff icientlydeveloped and operated by using SIEM and ML and bylinking with CTI. Yokogawa plans to enhance the integrationof IT and OT by linking edge servers at customers’ sites andcloud services and to expand the system to external OT SOCservices.To achieve this, we will strengthen the monitoringtechnology. In addition, we will establish a system toshare cyber threat infor mation with the Cybersecurity& Infrastructure Security Agency (CISA) (7) of the U.S.Department of Homeland Security and other governmentaland professional organizations under the threat and detection32information exchange convention (STIX/TAXII)(6). We willalso contribute to expanding knowledge regarding the threat tocontrol systems, such as ATT&CK for ICS.REFERENCES(1) IDC Japan, “Announcement of the 2020 IIoT/OT security measuressurvey on Japanese enterprises,” 2020, https://www.idc.com/getdoc.jsp?containerId prJPJ46173120 (in Japanese) (accessed on April 30,2021)(2) Elastic Common Schema (ECS), https://github.com/elastic/ecs(accessed on April 30, 2021)(3) J PCERT/CC, “How to use and analyze logs i n deali ng withadvanced cyberattacks,” 2016, tml (in Japanese) (accessed on April 30, 2021)(4) JPCERT/CC, “How to use logs to detect and counteract attacks onactive directory,” 2017, https://www.jpcert.or.jp/research/AD.html (inJapanese) (accessed on April 30, 2021)(5) MITRE ATT&CK, https://attack.mitre.org/ (accessed on April 30,2021)(6) STIX /TA XII, htt ps://oasis-open.github.io/cti-documentation /(accessed on April 30, 2021)(7) CISA, Automated Indicator Sharing, https://www.cisa.gov/ais(accessed on April 30, 2021)* Sushi Sensor and e-RT3 are registered trademarks of Yokogawa ElectricCorporation.* Se r v iceNow I TSM a nd Se c O ps a re reg ist e re d t r a de m a rk s ofServiceNow, Inc.* Autofocus and MineMeld are registered trademarks of Palo AltoNetworks, Inc.* All other company names, organization names, product names, andlogos that appear in this paper are registered trademarks or trademarksof Yokogawa Electric Corporation or respective holders.Yokogawa Technical Report English Edition Vol.64 No.1 (2021)32
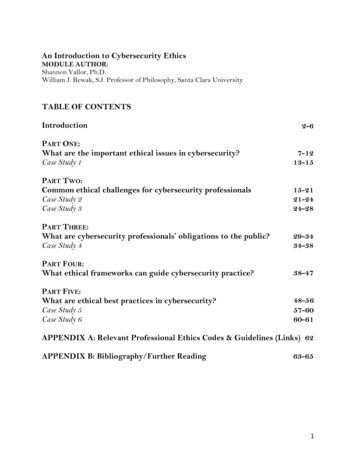
Standardized Dashboard Design For Y-SOC, we developed three dashboards: the top-level dashboard, which collectively shows the security status of each region, the region-wise alert dashboard, which shows the security status of each region, and the detailed dashboard, which shows three-level information for each device (FIgure 4).