Transcription
Autodesk Simulation CFD 2015Autodesk Simulation CFD ExternalFlow Validation: NACA 0012 -cfd
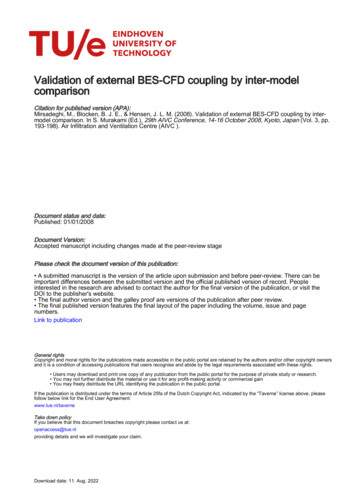
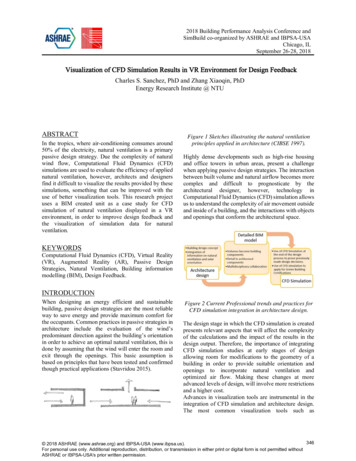
Autodesk Simulation CFD External Airflow Validation: NACA 0012 AirfoilNote: The following results were presented in a webinar as part of the Autodesk Build Your Simulation IQ series.This webinar can be found at YouTube in the ‘AutodeskSim360’ channel titled "Review NACA0012 2D Airfoil Modelin Autodesk Simulation CFD".IntroductionAirfoils have been studied and used for over a century. Their applications – and thus their design – have variedwidely over their history. Yet despite their fundamental mainstay in engineering, the ability to simulate airflowaround an airfoil has – for the most part – remained elusive. Accurate results have been extremely difficult toachieve, leaving designers to rely on historical test data and trial and error.But simulation technology continues to make strides – making it not only possible to analyze lift and drag, but alsopractical. The following paper details a recent validation study examining the ability of Autodesk Simulation CFDto conduct a 2D simulation of airflow around a standard NACA airfoil and predict lift and drag. Results werecompared against published test data and demonstrate the level of accuracy that can be achieved using astraightforward modeling approach and just a few additional solver controls available to enhance the modeling.Background: What are the NACA Airfoils?NACA stands for the National Advisory Committee for Aeronautics. It was a federal agency developed in the early20th century to cultivate aeronautical research. With the rise of the space age, it was dissolved and transformedinto NASA.In the early days of flight, NACA began to observe key relationships in successful airfoil design. They developedequations that could utilize these relationships to generate a consistent family of airfoil shapes. The NACA 0012 ispart of the four-digit series. The digits in the name are parameters that are entered into the equations to preciselygenerate the cross-section of the airfoil. The numbers are designated as follows: The first digit describes the maximum camber as a percentage of the chord length.The second digit describes the distance of the maximum camber from the airfoil leading edge in tenths ofa chordThe last two digits describe the maximum thickness of the airfoil as a percentage of the chord.Airfoils with a series number beginning with 00 – such as the NACA 0012 - are symmetrical and have no camber.The equation for the NACA 0012 airfoil is given by:𝑥𝑥𝑥𝑥𝑥𝑥 2𝑥𝑥 3𝑥𝑥 4𝑦𝑦𝑡𝑡 5𝑡𝑡𝑡𝑡 0.2969 ( 0.1260) ( 0.3516) 0.2843 ( 0.1015) 𝑐𝑐𝑐𝑐𝑐𝑐𝑐𝑐𝑐𝑐Wherec: Chord length,x: Position along the chord from 0 to cy: Half thickness at a given value of xt: Maximum thickness as a fraction of the chord (XX/100)Figure 1. Example NACA Airfoil
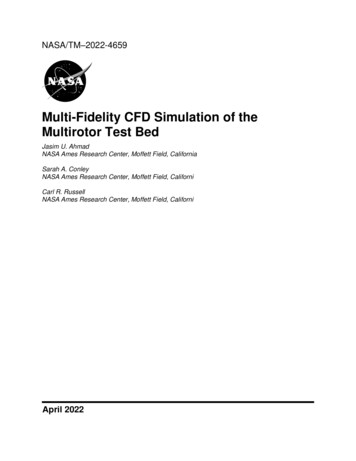
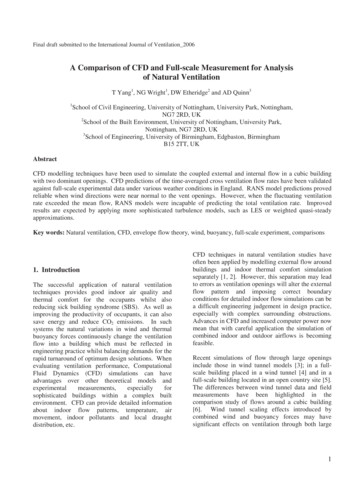
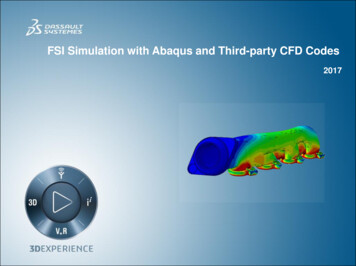
Autodesk Simulation CFD External Airflow Validation: NACA 0012 AirfoilThe NACA airfoils have since been used for validation cases for turbulence models. Many NACA airfoils have beenphysically tested and have extensive data use in evaluation of advanced Computational Fluid Dynamics codes. Thefollowing study compares Simulation CFD results for lift and drag against two sets of test data for the NACA 0012airfoil, one of the most tested of the airfoils [McCroskey].Experimental DataData SourcesTwo sets of data were used for comparison. As detailed below, the data included testing of the airfoil under multipleangles of attack as well as different surface conditions. This allowed for evaluation of simulation prediction of stallunder both laminar and turbulent flow conditions.1.Effects of Independent Variation of Mach and Reynolds Numbers on the Low-Speed Aerodynamic(1)Characteristics of the NACA 0012 Airfoil Section – Charles Ladson (NASA Langley 1988)This NASA Langley test set looked at NACA 0012 for various operating conditions and angles of attack. Aparticular note about this testing is they looked at a tripped vs. un-tripped surface. In other words, in theleading 5% of the airfoil, they applied sand paper of different roughness (60 and 80-grit in this case) whichserved to create a layer of turbulence on the leading edge. Otherwise, flow is purely laminar on the leadingedge of this airfoil geometry. The testing revealed that excellent correlation could be achieved for drag whencomparing experimental and theory when using the fixed transition or tripped airfoil.Test ConditionsMach: 0.05 – 0.36Reynolds: 2 – 12E6AOA: 0 – Max LiftSurface Conditions:- Smooth- Tripped (60-grit)- Tripped (80-grit)2.Aerodynamic Characteristics of Seven Symmetrical Airfoil Sections Through 180-Degree Angle of Attack for(2)Use in Aerodynamic Analysis of Vertical Axis Wind Turbines – Robert Sheldahl (Sandia 1981)These tests, conducted by Sandia National Laboratories, looked at multiple airfoils for application in verticalaxis wind turbines. This included a range of Reynolds numbers and a full rotation of angles of attack (0-180deg).Test Conditions7 Airfoils SectionsReynolds: 10E4 – 10E7AOA: 0 – 180 Surface Condition: SmoothThe combined experimental data set for this validation study consists of tests at Reynolds Number around 2 x10 6including two tests of smooth surface data and two sets of tripped (60-grit and 80-grit) surface data. The resultingplots of experimental lift coefficient and drag coefficient are shown below.Sheldahl: Re 2 x 10 6Ladson: Re 1.76 x 10 6
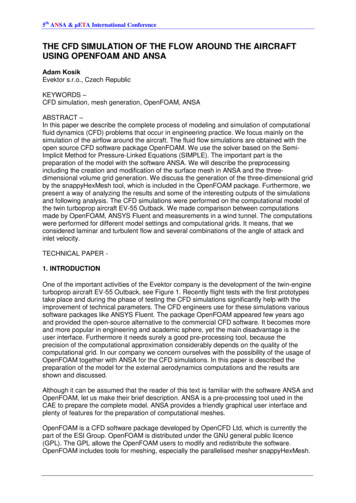
Autodesk Simulation CFD External Airflow Validation: NACA 0012 AirfoilFigure 2. NACA 0012 Experimental Data for Lift (left) and Drag (right)Observations of Experimental DataUpon examining the experimental data above, the following is observed. All measured lift results, especially atlower angles of attack, correlate very well but start to separate at larger angles of attack. Smooth results show extralift before stall followed by much greater spread and more uncertainty.Measured drag shows a more noticeable difference between smooth results and tripped results at lower angles ofattack. It is noticed that the tripped results seem to diverge at larger angles of attack, with the 80-grit results actuallyconverging with the smooth results at larger angles of attackAssessment of Wind Tunnel Results for the NACA 0012 AirfoilThe variability shown above raises the question: how reliable is the test data and which test values should be usedfor validation purposes?It should be recognized that two-dimensional experiments are extremely difficult to achieve. The differences seenabove occur largely at higher angles of attack near stall where the experiment is likely no longer two-dimensional.Because of this difficulty, work at NASA Ames in 1987 looked at the results from over 40 different wind tunnels tocompare tests and quality of results. The results were published in a paper entitled “A Critical Assessment of Wind(3)Tunnel Results for the NACA 0012 Airfoil” . The study showed a range of values and contributed some keyfindings.The following shows a composite of results for NACA 0012 at zero angle of attack (AOA). Figure 3 shows lift-curveslope data in a limited Re range for tests deemed to stand out for “most nearly eliminating the important sources ofwind-tunnel errors”. It is noted that most of the results in this group have no trip. It was found that a good fit of thedata is given by:βClα 0.1025 0.00485 log(Re/106 )Figure 4 shows results for drag coefficient at AOA 0 . The set of data selected for the lift-slope results is collectedas "Group 1". The curves represent approximate fits for Group 1 tripped and Group 1 un-tripped data and are givenby:Tripped:Cd0 0.0017 0.91/(log(Re))2.58Un-Tripped:Cd0 0.0044 0.018Re 0.15
Autodesk Simulation CFD External Airflow Validation: NACA 0012 AirfoilGroup 2 is comprised of tests where data “generally agree with both the lift and drag criteria (expressed in the fitequations) to within /-0.0040 for slope and to within /- 0.0010 for Cd 0.”In summary, test data that falls along the curve fits for Group 1 was determined to provide the most reliable results.Thus, for purposes of evaluating a CFD solution for predicting lift and drag, we will be looking forsimulation outputs to resonably meet those criteria.Figure 3. Experimental Data Scatter – Lift Curve SlopeFigure 4. Experimental Data Scatter - Coefficient of Drag
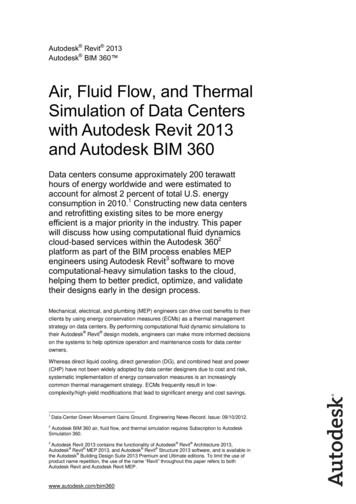
Autodesk Simulation CFD External Airflow Validation: NACA 0012 AirfoilSimulationA 2D NACA 0012 airfoil with chord length of 1 meter was used for simulation. Wind speed was at approximately26.56 m/s representing a Reynolds Number of 1.76 x10 6 (corresponding with test data). The Angle of Attack(AOA) was varied incrementally from -4 deg to 20 deg in order to capture stall as well as some reverse rotation.Simulations were run in Simulation CFD 2015 using standard advanced turbulence techniques with the added useof two specific flag settings available in Simulation CFD to enhance the chosen SST (shear stress transport) komega turbulence model. The following sections detail the CFD simulation, including construction of the airfoilmodel, applied simulation settings and meshing strategy.Figure 5. Simulation SummaryModelThe model was created in Autodesk Inventor Professional by simply entering the 2D equation for the cross section.I-logic was utilized to set up Simulation CFD for a parametric study of several different angles of attack. See Figure6.Figure 6. NACA 0012 Model Created in Autodesk Inventor Professional
Autodesk Simulation CFD External Airflow Validation: NACA 0012 AirfoilModification of Airfoil Trailing TipThe model uses the NACA profile with a small rounded trailing tip instead of a zero thickness tip at the trailing endof the airfoil. Using a zero thickness trailing tip requires modification of the NACA coefficients and results in a slightreduction in angle on the back side due to a numerical geometry closure problem with the true NACA equationcoefficients.Simulation CFD SettingsA few Simulation CFD options were utilized to improve analysis of external aerodynamics in this study. Thesimulation largely followed a typical set-up technique for advanced turbulence modeling, but a couple additionalsolver controls were utilized to enhance the SST k-omega turbulence model for the NACA 0012 airfoil.These options were employed via the following flags for meshing and solver controls - as shown in Figure 7. (Thesesettings were used for all AOA despite different wake activity ensuing at larger angles).Figure 7. Simulation CFD Scenario-Level FlagsMeshingAccuracy for external aerodynamics analysis requires special considerations of mesh quality along the walls of theairfoil. This includes the following considerations: Ensure the flow gradients in the boundary layer are captured within the wall layer elementsAvoid an abrupt change in mesh height at the transition from prism wall layers to triangular elementsHighest accuracy is achieved when y 0.3Three mesher flags were employed; the second two allow adjustment of mesh enhancement beyond what the UIcontrols allow. The meshing process is described in greater detail in the next section.mesh boundarylayer blend - This flag enables smoother mesh around sharp edges – such as the airfoil –and adds more resolution from the wall mesh into the core. Use this flag to introduce smoother meshenhancement layers around sharp edges and other outwardly-protruding geometry features.mesh enhance thick – This flag controls the mesh enhancement layer thickness. It’s value is a percentagemultiplier applied to UI value for layer factor. In this case, it was set to 400 or 400% of layer factor (4x thickerthan default thickness).mesh enhance layers - This flag simply sets the default number of layers generated by Mesh Enhancement.It has been used to add more layers for a total of 15. The UI supports up to 15 layers. This option is shown asa demonstration if more layers are needed and provides a means to enforce certain options.
Autodesk Simulation CFD External Airflow Validation: NACA 0012 AirfoilSolver ControlsSeveral solver flags were used to leverage solver options available for sensitive external aerodynamics analysislike the NACA0012. These included an updated wall force calculator and three advanced turbulence solver controlsused to modify the default SST model.resid bdry force calc 1 – This flag computes the wall forces and properly distributes it from the nodes to thelogical CAD surfaces to report in the wall calculator. (This is a newer form of boundary force calculation,considered more accurate for wall forces.)use sst rc 1 (On) – This modifier helps to yield more accurate flow results such as pressure and velocityfields in devices like cyclones and airfoils - specifically when high flow curvature is critical to the accuracy of ananalysis.sst new iwf 1 (On) – This flag enables a more accurate method of solving for the pressures and velocitiesand temperature near no-slip walls in conjunction with the SST turbulence model.NOTE: Use of the SST Modifiers (previous two flags) is explained in greater detail in Appendix A.Convergence ControlsIn addition to the above enhancements, results were slightly improved with adjustment of convergence controls.Simulation CFD uses several criteria to automatically determine a converged solution and end an analysis.Automatic control is activated by enabling Intelligent Solution Control in the Solution Controls window. ThenAdvanced Solution Control can then be used to select Automatic Convergence Assessment and edit criteriaindividually. In this case, controls were increased to add an order of magnitude to each control. (Usually 1-2 ordersof magnitude are sufficient for sensitive external aerodynamics studies.)Figure 8. Adjusted convergence controls with 2 orders of magnitude adjustments
Autodesk Simulation CFD External Airflow Validation: NACA 0012 AirfoilMeshing and Boundary/Initial ConditionsThe simulation settings described above for meshing center around two goals. First, with a model like the airfoil, itis good to have a gradual transition of element sizes – both within the wall layer and in the transition from wall layerto tetrahedral mesh. The more gradual, the better. Then, the desire is to make sure that the mesh enhancementthickness is thick enough to capture the boundary layer along the walls while maintaining a Y value of less than0.3 for the k-omega SST. Typical refinement regions were incorporated, including two in the wake behind thetrailing tip of the airfoil to capture velocity profile leaving that edge. This is shown in the figures below. The meshscheme is summarized as follows: 15 Enhancement Layersmesh enhance thick (%): 400 (4x layer factor)Layer Factor: 0.84 (Effective layer factor is 336)Airfoil edge mesh: 2.5 mmFirst Region: 5 mmBoundary conditions included velocity coming in, slip conditions on top and bottom and a pressure on the outlet.Additionally, an initial velocity condition was applied to the entire domain. This simply starts the air moving andsaves some iterations in the simulationFigure 9. Airfoil mesh refinement regions
Autodesk Simulation CFD External Airflow Validation: NACA 0012 AirfoilFigure 10. Airfoil trailing tip refinement for wakeFigure 11. 15 Enhancement layers transition to core mesh
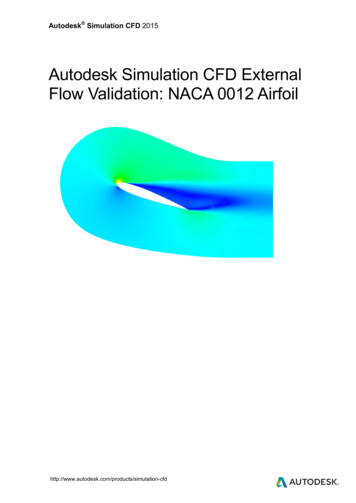
Autodesk Simulation CFD External Airflow Validation: NACA 0012 AirfoilSimulation ResultsThe results of the simulation described above are shown plotted with the referenced experimental data. It can beseen that results for lift are very good up until stall, capturing peak lift at around 15 deg in correlation with the 80-gritmeasurement before tapering off. The drag results also correlate well with the tripped results also up until this samepoint. It is noted here that this correlation has much to do with the SST k-omega turbulence model. The modelassumes a minimum amount of turbulence always exists and does not have a means for solving for a full laminar toturbulence transition. This prevents it from approximating the untripped test data.Figure 12. Experiment vs. Simulation Results for Lift (top) and Drag (bottom)
Autodesk Simulation CFD External Airflow Validation: NACA 0012 AirfoilAs noted earlier, the experimental data shows some variability and results can be evaluated against best practices(referred to as Group 1). It is useful to see where the Simulation CFD results fall within the lift slope and dragcoefficient scatter data shown before. It can be seen below that the simulation results are near the desired curvesfor Group 1 (most ideal tests) for both lift and for measures of tripped drag.Figure 13. Simulation CFD Results Compared to Experimental Data Scatter for Lift (top) and Drag (bottom)
Autodesk Simulation CFD External Airflow Validation: NACA 0012 AirfoilConclusionsIn this study, Simulation CFD was used to analyze 2D external airflow around a given airfoil and predict lift anddrag. Simple meshing enhancements along with advanced turbulence modeling techniques – includingenhancements for the SST k-omega turbulence model - were applied to most accurately simulate the airflow andpredict performance.Performance was evaluated against industry-standard test data. Results for lift were very good all the way up tostall, capturing peak lift at 15 deg. For both lift and drag, results correlate well with the experimental results for“tripped” surfaces – particularly the 80-grit – more so than “smooth” surfaces. It was noted that CFD predictionsobtained via a turbulence model (such as the SST k-omega applied in this scenario) will inherently correlate morewith a surface that prompts turbulent flow rather than laminar.Results show less correlation after the predicted stall angle. It was noted that at high angles of attack there isincreased wake activity and experimental conditions at this point are likely exceeding 2-dimensional flow. However,there is perhaps more that can be done to achieve greater correlation at larger angles of attack – such as includingmore mesh or looking at oscillations in instances of large wake structures.Works Cited1. Ladson, Charles. Effecgts of Independent Variation of Mach and Reynolds Numbers on the Low-SpeedAerodynamic Characteristics of the NACA 0012 Airfoil Section. s.l. : NASA Langley, 1988. NASA TechnicalMemorandum 4074.2. Shedahl, Robert and Paul, Kilmas. Aerodynamic Characteristics of Seven Symetrical Airfoil Sectoin Throug180-Degree Angle of Attack for Use in Aerodynamic Analysis of Vertical Axis Wind Turbines. s.l. : Sandia , 1981.SAND80-2114.3. McCroskey, W. J. A Critical Assessment of Wind Tunnel Results for the NACA 0012 Airfoil. s.l. : NASA AmesResearch Center, 1987. NASA Technical Memorandum 100019.4. Numerical Study Comparing RANS and LES Approaches on a Circulation Control Airfoil. Rumsey, ChristopherL., Nishinio, Takafumi. 5, s.l. : International Journal of Heat and Fluid Flow, October 2011, Vol. 32, pp. 847-864.
Autodesk Simulation CFD 2015Appendix A - Use of Special Flags ExplainedUse of both of the SST modification flags was required to get good correlation with test data.The use sst rc flag applies a Hellsten curvature correction factor to the SST k-omega turbulence model. This wasapplied to address what is known as the Coanda Effect – or the tendency for a fluid jet to be attracted to a nearby(4)surface. This is illustrated in the following figure taken from a paper out of NASA Langley . In Figure 14, testresults show how the fluid flowing over the back side of an airfoil has a tendency to pull away or separate from theairfoil. By comparison, the simulations at the right show results with and without SST RC. Without this correction, itcan be seen that the fluid does have a tendency stick to the airfoil and pull around to the underside – actuallyflowing forward. Once the curvature correction is applied, it can be seen that the fluid is predicted to separate fromthe curved tail. Figure 15shows Simulation CFD results with the curvature correction. It can be seen that thesimulation captures the separation and the recirculation region in front of the separation.Using this option should slightly slow down the time to convergence and most large body external aerodynamicsmodels shouldn’t need to use this option. This is why this is off by default.(4)Figure 14. Coanda Effect - Results from NASA LangleyFigure 15. Example effects of use sst rc flagThe sst new iwf flag is used to implement a k-omega SST slip wall formulation. This flag allows for a non-zerovelocity at the wall. This method has shown to be a more accurate method of solving for the pressures, velocitiesand temperature near walls in conjunction with the SST turbulence model.Note: There is a slip wall formulation for the k-e model as well.Autodesk [and other products] are registered trademarks or trademarks of Autodesk, Inc., and/or its subsidiaries and/or affiliates in theUSA and/or other countries. All other brand names, product names, or trademarks belong to their respective holders. Autodeskreserves the right to alter product and services offerings, and specifications and pricing at any time without notice, and is notresponsible for typographical or graphical errors that may appear in this document. 2015 Autodesk, Inc. All rights reserved.
The following paper details a recent validation study examining the ability of Autodesk Simulation CFD to conduct a 2D simulation of airflow around a standard NACA airfoil and predict lift and drag. Results were . The model was created in Autodesk Inventor Professional by simply entering the 2D equation for the cross section.