Transcription
Autodesk Revit 2013Autodesk BIM 360 Air, Fluid Flow, and ThermalSimulation of Data Centerswith Autodesk Revit 2013and Autodesk BIM 360Data centers consume approximately 200 terawatthours of energy worldwide and were estimated toaccount for almost 2 percent of total U.S. energyconsumption in 2010.1 Constructing new data centersand retrofitting existing sites to be more energyefficient is a major priority in the industry. This paperwill discuss how using computational fluid dynamicscloud-based services within the Autodesk 3602platform as part of the BIM process enables MEPengineers using Autodesk Revit3 software to movecomputational-heavy simulation tasks to the cloud,helping them to better predict, optimize, and validatetheir designs early in the design process.Mechanical, electrical, and plumbing (MEP) engineers can drive cost benefits to theirclients by using energy conservation measures (ECMs) as a thermal managementstrategy on data centers. By performing computational fluid dynamic simulations to their Autodesk Revit design models, engineers can make more informed decisionson the systems to help optimize operation and maintenance costs for data centerowners.Whereas direct liquid cooling, direct generation (DG), and combined heat and power(CHP) have not been widely adopted by data center designers due to cost and risk,systematic implementation of energy conservation measures is an increasinglycommon thermal management strategy. ECMs frequently result in lowcomplexity/high-yield modifications that lead to significant energy and cost savings.1Data-Center Green Movement Gains Ground. Engineering News-Record. Issue: 09/10/2012.2Autodesk BIM 360 air, fluid flow, and thermal simulation requires Subscription to AutodeskSimulation 360.3Autodesk Revit 2013 contains the functionality of Autodesk Revit Architecture 2013,Autodesk Revit MEP 2013, and Autodesk Revit Structure 2013 software, and is available inthe Autodesk Building Design Suite 2013 Premium and Ultimate editions. To limit the use ofproduct name repetition, the use of the name “Revit” throughout this paper refers to bothAutodesk Revit and Autodesk Revit MEP.www.autodesk.com/bim360
AIR, FLUID FLOW, AND THERMAL SIMULATION OF DATA CENTERSComputational fluid dynamics (CFD) contributes to ECMs by helping designersexamine and improve airflow management. CFD analysis can be performed on datacenters to examine hot aisle/cold aisle arrangements, intelligent placement of floortiles, and baffle curtains orblanking panels to preventimproper mixing andexhaust recirculation.Retrofits or carefulplacement of CRAC(computer room airconditioner) or CRAH(computer room airhandler) units can alsodeliver major benefits.Insights early in the design processWith help from Revit and computational fluid dynamics, data center designers cansimulate the airflow and thermal response for new designs well before ground isbroken at the site. CFD supports visualization of exhaust flow recirculation,understanding of pressure and flows in the subfloor, and quick identification of areaswhere cool air bypasses server racks. These insights enable designers to morequickly optimize tile configurations, evaluate the impact of new CRAC units orsubfloor baffles, and experiment with failure scenarios or rack-load cycling.Common analysis targetsinclude pressuredistributions, rack inlet andexhaust temperatures,CRAC set points andreturn temperatures,vectors, tracers, and eventransient thermalresponses when losingCRAC units.A near unlimited number ofvirtual thermocouples andrack monitors can beincluded in the analysis.Once the baseline ischaracterized and outputs are defined, simulations examining other design optionscan be set up within minutes. By helping MEP engineers to investigate multipledesign strategies to help converge on the optimal solution, designers can providemore effective and efficient scenarios to their clients.For retrofits, the MEP engineer can use existing drawings or site measurements tomodel the existing data center, characterize performance, and then implement ECMsvirtually to help determine energy savings, break-even points, and year-over-year costsavings once the changes are implemented.A real-world air, fluid flow, and thermal simulation exampleThe following images and scenarios represent a real-world example and results from using air, fluid flow, and thermal simulation in a data center environment. AutodeskSimulation CFD software was used to perform air, fluid flow, and thermal simulation2
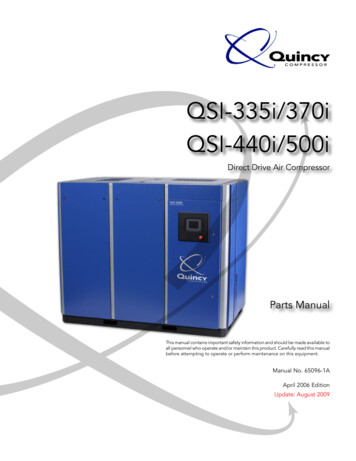
AIR, FLUID FLOW, AND THERMAL SIMULATION OF DATA CENTERSon the proposed layout of a data center, as well as on two modified configurations ofthe same data center. Flow and heat transfer phenomenon were studied: from the CRAC units in the subfloor region through the floor tiles in the code aisles around and through the cabinets and other obstructions through the ceiling tiles in the host aisles around the plenum in the ceiling of the data center back into the CRAC unitsParticular attention was paid to the heat distribution across the rear of the cabinets inthe hot aisles, with the goal of attaining even temperature distribution across thebacks of all cabinets, and to determine if temperatures exceeded serverspecifications.Using Revit, three-dimensional models were created and used for analysis withinAutodesk Simulation solutions. These models provided more accuraterepresentations of: the cabinets; combined server thermal and fan performance;ceiling and floor tiles of various free area ratios; internal fencing; CRAC units;subfloor; and above-ceiling plenums.Simulation assumptionsCertain assumptions were made for these simulations: Steady state conditions Incompressible flow Standard atmospheric conditions Constant flow rates for all blowers and fans, including servers and CRACunits Constant 55 F air supplied by CRAC units Even distribution of heat and airflow within each cabinet No heat loss through walls, floors, or ceilingSimulation setupCabinet data was based on the Energy Star Power and Performance data sheet forthe Dell PowerEdge R610 with high-output 717W power supply. The maximum heatload condition of 425W per unit was assumed, as was the nominal airflow (26 cfm) atnominal ambient air temperature (65 F to 80 F). This constitutes a conservativeperformance scenario, as opposed to using lower heat loads and/or higher fan ratesat higher nominal air temperatures. The data center configuration was based on theassumption that 14kW cabinets would hold 30 servers per cabinet, 7kW cabinets held15 servers per cabinet, and 2.5kW cabinets held 7 servers per cabinet.3
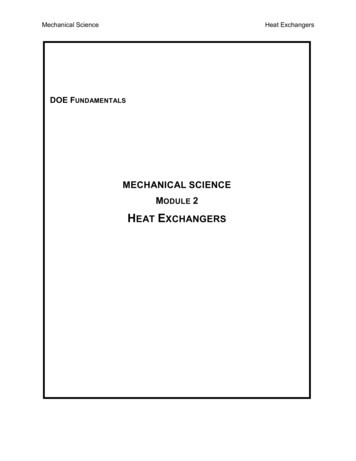
AIR, FLUID FLOW, AND THERMAL SIMULATION OF DATA CENTERSFigure 1. Model views ready for simulation setup.Baseline resultsExamining the temperatures across the back planes of the cabinets shows a mostlyuniform temperature distribution across all cabinets. There are areas, however, wherethere are higher temperature concentrations. These areas are at the ends of the hotaisles and can be seen below. The temperature rise from inlet to exhaust of all othercabinets is approximately 86 F, in keeping with the Energy document provided byDell for these systems.Figure 2. Localizedincrease in cabinetexhaust temperatures atends of hot aisles.Further examination of the flow fields showed that hot exhaust air was escaping fromaround the corners of the cabinets therefore driving up local temperatures.Figure 3. Closer viewof exhaust air escapepatterns.4
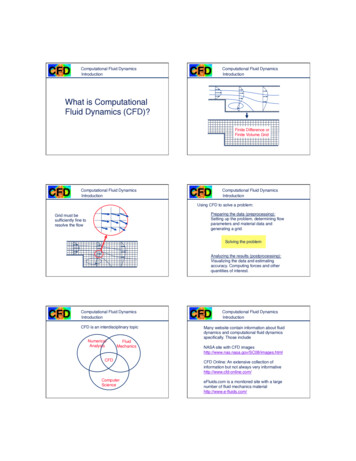
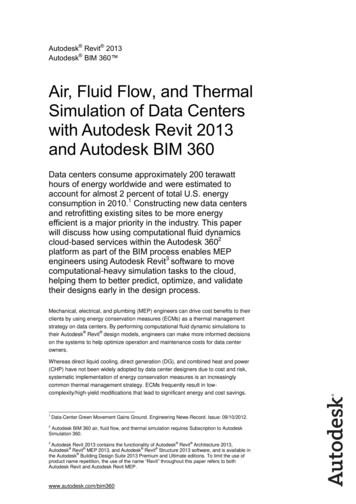
AIR, FLUID FLOW, AND THERMAL SIMULATION OF DATA CENTERSAn air curtain was created in hopes of containing the escaping hot aisle air andthereby reducing the temperature concentrations on cabinets at the end of the aisles.While all other setup conditions were unchanged, additional floor and ceiling tileswere added to create an air curtain effect at openings in the hot aisle.Figure 4. Air curtainmodel setup. PlanView – Main Floor.The hot aisle with the added air curtain feature shows a notable reduction of the hightemperature concentrations at the end of the modified aisle.Figure 5. Equalcabinet exhausttemperatures at endsof hot aisle with aircurtainReviewing the flow fields in these areas reveals that hot exhaust air from the cabinetsis now contained around these corners, providing uniform temperatures across allunits in this aisle.5
AIR, FLUID FLOW, AND THERMAL SIMULATION OF DATA CENTERSFigure 6. Cabinetexhaust air containedin hot aisle. Note morevertical flow thanbaseline simulation.Design requirements for the data center changed, requiring more cabinets.Rearranging the location of the higher-density cabinets also required a different floortile distribution, as shown below. All other setup information is the same as for the aircurtain simulation. The additional cabinets are still within the max temperature gainexpressed by Dell for the individual systems, implying that there is adequate coolingfor the additional systems. Temperature distribution is still even across the backs ofthe cabinets in the hot aisle contained with the air curtain. In contrast, the new row ofcabinets is showing signs of temperature increase near the ends of the aisles.Figure 7. Aerial model view of cabinet exhaust aircontained in hot aisle.Figure 8. Additional cabinet configuration showingtemperature increase.ConclusionsAirflow in the subfloor plenum appears evenly distributed so as to provide evencooling to the entire data center across a range of cabinet floor/ceiling tileconfigurations. Tile opening sizes and locations appear adequate for providingsufficient cooling for each cabinet and for evenly distributing the cooling amongcabinets of different densities. However, the addition of partially open floor and ceilingtiles around gaps in the aisles and at the ends of the aisles may provide bettercontainment of hot aisle exhaust, and therefore better cooling of cabinets at the ends6
AIR, FLUID FLOW, AND THERMAL SIMULATION OF DATA CENTERSof aisles and near gaps in the cabinet spacing. Finally, there appears to be adequatecooling for additional cabinets.Autodesk Revit software and air, fluid flow, and thermal simulation enabled a betterunderstanding of air, fluid flow, and thermal simulations and how those aspects wouldaffect the overall operation of the data center. These insights enabled the MEPengineers to make better design decisions before construction took place, helping toprovide an optimum scenario to the owner.Autodesk, AutoCAD, BIM 360, and Revit, are registered trademarks or trademarks of Autodesk, Inc., and/or itssubsidiaries and/or affiliates in the USA and/or other countries. All other brand names, product names, ortrademarks belong to their respective holders. Autodesk reserves the right to alter product and servicesofferings, and specifications and pricing at any time without notice, and is not responsible for typographical orgraphical errors that may appear in this document. 2012 Autodesk, Inc. All rights reserved.7
Autodesk Simulation CFD software was used to perform air, fluid flow, and thermal simulation . AIR, FLUID FLOW, AND THERMAL SIMULATION OF DATA CENTERS 3 on the proposed layout of a data center, as well as on two modified configurations of the same data center. Flow and heat transfer phenomenon were studied: