Transcription
The Current Risk LandscapeAxioma Insight FindingsYear To Date 2014Melissa R. Brown, CFASenior Director of Applied Research
About Axioma Axioma provides portfolio construction andrisk modeling tools to asset managers andasset owners Today we will discuss some of the findingsand insights about the market landscapefrom our risk models First, a quick review of the nature of therisk models2
Axioma Risk Models Axioma’s standard product includes 4 risk models per region By horizon– Short horizon: 1 to 2 month forecast– Medium horizon: 3 to 6 month forecast By factor structure– Fundamental: uses predefined set of factors, such as country,industry, currency, style– Statistical: “lets the data speak” Models are provided for 14 countries/regions/global Most models in this analysis are country or region specific– E.g. we use the Japanese model to analyze Japan, not Japan’sresults from the global model In addition, there is a macroeconomic model for the US Underlying each model is a set of volatilities and correlations, sowe can “peel the onion” and see what is driving market risk
Themes: January - September Risk rose substantially in Q1, but then fell starting in April, and continueddown steadily throughout the third quarter in many regions In general risk fell in equities, bonds, currencies and CDS Even some geopolitical hot spots did not see risk increase Country, currency, and market risk all fell Low correlations: investors less concerned about global contagion Emerging market risk increased relative to developed, but the risk-returntradeoff looked better than in the recent past Trading volume was down Was risk “too low”? Historically: Periods of low risk have lasted longer Risk started to rise well before the market peak Market returns were better after low risk periods No strong evidence that risk was about to take off Copyright, Axioma, Inc. 2014. All rights reserved4
Current Themes: Since the End of Q3 Risk jumped, but leveled off quickly, and remains closer to historic lowsthan to highs Aggregate country, currency, and market risk all increased; country andmarket risk have dropped but currency risk did not Correlations increased, but in most cases remain well below peak levels Emerging market risk increased relative to developed, but emergingmarket risk was below developed market Individual currency risk jumped sharply, as did country risk for mostcountries Recent trading volume peaked in October but fell back down No strong evidence that the market is ready for a big correction and thatrisk is about to take off Copyright, Axioma, Inc. 2014. All rights reserved5
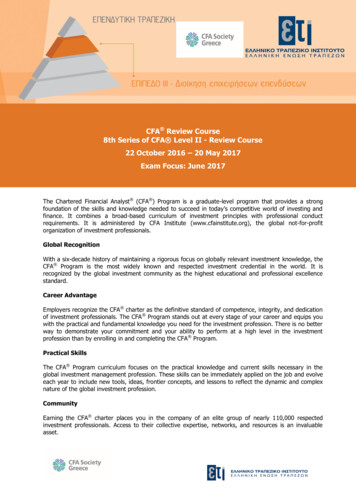
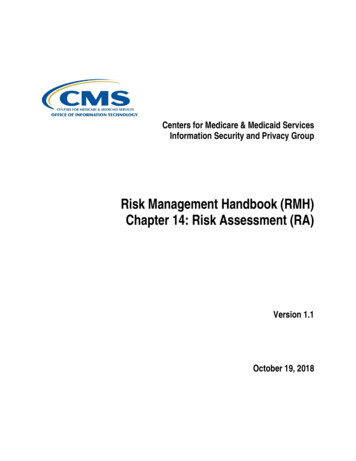
Risk Rose Vs. Last Quarter and Last Year; Japan Had the HighestRiskShort-Horizon Predicted 15105North AmericaEuropeAsia-PacificGlobal*FTSE Europe minus FTSE Eurobloc**FTSE Developed Europe minus FTSE Eurobloc***Portugal, Italy, Ireland, Greece and Spain from FTSE EuroblocSource: FTSE, Russell Investments, Standard & Poor's, China Securities Index Company, Ltd, Axioma Inc. Copyright, Axioma, Inc. 2014. All rights reservedFTSE-All WorldFTSE EmergingFTSE DevelopedFTSE JapanChina CSI 300SP-ASX 200FTSE Asia Pacific ex-JapanFTSE Asia PacificEuro Crisis***Non-Eurobloc*FTSE EuropeFTSE EuroblocFTSE 350TSX CompositeRussell 2000Russell 100006
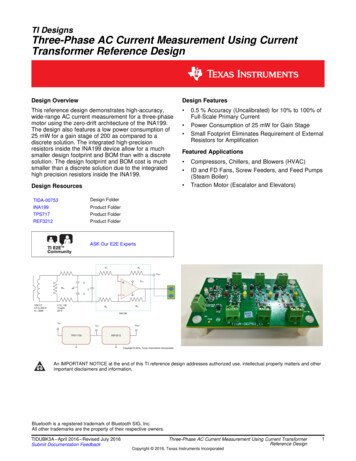
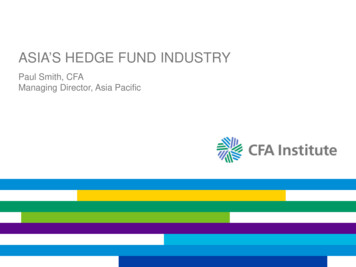
Asian Risk Has Not Followed US, EU, JP and CA UpShort-Horizon Fundamental Risk Forecast17%28%15%23%13%18%11%13%9%8%7%Jan Feb Mar Apr May JunRussell 1000Jan Feb Mar Apr May JunJul Aug Sep Oct NovRussell 2000TSX CompositeFTSE JapanCSI 300Jul Aug Sep Oct NovFTSE APxJPASX 20016%15%17%14%15%13%12%13%11%10%11%9%9%8%Jan Feb Mar Apr May Jun7%Jan Feb Mar Apr May JunJul Aug Sep Oct NovFTSE Global DevelopedJul Aug Sep Oct NovFTSE EmergingFTSE Developed EuropeSource: FTSE, Russell Investments, Standard & Poor’s, China Securities Index Co., Axioma Inc. Copyright, Axioma, Inc. 2014. All rights reserved7
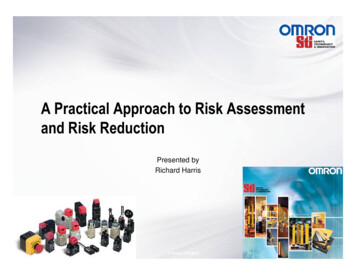
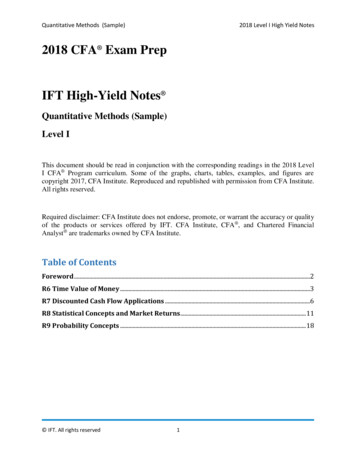
The Large vs. Small Calculus has Changed1.8Russell 2000 vs. Russell 1000 Risk1.7July 25, 20141.61.51.41.31.21.1120072008200920102011Medium HorizonSource: Russell Investments, Axioma Inc. Copyright, Axioma, Inc. 2014. All rights reserved201220132014Short Horizon8
Developed Markets:Market and Country Risk Backed DownBut Currency Risk Remains .3%7.0%7.0%1.2%JanFeb MarAprMayJunSource: FTSE, Axioma, IncJulAugSepOct1.2%JanFeb MarApr May JunJulAug Sep OctNovNov. Copyright, Axioma, Inc. 2014. All rights reserved9
Developed Markets: Individual Currency Volatility Fell FromLast Year Through Q3 But Retraced That Drop Since SeptemberChange in Currency Volatility (vs. USD)Developed CADGBPSource: Axioma, Inc.AUDDKKEURSGD Copyright, Axioma, Inc. 2014. All rights reservedCHFJPYNZDSEKNOKThrough November 28, 201410
Developed Markets:Individual Country Risk Was MixedThrough Q3 But Shot Up In The Last Two Months80%Change in Extra-Market Country Volatility: DevelopedJan-Sep60%QTD40%20%0%-20%-40%Source: Axioma, Inc. Copyright, Axioma, Inc. 2014. All rights reservedThrough November 28, 201411
Sovereign Yields Have Remained Subdued6%Sovereign Yields5%4%3%2%1%0%JanFebMarUSIrelandSource: Markit, Axioma, sPortugalOctNovFrance. Copyright, Axioma, Inc. 2014. All rights reserved12
Japan’s Bond Volatility Stands Out14%20-Day Volatility12%JapanUS10%8%6%4%2%0%JanFebSource: Markit, Axioma, IncMarAprMayJunJulAugSepOctNov. Copyright, Axioma, Inc. 2014. All rights reserved13
CDS Spreads: Up Less Than Equity ource: Markit, Axioma, IncMaySpainJunIrelandJulAugItalySepOctNovPortugal. Copyright, Axioma, Inc. 2014. All rights reserved14
Emerging Markets: Market Risk Rose and Country Risk Was UpSlightly But Currency Risk Rose and Remains ElevatedFTSE Emerging Markets 0%2.0%7.0%1.5%6.5%7.0%1.5%6.0%1.0%Jan6.0%Feb MarAprMayJunJulAugSepOctNov1.0%JanFeb MarAprMaySource: FTSE, Axioma, IncJunJulAugSepOctNov. Copyright, Axioma, Inc. 2014. All rights reserved15
Emerging Markets: Volatility For Most Currencies FellEarlier This Year But Turned Up QTD80%Change in Currency Volatility (vs. TRYZARTHBMXNINR* UAH down 13% QTDSource: Axioma, Inc. Copyright, Axioma, Inc. 2014. All rights reservedThrough November 28, 201416
Emerging Markets: Individual Country Volatility WasMixed Through Q3 But Has Increased For Most QTDChange in Extra-Market Country Volatility: Emerging80%Jan-Sep60%QTD40%20%0%-20%-40%-60%* Ukraine risk rose 77% through Q3 and 8% QTDSource: Axioma, Inc. Copyright, Axioma, Inc. 2014. All rights reservedThrough November 28, 201417
As in Developed, Sovereign Yields Have Been Subdued14%Sovereign aMalaysiaMexicoBrazilRussiaSouth AfricaIndiaTurkeySource: Markit, Axioma, Inc. Copyright, Axioma, Inc. 2014. All rights reservedSepOctNovIndonesia18
CDS Spreads Have Also Remained Largely e: Markit, Axioma, IncAprMalaysiaMayJunChinaJulIndonesiaAugSepSouth AfricaOctNovMexico. Copyright, Axioma, Inc. 2014. All rights reserved19
EM Risk/Reward Has Improved40%40%December 31, 30%40% Copyright, Axioma, Inc. 2014. All rights reservedDecember 1, 20140%10%20%30%40%20
Emerging Market SH Risk Below DevelopedEmerging vs. Developed : FTSE, Axioma Inc. Copyright, Axioma, Inc. 2014. All rights reserved201120122013201421
Short-Horizon Risk Has Tended to Rise Substantiallyin Advance of Market Peaks60%50%40%Sep 1987Oct 199730%Jul 1990Oct 200220%10%Mar 2001Oct 20070%1982 1984 1986 1988 1990 1992 1994 1996 1998 2000 2002 2004 2006 2008 2010 2012 2014Source: Axioma Inc. Copyright, Axioma, Inc. 2014. All rights reserved22
Low Risk Periods Were Followed By Better Returns On Average4.0%Subsequent 3-month ighRisk regimeSource: Axioma Inc. Copyright, Axioma, Inc. 2014. All rights reserved23
VIX and VSTOXX: Well Below Previous PeaksVIXVSTOXXVIX AverageVSTOXX 2010020072008200920102011201220132014Average since 1999Source: Yahoo! Finance, STOXX, Axioma Inc. Copyright, Axioma, Inc. 2014. All rights reserved24SepNov
What Drives the Change in Risk?We look at the contribution to the change in risk from each of theunderlying components1. Last quarter’s risk model with current portfolio constituents andweights change from portfolio composition2. Current exposures change from stock characteristics3. Current specific risk estimates and last quarter’s covariancematrix change from specific risk4. Current data except last quarter’s correlations change fromfactor volatilities5. Residual is change from factor correlationsWe then do a similar breakdown using the full asset covariancematrix and look at change from portfolio composition, stockvolatilities and asset-asset correlations Copyright, Axioma, Inc. 2014. All rights reserved25
Factor and Stock Volatility Up QTD, As are AssetCorrelationsDecomposition of the October-November change in 5%-1.0%0.0%-0.5%-2.0%PortfolioStockcomposition ityPortfolioStockcomposition 0.5%-1.0%Portfolio compositionStock volatilityStock correlations-0.5%Portfolio compositionStock volatilityStock correlationsSource: Russell Investments, FTSE, Standard & Poor’s, Axioma Inc. Copyright, Axioma, Inc. 2014. All rights reserved26
Realized Correlations, While Up, Still Nearer Historical LowsMedian 60-day asset-asset correlationRussell 1000Russell 2000FTSE Japan0.80.80.70.70.60.60.50.50.4CSI 3000.40.30.30.20.20.1020000.12002200420062008FTSE Developed Europe0.7201020122014020002004FTSE Asia 620082010FTSE Developed0.400.602000200220122014FTSE 0220042006Source: FTSE, Russell Investments, China Securities Index Company Ltd., Axioma Inc. Copyright, Axioma, Inc. 2014. All rights reserved200820102012201427
Stock-Picking Remains ChallengingCross-Sectional 05200620072008Russell 1000 (Left Scale) Copyright, Axioma, Inc. 2014. All rights reserved200920102011201220132014Russell 2000 (Left Scale)28
Trading Volume Recovered, But Has Dipped Back Down Russell 1000FTSE Developed EuropeSource: Axioma Inc. Copyright, Axioma, Inc. 2014. All rights reserved29
Asian Market Volume Was Different FTSE Asia Pacific ex JapanFTSE JapanSource: Axioma Inc. Copyright, Axioma, Inc. 2014. All rights reserved30
More in Developed Than EmergingFTSE Developed MarketsFTSE Emerging MarketsSource: Axioma Inc. Copyright, Axioma, Inc. 2014. All rights reserved31
Factor Performance:Momentum a Strong Factor in EM, JunJPAugAUWWOctEMSource: Axioma Inc. Copyright, Axioma, Inc. 2014. All rights reservedValueDecFebUSEUAprAPJunJPAugAUOctWWEM32
Factor Performance:Illiquid stocks in Japan have done well, low volatility has been -14-16DecUSFebEUAprAPJunJPAugAUWWOctEM-8DecSource: Axioma Inc. Copyright, Axioma, Inc. 2014. All rights reservedUSFebEUAprAPJunJPAugAUWW33OctEM
Factor Performance:Size Has Had Mixed Returns Across Regions6Size420-2-4-6-8DecFebUSEUAprAPSource: Axioma Inc. Copyright, Axioma, Inc. 2014. All rights reservedJunJPAugAUOctWWEM34
No Risk Surprise? Risk spreads highlight differences in forecasts between models– Total risk spread– Short-medium spread– Statistical-fundamental spread Risk spreads can tell us something about the future of predictedrisk– Medium-horizon follows short-horizon– Stat higher than fundamental may mean under-prediction– Look at the R-squared of stat vs. fundamental Copyright, Axioma, Inc. 2014. All rights reserved35
No Risk Surprise?Risk Spreads Do Not Suggest Hidden Risk3.0%Statistical - Fundamental Short6.0%Fundamental 6.0% Copyright, Axioma, Inc. 2014. All rights reservedJanFebMarAprMayJunJulAugSepOctSource: FTSE, Russell Investments, Standard &Poor’s, Axioma Inc.Nov36
Daily Risk Monitors We provide daily risk monitors for– US– Canada– Europe– Asia-Pacific ex-Japan– Japan– China– Australia– Taiwan– Emerging Markets– Global Developed Look on www.axioma.com for daily updates of this data Sign up to get a weekly reminder about the reports Copyright, Axioma, Inc. 2014. All rights reserved37
Summary A “mini-correction” in early October drove an increase in risk, offhistorically low levels in many regions. Volatility has since backeddown. VIX and VSTOXX showed a similar pattern. For a global benchmark market, country and currency risk were allup in October, but currency risk remained elevated while othercomponents backed off. Volatility of most currencies relative to USD increased sharply in Q4 Individual country volatility changes were more mixed In the US, after a peak in relative volatility in July, small-capstocks have fallen to low volatility levels relative to large-cap. While volatility has gone up recently, driving risk up, the impact ofasset correlations has also been surprisingly high. The risk-return tradeoff for emerging markets versus each other,and for emerging versus developed markets, has shifted. Equity market risk did not spilled over to bond or CDS markets. Trading volume has fallen back down in the US and Europe, butremains above six-month lows in Asia and Emerging Markets. Copyright, Axioma, Inc. 2014. All rights reserved38
Summary: The Risk Outlook Remains Positive Periods of low risk have lasted longer, risk started to rise wellbefore the market peak and market returns were better after lowrisk periods. Risk spreads suggest there is nothing “bubbling under thesurface” that might lead to a sudden pop in risk. Factor returns have not been unusually high or low, which maysignal a shift in market sentiment. Thus we remain cautiously optimistic that we are not about tosuddenly enter a period of high risk. Copyright, Axioma, Inc. 2014. All rights reserved39
Axioma Risk Models Axioma’s standard product includes 4 risk models per region By horizon – Short horizon: 1 to 2 month forecast – Medium horizon: 3 to 6 month forecast By factor structure – Fundamental: uses predefined set o