Transcription
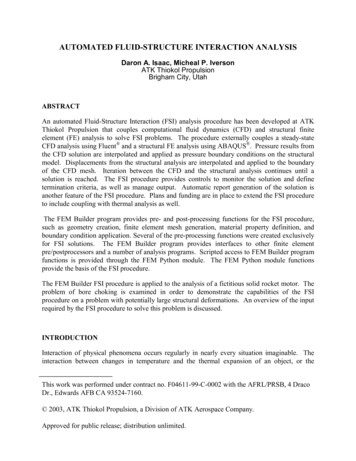
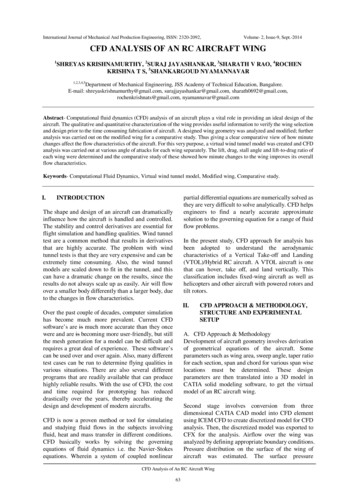
International Journal of Mechanical And Production Engineering, ISSN: 2320-2092,Volume- 2, Issue-9, Sept.-2014CFD ANALYSIS OF AN RC AIRCRAFT WING1SHREYAS KRISHNAMURTHY, 2SURAJ JAYASHANKAR, 3SHARATH V RAO, 4ROCHENKRISHNA T S, 5SHANKARGOUD NYAMANNAVAR1,2,3,4,5Department of Mechanical Engineering, JSS Academy of Technical Education, Bangalore.E-mail: shreyaskrishnamurthy@gmail.com, surajjayashankar@gmail.com, sharath0692@gmail.com,rochenkrishnats@gmail.com, nyamannavar@gmail.comAbstract- Computational fluid dynamics (CFD) analysis of an aircraft plays a vital role in providing an ideal design of theaircraft. The qualitative and quantitative characterization of the wing provides useful information to verify the wing selectionand design prior to the time consuming fabrication of aircraft. A designed wing geometry was analyzed and modified; furtheranalysis was carried out on the modified wing for a comparative study. Thus giving a clear comparative view of how minutechanges affect the flow characteristics of the aircraft. For this very purpose, a virtual wind tunnel model was created and CFDanalysis was carried out at various angle of attacks for each wing separately. The lift, drag, stall angle and lift-to-drag ratio ofeach wing were determined and the comparative study of these showed how minute changes to the wing improves its overallflow characteristics.Keywords- Computational Fluid Dynamics, Virtual wind tunnel model, Modified wing, Comparative study.I.partial differential equations are numerically solved asthey are very difficult to solve analytically. CFD helpsengineers to find a nearly accurate approximatesolution to the governing equation for a range of fluidflow problems.INTRODUCTIONThe shape and design of an aircraft can dramaticallyinfluence how the aircraft is handled and controlled.The stability and control derivatives are essential forflight simulation and handling qualities. Wind tunneltest are a common method that results in derivativesthat are highly accurate. The problem with windtunnel tests is that they are very expensive and can beextremely time consuming. Also, the wind tunnelmodels are scaled down to fit in the tunnel, and thiscan have a dramatic change on the results, since theresults do not always scale up as easily. Air will flowover a smaller body differently than a larger body, dueto the changes in flow characteristics.In the present study, CFD approach for analysis hasbeen adopted to understand the aerodynamiccharacteristics of a Vertical Take-off and Landing(VTOL)/Hybrid RC aircraft. A VTOL aircraft is onethat can hover, take off, and land vertically. Thisclassification includes fixed-wing aircraft as well ashelicopters and other aircraft with powered rotors andtilt rotors.II.Over the past couple of decades, computer simulationhas become much more prevalent. Current CFDsoftware’s are is much more accurate than they oncewere and are is becoming more user-friendly, but stillthe mesh generation for a model can be difficult andrequires a great deal of experience. These software’scan be used over and over again. Also, many differenttest cases can be run to determine flying qualities invarious situations. There are also several differentprograms that are readily available that can producehighly reliable results. With the use of CFD, the costand time required for prototyping has reduceddrastically over the years, thereby accelerating thedesign and development of modern aircrafts.CFD APPROACH & METHODOLOGY,STRUCTURE AND EXPERIMENTALSETUPA. CFD Approach & MethodologyDevelopment of aircraft geometry involves derivationof geometrical equations of the aircraft. Someparameters such as wing area, sweep angle, taper ratiofor each section, span and chord for various span wiselocations must be determined. These designparameters are then translated into a 3D model inCATIA solid modeling software, to get the virtualmodel of an RC aircraft wing.Second stage involves conversion from threedimensional CATIA CAD model into CFD elementusing ICEM CFD to create discretized model for CFDanalysis. Then, the discretized model was exported toCFX for the analysis. Airflow over the wing wasanalyzed by defining appropriate boundary conditions.Pressure distribution on the surface of the wing ofaircraft was estimated. The surface pressureCFD is now a proven method or tool for simulatingand studying fluid flows in the subjects involvingfluid, heat and mass transfer in different conditions.CFD basically works by solving the governingequations of fluid dynamics i.e. the Navier-Stokesequations. Wherein a system of coupled nonlinearCFD Analysis of An RC Aircraft Wing63
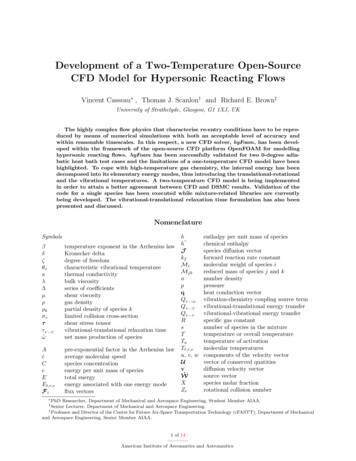
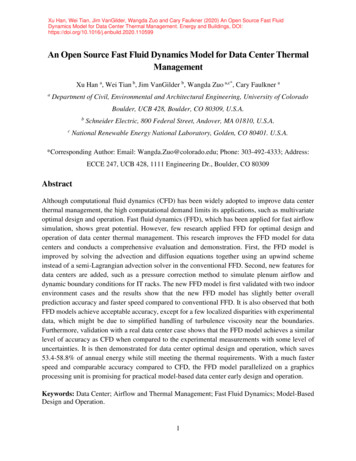
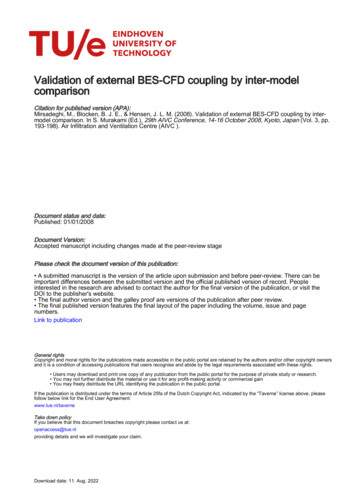
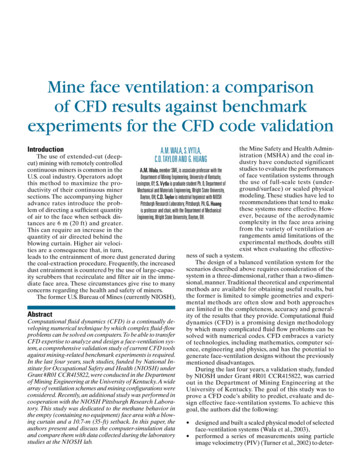
International Journal of Mechanical And Production Engineering, ISSN: 2320-2092,distribution data was used for calculations ofaerodynamics characteristics of wing such ascoefficient of lift ‘CL’ and coefficient of drag ‘CD’ atvarious angle of attack ‘α’. Flow visualization modulein the Post Processor of CFX was used to locate thecritical area with possible turbulence reduction.Volume- 2, Issue-9, Sept.-20140.08m from aerodynamic center. Fig. 2 shows thewing of Prototype-I.B. StructureThe structure of the wing of the aircraft plays a majorrole in determining the flow characteristics. Thespecifications of the wing are as follows:Fig. 2 - Wing structure of Prototype-I.i.ii.iii.iv.v.vi.Airfoil – GOE523Semi wing span ‘S’ – 0.74mSurface area ‘A’ – 0.2195m2Root chord ‘Cr’ – 0.16mTip chord ‘Ct’ – 0.07mCruise speed/velocity ‘v’ – 20m/sThe wing is rectangular from the root to 0.4 m of semiwing span, the wing sweep starts from 0.4m and endswith a tip chord length of 0.07m. The wing has adihedral angle of 3 from 0.4 m semi span (i.e. fromthe point where the sweep begins).Fig. 3 - Wing structure of Prototype-II.For Prototype-II, the position of the cutout for themechanism to be placed was changed to a distance of0.16m from root with a rectangular cross-section of10mm. Fig. 3 shows the wing of Prototype-II.Since the wing used was that of a VTOL/Hybridaircraft, the wing had to accommodate a beam, due towhich a rectangular cut out had to be made. The initialCFD analysis of the wing (Prototype-I) showed highturbulence near the cutout thus few modificationswere made. The modified wing profile (Prototype-II)was subjected to further simulations. The RC aircraftunder study is shown in Fig. 1.C. Experimental SetupA low speed wind tunnel was created to test the wingin subsonic conditions. This wind tunnel designed, i.e.domain was of a cuboid shape with dimensions 3.2 mx 3.7 m x 3.2 m. The tests were conducted at mean sealevel conditions, i.e. boundary conditions, taking anair speed of 20 m/s at various angle of attacks between0 to 20 . Only one half of the wing was considereddue to its symmetric nature so as to reducecomputational effort. A 3D unstructured tetrahedralmesh was utilized for computing the flow around themodel as shown in Fig. 4. Unstructured mesh wasappropriate due to the complexity of the model. Theadvantages of the unstructured mesh are shorter timeconsumption in grid generation for complicatedgeometries and the potential to adapt the grid toimprove the accuracy of the computation. After themeshing process, the mesh was examined for quality.Fig. 1 - CATIA model of the VTOL/Hybrid Aircraft.For Prototype-I, the position of the cutout for themechanism to be placed is at a distance of 0.2m fromroot with a rectangular cross-section of 16mm. Thewing has a semicircular cutout at 0.2 m from root witha radius of 0.10m whose center point is at a distance ofFig. 4 - Cuboid shaped wind tunnel and the wing in discretizedform.CFD Analysis of An RC Aircraft Wing64
International Journal of Mechanical And Production Engineering, ISSN: 2320-2092,III.RESULT AND DISCUSSIONVolume- 2, Issue-9, Sept.-201410The simulation results for initial model (Prototype-I)and e and the modified wing (Prototype-II) werecompared. The discussions were focused on theaerodynamics characteristics which include dragcoefficient ‘CD’, lift coefficient ‘CL’, and lift-to-dragratio ‘L/D’. In addition, the pressure coefficientcontours, temperature contours and velocity contourswere also analyzed at various angle of attacks ‘α’.14161820Table 1. shows the values of Lift ‘L’, Drag ‘D’,Coefficient of lift ‘CL’, Coefficient of drag ‘CD’ andlift-to-drag ratio ‘L/D’ or ‘CL/CD’ for various angle ofattacks of Prototype I and Prototype-II. We can clearlysee an increased lift forces for Prototype-II withincreasing angle of attack, similarly we also observedecrease in the drag forces with increasing angle 376.816.195.60D. Lift Coefficient CL AnalysisFig. 5 shows the variation in the lift curves ofPrototype-I and Prototype-II, i.e. lift coefficient valueswith varying angle of attacks. Here it is observed thatthe Prototype-II gives a better performance and hashigher load carrying capabilities for the same powerinput, i.e. increased lift force. From Fig. 5, we alsofind the stall angle of the aircraft to be 18 .The maximum increase in lift is 3N at α 14 ,implying that the aircraft can carry an extra load ofaround 300g when compared to Prototype-I. Thevalues of CL and CD were obtained using (1) and (2).2L .v 2 .S2DCD .v 2 .SCL α02461014Prototype I161820Prototype II025(1)(2)Table I. Result Table.L (N) D (N) 03.29076Fig. 5 – Lift coefficient CL versus angle of attack α.E. Drag Coefficient, CD AnalysisFig. 6 shows drag coefficient, CD versus angle ofattack, α. From the graphs, Prototype I & II do notshow any variation in the value of drag coefficients upto 6 angle of attack, after which the drag coefficientvalues of Prototype-II shows gradual decrease withincreasing angle of attack.CL/CD9.509.779.498.987.806.686.185.65Fig. 6 - Drag Coefficient CD at various angle attacks α5.11F. Lift-To-Drag Ratio CL/CD AnalysisThe estimated values of CL/CD were plotted against αand graph is shown in Fig. 7. Prototype-II exhibitedhigher values of L/D ratio for various angle of attacks.The maximum L/D Ratio is at 2 angle of attack forboth the prototypes, but the ideal range of angle of9.7310.289.99CFD Analysis of An RC Aircraft Wing65
International Journal of Mechanical And Production Engineering, ISSN: 2320-2092,Volume- 2, Issue-9, Sept.-2014attack for flight is in between 0 -4 for Prototype-I andit ranges from 0 -5 for prototype-II.Fig. 9(a) - Velocity contours over Prototype-II at α 0 .Fig. 7 - Lift-to-drag ratio, CL/CD at various angle attack, α.G. Velocity ContoursThe velocity contours obtained helped in determiningthe turbulence in the fluid flow. The velocity contoursat 0 & 18 angle of attacks for Prototype I and II areshown figure Fig. 8(a), 8(b) 9(a) and, 9(b).Fig. 9(b) - Velocity contours over Prototype-II at α 18 .These velocity contours show an increase in theturbulence of the flow due to the flow separationcreated with increasing angle of attack. This flowseparation can be observed by comparing Fig. 8(a) and8(b) for Prototype-I and Fig. 9(a) and 9(b) forPrototype-II. As turbulence increases with increasingangle of attack, the wing stalls at a particular point, inthis case it stalls at α 18 .H. Pressure Coefficient ContoursFig. 10 (a &b) below show pressure coefficient contourof top surface for Prototype-I at 20 m/s at 0 and 18 angle of attack. When the angle of attack, α increasesthe lower pressure coefficient is developed on theupper surface. The high intensity blue area located onthe upper surface suggests that high lift is generated.Prototype-II also showed similar changes in pressurecontours from 0 to 18 angle of attack, evident fromFig. 11(a & b).Fig. 8(a) - Velocity contours over Prototype-I at α 0 .Fig. 8(b) - Velocity contours over Prototype-I at α 18 .Fig. 10(a) – Pressure contours at α 0 for Prototype-I.CFD Analysis of An RC Aircraft Wing66
International Journal of Mechanical And Production Engineering, ISSN: 2320-2092,Volume- 2, Issue-9, Sept.-2014Fig. 10(b) – Pressure contours at α 18 for Prototype-I.Fig. 12(a) - Top surface temperature contours at α 0 forPrototype-I.Fig. 11(a) – Pressure contours at α 0 for Prototype-II.Fig. 12(b) - Top surface temperature contours at α 18 forPrototype-I.CONCLUSIONThe analysis played a significant role in improving thewing design of the VTOL/Hybrid Aircraft.Modification was done on the wing after thepreliminary analysis, thus shortening the time-cyclebefore actually coming out with the optimum design.With the comparative analysis of the designed wing ofPrototype I and II, the wing design of Prototype-IIproved to provide a superior performance than that ofthe later. The implemented changes in the wing afterthe analysis of Prototype-I played a major role inincreasing the lift to a maximum of 3 N, and at thesame time decreasing the drag forces. The analysis ofthe wing helped in significantly predicting a betterperformance and reduced power consumption of theaircraft due to reduced drag and increased lift forces.Fig. 11(a) – Pressure contours at α 18 for Prototype-II.Prototype-II shows higher pressure regions whencompared to that of Prototype-I at 0 as well as 18 angle of attack. At high angle of attack α, lift is stillgenerated, but most of the total force is directedbackward as drag.REFERENCESI. Temperature ContoursFig. 12(a) and 12(b) shows the top surface temperaturecontours for Prototype-I at 20 m/s at 0 and 18 angleof attack. Since pressure is directly proportional totemperature, similar variation in temperature is alsoobserved for both the Prototypes.[1]Wirachman Wisnoe, Rizal Effendy Mohd Nasir, WahyuKuntjoro, and Aman Mohd Ihsan Mamat, “Wind TunnelExperiments and CFD Analysis of Blended Wing Body (BWB)Unmanned Aerial Vehicle (UAV) at Mach 0.1 and Mach 0.3”,13th International Conference on Aerospace Sciences &Aviation Technology, ASAT- 13, May 26 – 28, 2009.CFD Analysis of An RC Aircraft Wing67
International Journal of Mechanical And Production Engineering, ISSN: 2320-2092,[2]William Runge, “Characterizing the Aerodynamics of a UAVWing”, Intermediate Fluid Mechanics, Prof. Luo, 12/18/2008.[3]Benjamin Sweeten, “CFD analysis of UAVs using VORSTAB,FLUENT, and Advanced Aircraft Analysis software”,Aerospace Engineering, Graduate Faculty of the University ofKansas, April 27, 2010.[4][5]Tholudin Mat Lazim, Shabudin Mat, Huong Yu Saint,“Computational Fluid Dynamic Simulation (CFD) andExperimental Study on Wing-external Store AerodynamicInterference of a Subsonic Fighter Aircraft”, Acta PolytechnicaVol. 44 No. 2/2004.M. Dinesh, Premkumar P S, J.S.Rao, C. Senthilkumar,“Performance Analysis of Winglets Using CFD Simulation”,Altair Technology Conference, 2013.[7]M. A Azlin, C.F Mat Taib, S. Kasolang and F.H Muhammad,“CFD Analysis of Winglets at Low Subsonic Flow”,Proceedings of the World Congress on Engineering 2011 Vol I,July 6 - 8, 2011.[8]Cheolwan Kim, Jindeog Chung, “Aerodynamic Analysis ofTilt-Rotor Unmanned Aerial Vehicle with Computational FluidDynamics”, Journal of Mechanical Science and Technology(KSME Int. J.), Vol. 20, No.4, pp. 561-568, 2006.L. A. Schiavetta, O. J. Boelens, W. Fritz, “Analysis ofTransonic Flow on a Slender Delta Wing Using CFD”,American Institute of Aeronautics and Astronautics. CFD Analysis of An RC Aircraft Wing68Volume- 2, Issue-9, Sept.-2014[6]
dimensional CATIA CAD model into CFD element using ICEM CFD to create discretized model for CFD analysis. Then, the discretized model was exported to CFX for the analysis. Airflow over the wing was analyzed by defining appropriate boundary conditions. Pressure distribution on the surface of the wing of aircraft was estimated.