Transcription
GBE brokers Ltd is regulated by CySEC under the license number 240/14 · https://gbebrokers.com · Page 0
ContentsRisk Warning . 21.Overview . 32.Using the High-Low Indicator . 42.1Adding the Indicator to a Chart . 42.2Timeframe and Number of Bars . 42.3Daily Time Range . 42.4High and Low Lines, and Widening . 42.5Open and Close Lines . 52.6Labels . 52.7Alerts . 5GBE brokers Ltd is regulated by CySEC under the license number 240/14 · https://gbebrokers.com · Page 1
Risk WarningTrading Forex and CFDs (Contract For Difference) is risky.Before installing the GBE brokers MT4 Booster Pack, we recommend that you read through all the user guides,and also watch the videos that we’ve created for you (see the MT4 Booster Pack Welcome Email for moredetails).If you’ve got any questions, feel free to get in touch with the GBE brokers Customer Care Team. Our supportteam can provide you with info on how to setup the tool, but they can’t provide financial advice, even if you’resuper nice .Thanks,The GBE brokers TeamGBE brokers Ltd is regulated by CySEC under the license number 240/14 · https://gbebrokers.com · Page 2
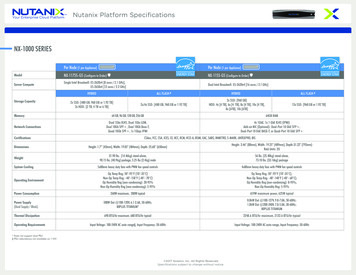
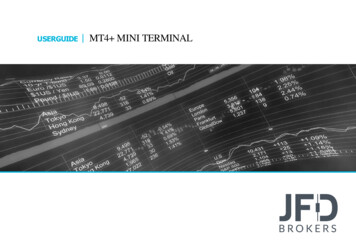
1.OverviewThe High-Low indicator is a very flexible tool for showing highs and lows on a chart, from any timeframe andbased on any number of bars. You can add multiple copies of the indicator to the same chart in order todisplay different levels, e.g. the D1 and H4 highs and lows on an H1 chart:The indicator can also show open and close prices as well as the high and low, and can be set to use a dailytime range rather than looking at an entire day’s trading.You can also configure the indicator to generate alerts when the current price breaches the historic high orlow.GBE brokers Ltd is regulated by CySEC under the license number 240/14 · https://gbebrokers.com · Page 3
2.Using the High-Low Indicator2.1Adding the Indicator to a ChartYou add the High-Low indicator to a chart in the usual MT4 way, either by dragging it from the Navigator ontoa chart, or by double-clicking on it in the Navigator. You can also use standard MT4 features such as addingthe indicator to your list of Favorites, or assigning a Hotkey to it.The indicator can be configured in a number of ways using the settings on its Inputs tab, as described below.2.2Timeframe and Number of BarsYou can choose the timeframe for the high and low, the bar to start at, and the number of bars to include. Forexample, choosing D1, previous bar, and 3 bars means that the indicator will draw the high and low of the last3 days, not including today.2.3Daily Time RangeYou can set a daily time range so that the indicator only looks at part of each day’s trading. This can beparticularly useful in relation to equity markets where there is 24-hour trading, but only a core period of e.g. 8hours during which the market is truly active.You set the time range in the form hh:mm-hh:mm, e.g. 08:00-15:59You can also choose whether the time range is only applied to the high and low, or whether it also affects theopen and close prices which the indicator calculates.2.4High and Low Lines, and WideningYou can set the style and colours for the high and low lines. If you are using multiple copies of the indicator onthe same chart in order to display different levels, it is obviously best if you set different colours for eachindicator. You can turn off the high or low by settings its colour to “none”.You can also choose to widen the high and low lines, e.g. adding (or subtracting) 5 pips from the price. Thiswidening also affects any alerts which you set up. The widening can be defined in terms of pips (e.g. 20), or aprice amount (e.g. 0.0020), or a percentage of the range between the high and low.GBE brokers Ltd is regulated by CySEC under the license number 240/14 · https://gbebrokers.com · Page 4
A negative value for the widening narrows the lines. For example, if the low is at 1.2345, then a value of 10pips will move the line to 1.2335 (widened away from the high) and a value of -10 will move the line to 1.2355(narrowed towards the high).2.5Open and Close LinesYou can choose to display lines for the open, close, and previous close. Please note: the close line is onlyuseful if you configure the indicator to start at the previous bar rather than the current bar, or if you apply adaily time range. Otherwise, the close line will simply be the current price.You can turn each of these three lines on and off individually by choosing a colour for it or setting the colourto “none”.2.6LabelsYou can choose whether the indicator displays a label for each line, e.g. “D1 High”, and you can control the textof the label. You can add the variable {PRICE} into the text to make the indicator display the price valueassociated with the line.2.7AlertsYou can choose to get whenever the price goes beyond the high or low lines (including any widening whichyou have defined). Alerts can be issued as pop-up messages and/or as sounds.You can set a minimum period between alerts to avoid repeated notifications, and you can also configure theindicator to ignore the first N seconds of the current bar.GBE brokers Ltd is regulated by CySEC under the license number 240/14 · https://gbebrokers.com · Page 5
2.2 Timeframe and Number of Bars You can choose the timeframe for the high and low, the bar to start at, and the number of bars to include. For example, choosing D1, previous bar, and 3 bars means that the indicator will draw the high and low of the last 3 days, not including today. 2.3 Daily Time Range