Transcription
ISPRS Annals of the Photogrammetry, Remote Sensing and Spatial Information Sciences, Volume IV-2, 2018ISPRS TC II Mid-term Symposium “Towards Photogrammetry 2020”, 4–7 June 2018, Riva del Garda, ItalyBUILDING CONSTRUCTION PROGRESS MONITORING USINGUNMANNED AERIAL SYSTEM (UAS), LOW-COST PHOTOGRAMMETRY, ANDGEOGRAPHIC INFORMATION SYSTEM (GIS)Jezekiel R. Bognota, Christian G. Candidoa, Ariel C. Blancoa,b, and Jore Rene Y. Montelibanocof Geodetic Engineering, University of the Philippines Diliman, Quezon City 1101 - (jrbognot, cgcandido, andacblanco)@up.edu.phbTraining Center for Applied Geodesy and Photogrammetry, University of the Philippines Diliman, Quezon City 1101cRadar Aero Resources, Quezon City 1109aDepartmentCommission II, WG II/10KEY WORDS: Photogrammetry, Building Construction, Progress Monitoring, UASABSTRACTMonitoring the progress of building’s construction is critical in construction management. However, measuring the buildingconstruction’s progress are still manual, time consuming, error prone, and impose tedious process of analysis leading to delays,additional costings and effort. The main goal of this research is to develop a methodology for building construction progress monitoringbased on 3D as-built model of the building from unmanned aerial system (UAS) images, 4D as-planned model (with constructionschedule integrated) and, GIS analysis. Monitoring was done by capturing videos of the building with a camera-equipped UAS. Stillimages were extracted, filtered, bundle-adjusted, and 3D as-built model was generated using open source photogrammetric software.The as-planned model was generated from digitized CAD drawings using GIS. The 3D as-built model was aligned with the 4D asplanned model of building formed from extrusion of building elements, and integration of the construction’s planned schedule. Theconstruction progress is visualized via color-coding the building elements in the 3D model. The developed methodology was conductedand applied from the data obtained from an actual construction site. Accuracy in detecting ‘built’ or ‘not built’ building elements rangesfrom 82-84% and precision of 50-72%. Quantified progress in terms of the number of building elements are 21.31% (November 2016),26.84% (January 2017) and 44.19% (March 2017). The results can be used as an input for progress monitoring performance ofconstruction projects and improving related decision-making process.1. INTRODUCTIONConstruction project monitoring has been an important andessential factor for the success of large-scale constructionprojects. Despite the importance of construction projectmonitoring, the traditional manual monitoring is still theprevalent and dominant practice (Braun et al., 2014). The currentmonitoring process is time consuming, labour intensive, anderror-prone. The output of traditional manual monitoring areprogress reports, the quality of which is heavily dependent on theexperience of field personnel conducting the monitoring. Due tothis, progress reports tend to be bias towards the field personnel’sinterpretation of construction progress (Golparvar-fard et al.,2015).Because of the limitations of the terrestrial camera, fixed orbitsatellites, and manned aerial photography, rapid and accurate 3Dmodelling of building has been a challenging task. However,recent developments in technology specifically the UnmannedAerial System (UAS) has improved the efficiency and accuracyof 3D building modelling (Feifei et al., 2012). While UAVs are apopular tool for 3D building modelling, their application inimage-based progress monitoring has not been fully investigated(Golparver-fard et al., 2014). Combined with the developmentsin image processing and geographical information system (GIS),the use of UAVs for construction progress monitoring could beachieved. Nonetheless, construction progress monitoring is still achallenging task. Problems such as occlusion of buildingelements, scaffoldings, and temporary structures are stillaffecting the quality of as-built 3D models produced. In addition,many of the photogrammetric software are still unavailable forpublic use such as AgiSoft Photoscan and Pix4D.In the last decades, developments in image processingtechniques, image acquisition techniques, and GIS haveincreased. The wider availability of reality capturingtechnologies led to applications in construction progressmonitoring.With the advancement in photogrammetry and computer vision,new construction management techniques have been applied inconstruction operations and processes. Current research inconstruction progress monitoring focuses on utilization of imagebased modelling techniques combined with Building InformationModels for the creation of as-built 3D models. Golparvar-fard etal. (2014) were able to develop an automated progress monitoringusing unordered daily construction photographs and IFC-basedBuilding Information Models. The paper presented a new andautomated approach for recognition of construction progress thatutilizes structure-from-motion techniques, multiview stereo, andvoxel coloring and labelling algorithm for the reconstruction of adense as-built point cloud. Subsequently, an IFC-based BIM andthe as-built scene is fused using a coregistration. A machinelearning algorithm built upon by Bayesian probabilistic model isthen used to detect physical progress. Finally, the system wasable to visualize the reconstructed elements using an augmentedreality approach.Braun et al. (2014) used the same concept but different approachin construction progress monitoring. As-built point cloud modelwas generated from the combination of structure-from-motionapproach and measurement of control points in the constructionsite. For the dense point cloud generation, an approach that isbased on Rothermel et al. (2012) was used. Then for the as-builtand as-planned comparison, the planes are split and rasterize intocell size r. Two states were defined to determine progress inThis contribution has been peer-reviewed. The double-blind peer-review was conducted on the basis of the full -2018 Authors 2018. CC BY 4.0 License.41
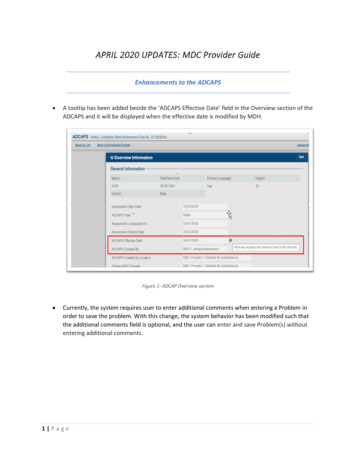
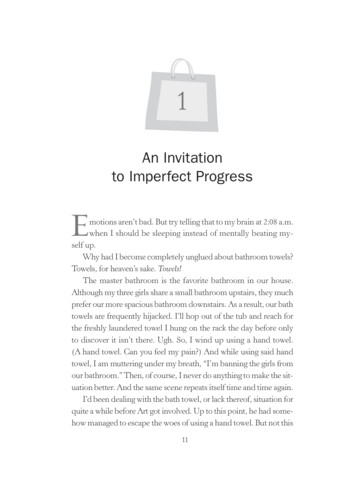
ISPRS Annals of the Photogrammetry, Remote Sensing and Spatial Information Sciences, Volume IV-2, 2018ISPRS TC II Mid-term Symposium “Towards Photogrammetry 2020”, 4–7 June 2018, Riva del Garda, Italyconstruction. The first state is based on the visibility constraintswhich is used to determine the status of the building. It uses a raycasting and probabilistic occupancy grid mapping to determinethe status of each raster cell. Three states could be inferred usingthis method: 1) free, 2) occupied, and 3) unknown. “Free” refersto raster cell that is not occupied by any as-built point clouds. Onthe other hand, “Occupied” means that raster cell is occupied bythe as-built point clouds. Lastly, “unknown” refers to raster cellsthat are occluded. All building parts that are labelled as“occupied” are further analyzed to determine if it does reallyexist. The analysis is based on point-to-model distance whichused three criteria to determine the status. The result of the studyis promising, enabling the identification of the status of buildingparts.This paper describes a new method of monitoring constructionprogress based on unmanned aerial system (UAS), low-costphotogrammetry, and GIS. First, videos of the building arecaptured using a UAS. An as-built 3D model is then generatedfrom these images using free and open-source photogrammetrysoftware. Subsequently, as-planned 3D model is generated usingCAD plans and GIS. This is then integrated with the as-built 3Dmodel. At this stage, the construction progress monitoring iscarried out in a GIS environment. Different tools andfunctionalities in a GIS environment were used to performconstruction progress monitoring. Finally, a labelling process isconducted on the as-planned 3D model to visualize the result ofthe construction progress monitoring. The methodology is thenvalidated by tracking the status of each building element usingthe video acquired from the UAS.2.2 CAD RefinementIn this study, only four (4) types of building elements wereconsidered for the digitization: 1) beam; 2) column; 3) slab; and4) wall. Other elements that were deemed unnecessary such asaluminium panel, fixtures, pipelines, and such were removedfrom the CAD plans. The resulting CAD plan models onlyconsist of the specified building elements.2.3 Digitization of CAD ModelsCAD plan models were imported to ArcScene Environment forextruding the building elements into three-dimensions. Extrusionof the building elements was done using an attribute describingthe base-height and layer-height of each building element. Thecombination of the base-height and layer-height value gives the2D CAD plan models its three-dimensional feature. Afterextrusion, the 3D as-planned model was converted into amultipatch feature which allows the storage of a vector data into3D format.2.4 Georeferencing As-planned 3D ModelTo georeferenced the as-planned 3D model created, the spatialadjustment tool in ArcGIS toolbox was used. The ground controlpoints established from the GNSS field survey were used todefine the coordinate system of the as-planned 3D model. Afterdefining the GCPs for the as-planned 3D model, the affinetransformation was used to shift and transform the as-planned 3Dmodel.3. GENERATION OF AS-BUILT 3D MODEL2. GENERATION OF AS-PLANNED 3D MODELThe generation of As-planned 3D models (Figure 1) consists offive steps namely: 1) Data acquisition; 2) CAD refinement; 3)digitization of CAD floor models; 4) 3D model generation; and5) georeferencing as-planned 3D model.Photogrammetric processing was employed for the generation ofthe As-built 3D models at various stages of building construction.The entire workflow consists of four phases as shown in Figure2: 1) Reconnaissance and flight planning; 2) data acquisition andpre-processing; 3) photogrammetric data processing includingimage matching and generation of point clouds and meshes; and4) Georeferencing the as-built 3D models.Figure 2. As-built 3D model generation schema3.1 Reconnaissance and Flight PlanningFigure 1. As-planned 3D model generation schema2.1 Data AcquisitionArchitectural and structural plans of building was acquired fromthe JITS Corporation, Inc. These architectural and structuralplans contain the blueprint of the whole building which will belater digitized into different components.Reconnaissance was first conducted around the building to bemodelled to determine the suitable flight path for the unmannedaerial vehicle (UAV), a DJI Phantom. The area was scanned forpossible obstructions such as trees and infrastructures includingutilities. The geometry of the building was considered for theextent and flight pattern of the UAV. Initially, video scanning foreach face of the building was carried out with the UAV flying leftto right and left to right at different flying height. However, thisThis contribution has been peer-reviewed. The double-blind peer-review was conducted on the basis of the full -2018 Authors 2018. CC BY 4.0 License.42
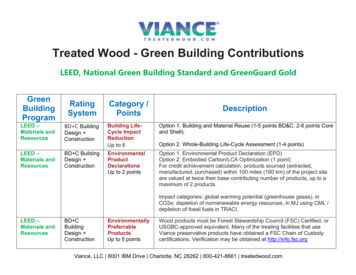
ISPRS Annals of the Photogrammetry, Remote Sensing and Spatial Information Sciences, Volume IV-2, 2018ISPRS TC II Mid-term Symposium “Towards Photogrammetry 2020”, 4–7 June 2018, Riva del Garda, Italywas reckoned to be time-consuming especially for monitoringpurpose. It was decided to utilize an intelligent flight mode calledPOI (Point of Interest) to set the flight pattern of the UAV. Aradius of 50 meters from the estimated center of the building andaltitudes of 45 and 30 meters were used during the dataacquisition (Figure 3).3.4 Data ProcessingSeveral free and open-source software were utilized for thegeneration of the as-built models. The output of image filteringand selection was used for the as-built 3D model generation ofthe building. The filtered images were imported to VisualSFMfor sparse point cloud reconstruction. VisualSFM uses the scaleinvariant transform algorithm (SIFT) to detect matching featuresfrom two images automatically (Figure 5). These matchingfeatures are stored as database of keypoints. The number ofkeypoints that could be identified in the image is heavilydependent on the image texture and resolution.Figure 3. Point of Interest flight mode for data acquisition3.2 Data AcquisitionUAV flights were conducted on 13 November 2016, 11December 2016, 14 January 2017, 5 February 2017 and 5 March2017. A video recording scheme was used to capture the building.This was done to ensure sufficient overlaps between the imagesthat will be extracted from the video. The video has a resolutionof 2704 x 1520 pixels and a frame rate of 30 frames/second.3.3 Data Pre-processingAfter the video acquisition, images (JPG format) were thenextracted using Blender. In this study, all frames were extractedfrom the videos; therefore, 30 images were extracted eachsecond. This was done to maximize the use of raw data andchoose the best possible images from the video. Extracted imageswere subjected to filtering and selection such that distortedimages and blurred images were excluded (see Figure 4). Blurredimages typically contain less edges or boundaries due to subduedgradients. The Canny Edge Detection algorithm, which utilizescontrasting color between pixels to determine boundaries, wasapplied on the extracted images. The Canny Edge Detectionalgorithm typically involves five steps namely: 1) smoothing, 2)finding gradients, 3) non-maximum suppression, 4) thresholding,and lastly, 5) edge tracking. Usually, blurred images haveminimal gradients since there is no much change in the intensityof the image. The white pixels in the canny edge processed imageindicates edges; therefore, blurred images could be detected if theratio of the white pixel with the total number of pixels in theimage is low. Images with a high ratio were then selected forprocessing. For every 30 frames, one image that has the highestratio of white pixels to black pixels was chosen.Figure 5. Image to image matching using SIFT algorithmFollowing the keypoint identification, bundle adjustment wasused to estimate camera poses and extract sparse point cloud.After generating the sparse point cloud of the as-built 3D model,a densified point cloud was derived by using the multi-viewreconstruction software CMPMVS. CMPMVS is a multi-viewstereo algorithm for reconstruction that takes a set of image andcamera parameters. The output of the SfM software is taken asinput and the images from the SfM output are then decomposedinto sets of image clusters. The clustered images are processedindependently and in parallel. All the processed clusters are thencombined for reconstruction. The outputs are meshes andtextured meshes saved in .ply and .wrl file.3.5 Georeferencing As-built 3D modelThe output textured mesh was then georeferenced usingMeshLab. The ground control points established from the fieldsurvey were used as the reference points. Residual errors for eachGCPs were determined. To produce the dense point cloud of theas-built 3D model, the textured mesh was first cleaned andrefined to remove the unnecessary portions. Using MeshLab, thecleaned and refined textured mesh was saved as XYZ file. TheXYZ file was then loaded and exported as LAS file in theCloudCompare software.4. CONTRUCTION PROGRESS MONITORING USINGGISThe methodology for construction progress monitoring usingGIS consist of: 1) Point cloud extraction; 2) parametersestablishment; 3) threshold calculation; 4) visualization; and 5)validation.4.1 Point Cloud ExtractionFigure 4. Sample blurred image (upper), sun’s glare (lower)The georeferenced as-built and as-planned 3D models were firstaligned and integrated using ArcGIS. Integration of as-built andas-planned 3D models allows for the extraction of point cloudsfrom the as-built 3D model. Using the Locate LAS Points byThis contribution has been peer-reviewed. The double-blind peer-review was conducted on the basis of the full -2018 Authors 2018. CC BY 4.0 License.43
ISPRS Annals of the Photogrammetry, Remote Sensing and Spatial Information Sciences, Volume IV-2, 2018ISPRS TC II Mid-term Symposium “Towards Photogrammetry 2020”, 4–7 June 2018, Riva del Garda, ItalyProximity tool in ArcGIS v. 10.4, point clouds were extractedbased on its corresponding building element in the as-planned 3Dmodel. A model builder was created to automate the process ofpoint cloud extraction.construction monitoring wherein red indicates ‘not built’elements while green indicates ‘built’ elements.4.2 Establishment of ParametersValidation of the status of each building element was done usingthe video acquired using the UAV. Each building element in theas-planned 3D model was inspected in the video to determine itsstatus. The contingency table is used to report the number of truepositives, false positives, false negatives, and true negatives(Table 1). Different performance metrics were then calculatedusing the contingency table (Table 2).4.2.1 Point Cloud Density Computation: The number of pointsthat falls within the proximity of a building element weredetermined and divided by the total surface area of the buildingelement to get the point cloud density.Point Cloud Density No.of points(1)total surface area4.2.2 Difference in Centroid Computation: The difference inthe computed centroid of the building element with thecorresponding point clouds was calculated. Using the calculategeometry function, the centroid of each building element and itscorresponding point clouds was determined. The centroids werethen subtracted to get the difference in centroid locations.Predictionn totalActualAfter extracting the point clouds in the as-built 3D model, thefollowing parameters were established for the determination ofbuilding element status: 1) Point cloud density computation; and2) difference in centroid computation.4.5 ValidationBuiltNot builtBuiltTPFNNotbuiltFPTNTable 1. Contingency table for the proposed methodology4.3 Threshold CalculationThe computed values of the point cloud density and difference incentroid were subjected to statistical analysis for thresholdcalculation. A simple graphical technique was first employed forremoving outliers in the dataset. After removing the outliers inthe dataset, a histogram was constructed for each type of buildingelement and its underlying distribution was inspected (Figure 6).Simple quantitative statistics such as mean and standarddeviation were employed for threshold calculation. Thedetermined thresholds were then applied to separate the ‘built’elements from ‘not built’ elements.Point Cloud Density Histogram (Wall)Table 2. Different performance metrics used for the evaluationof methodology0.030.0255. RESULTS AND DISCUSSION0.025.1 Generated As-built 3D Model0.0150.010.00500100200300400500Figure 6. Sample histogram of point cloud density for a wallThe building elements that satisfy the threshold were labelled asone (1) and considered as ‘built’ while building elements that didnot satisfy the threshold were labelled as zero (0) and consideredas not built. Linear regression was done to check if thresholdyields better R-squared.4.4 VisualizationVisualization of the construction progress monitoring was doneusing ArcScene. A color-coding scheme was used to visualize theIn this study, five (5) as-built 3D models were generated. Inregular time intervals for the duration of five (5) months, the UPCollege of Architecture (UPCA) building was captured by meansof UAV. The first dataset (Nov. 13, 2016) was about 783 imagesprocessed in one day and thirteen hours. The second dataset (Dec.11, 2016) was about 748 images processed in one day and fifteenhours. The third dataset (Jan. 14, 2017) was about 651 imageswith a total processing time of two days and seven hours. Thefourth dataset (Feb. 05, 2017) was about 391 images with a totalprocessing time of one day and seven hours. Lastly, the fifthdataset (Mar. 05, 2017) was about 748 images with a totalprocessing time of one day and fourteen hours. Figure 7 shows asample generated textured mesh. The textured meshes were thencleaned and refined to remove unnecessary data. The cleaned andrefined textured meshes were converted to point clouds whichwere saved into LAS format (Figure 8).This contribution has been peer-reviewed. The double-blind peer-review was conducted on the basis of the full -2018 Authors 2018. CC BY 4.0 License.44
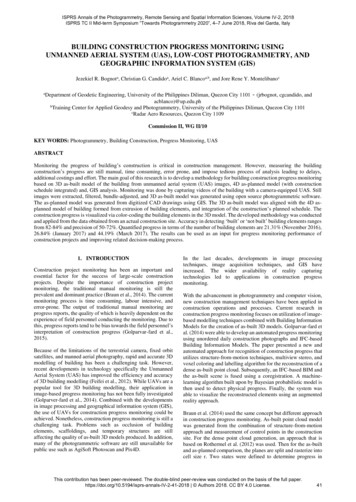
ISPRS Annals of the Photogrammetry, Remote Sensing and Spatial Information Sciences, Volume IV-2, 2018ISPRS TC II Mid-term Symposium “Towards Photogrammetry 2020”, 4–7 June 2018, Riva del Garda, Italygraphical techniques, descriptive statistics, and linear regression,the optimum thresholds for each type of building element wereidentified. Table 3 shows the summary of the thresholdcalculation for each type of building element.Flight ObservationsBuilding Elem. TypePointCloudDensityThresholdDiff. in Centroid ThresholdAdjusted 47Slab29.272.8120.791Wall37.000.4160.559Nov. 13, 2016Figure 7. Generated raw mesh for March 5,2017 flightobservationJan. 14, 2017Mar. 05, 2017Table 3. Summary of threshold value for each type of buildingelementFigure 8. Processed LAS files for flight observations Mar. 05,20175.2 Generation of As-Planned 3D ModelThe as-planned 3D model of the UPCA (Figure 9) was generatedthrough (1) digitization of 2D CAD models and (2) alignmentand integration of the as-planned and as-built 3D models.From the table, it can be observed that there is an increasing trendin the calculated R2. The calculated R2 for Mar. 05, 2017 arerelatively higher compared to the R2 calculated from other flightobservations. This indicates that the methodology succeeded indetecting building elements for Mar. 05, 2017 flight observationthan the other flight observations. Analysing and observing theas-built 3D model derived for Mar. 05, 2017, there are lessocclusions due to temporary objects such as scaffoldings,formworks, site fences, and other unnecessary materials thatblock or cover building 5November 13,2016January 14,2017BuiltMarch 5, 2017Not BuiltFigure 10. Detected number of building elements using themethodologyFigure 9. Isometric View of the As-Planned Model of UPCA(walls - yellow, columns - red, beams - green, slab/floor – gray).For the alignment of the as-planned and as-built 3D models, bothwere georeferenced using GCPs established from the horizontalcontrol survey. A total of seven (7) GCPs were established togeoreference both the as-planned and as-built 3D models. Eachof the as-built 3D models were georeferenced separately.5.3 Construction Monitoring Using GISAfter the alignment of as-planned and as-built 3D models, pointclouds were extracted from the as-built 3D models. The extractedpoint clouds were compared to its corresponding buildingelements in the as-planned 3D model to obtain the informationfor the parameter establishment. Thresholds were then calculatedto separate ‘built’ and ‘not built’ building elements. Using simpleThe total number of building elements presented in Figure 10accounts for the total number of exterior and interior buildingelements. In most cases, interior building elements were labelledas ‘not built’ which can mainly be ascribed to three reasons: (1)the acquisition geometry does not allow interior buildingelements to be seen or captured by the video, (2) occlusions dueto other objects which have already been built, (3) and missingillumination for the interior elements in the building (Tuttas,Braun, Borrman, & Stilla, 2015).For the exterior building elements that were occluded by otherbuilding elements, it was observed that they were also partiallyreconstructed by the algorithm resulting to non-detection of thebuilding element. This added to the low accuracy and precisionof the results.This contribution has been peer-reviewed. The double-blind peer-review was conducted on the basis of the full -2018 Authors 2018. CC BY 4.0 License.45
ISPRS Annals of the Photogrammetry, Remote Sensing and Spatial Information Sciences, Volume IV-2, 2018ISPRS TC II Mid-term Symposium “Towards Photogrammetry 2020”, 4–7 June 2018, Riva del Garda, ItalyUsing the number of building elements detected using themethodology, in terms of exterior elements, the quantifiedprogress of the building for November 13, 2016 is 21.31%. ForJanuary 14, 2017, the quantified progress of the building is26.84% and lastly, for March 05, 2017, the quantified progressof the building is 44.19%.5.4 Validation ResultsThe accuracy and reliability of the methodology is analysed usinga binary contingency table and different performance metrics.The predicted status of each building elements was tabulated andcompared to its actual status in a dichotomous contingency table.For Nov. 13, 2016, 2,478 building elements were classified. Thefollowing legends are used for the succeeding tables: TP - Hitrate, FP - False Alarm Rate, and FN - Miss Rate.Table 6. Accuracy assessment for Mar. 05, 2017The result showed that the building elements could be detectedusing the available GIS tools. An accuracy of 82 – 84% and aprecision of 50 – 72% were achieved by the methodology.5.5 Visualization of Construction Progress MonitoringFor the predicted status, each of the building elements thatsatisfied the thresholds were classified as ‘built’ while buildingelements that did not satisfy the threshold were classified as ‘notbuilt’. Figure 10 shows sample visualization of predicted statusof the building on March 5,2017.Table 4. Accuracy assessment for the case of Nov. 13, 2016The methodology registered an accuracy of 84.42% and precisionof 49.81%. Although the methodology had a fair accuracy, theregistered precision is lower than 50% which could be attributedto the presence of temporary objects such as scaffoldings andformworks in front of building elements. Other possible causesof low precision for Nov. 13, 2016 result are (1) nonrepresentation of a building element which resulted to poorreconstruction, and (2) occlusions which resulted to partialreconstruction. The TP rate was calculated to be 68.49%, the FPrate to be 12.66% and FN Rate to be 31.51%. For Jan. 14, 2017,the methodology was found to have 82.32% accuracy whilehaving precision of 60.50%. The TP rate was found to be 73.85%,the FP rate was 15.03 % and the FN rate was 26.15%.Table 5. Accuracy assessment for Jan. 14, 2017For March 5, 2017, the methodology registered an accuracy of84.10% while having the precision of 72.55%. It is noticeablethat there is an improvement in the precision of the methodologyas the observation goes by. This can be attributed to betterreconstruction of the model since it could be observed that a lotof temporary objects such as scaffoldings and formworks werealready removed from the building. The calculated TP rate of themethodology was 79.27%, while the FP rate and FN rate werefound to be 13.70% and 20.72% respectively.BBuilt uNot Builtil Predicted Status Isometric ViewFigure 10. March 5, 2017t6. CONCLUSION AND RECOMMENDATIONSThis paper presented a methodology for construction progressmonitoring that is based on Unmanned Aerial System (UAS),low-cost photogrammetry, and Geographic Information System(GIS). Images extracted from the UAS videos generated an asbuilt dense point cloud models which were later used forconstruction progress monitoring. Subsequently, the as-planned3D model of the UPCA building was produced by digitization ofthe CAD plans, specifically the structural and architectural plansin ArcGIS. After which, alignment of as-planned and as-builtmodels was done using the same platform.For the determination of the construction progress, GIS tools andfunctionalities were utilized. Point clouds were first extractedfrom the as-built 3D models and compared to the correspondingbuilding elements in the as-planned 3D model using theparameters established. Thresholds were calculated from theparameters to separate the built building elements from the notbuilt or unverified building elements. Using the video forvalidation, the methodology for construction progress monitoringyielded satisfactory results. The methodology did well indetecting building elements having an accuracy of 82 - 84 % anda precision of 50 - 72%. Based on the results, the quantifiedprogress in terms of the number of building elements are 21.31%for November 2016, 26.84% for January 2017, and 44.19% forMarch 2017.This contribution has been peer-reviewed. The double-blind peer-review was conducted on the basis of the full -2018 Authors 2018. CC BY 4.0 License.46
ISPRS Annals of the Photogrammetry, Remote Sensing and Spatial Information Sciences, Volume IV-2, 2018ISPRS TC II Mid-term Symposium “Towards Photogrammetry 2020”, 4–7 June 2018, Riva del Garda, ItalyFinally, visualization of the result of the methodology was donein 3D using ArcGIS. Animations were created from the result ofmethodology to better visualize the construction phases.Future research on techniques regarding 3D reconstruction ofimages is recommended since the quality of as-built 3D modelrelies heavily on the process of reconstruction. More experimentsthe acquisition of images should be conducted. Also, themethodology for construction progress monitoring needs to befurther enhanced by automating the entire process of monitoring.This will lessen if not eliminate the dependence on the userleading to improved efficiency and accuracy. Furthermore, it isalso recommended to apply the methodology in the begi
photogrammetry, and GIS. First, videos of the building are captured using a UAS. An as-built 3D model is then generated from these images using free and open-source photogrammetry software. Subsequently, as-planned 3D model is generated using CAD plans and GIS