Transcription
Highlights From the 2012 National SampleSurvey of Nurse PractitionersHealth Resources and Services AdministrationBureau of Health ProfessionsNational Center for Health Workforce Analysis
The Health Resources and Services Administration (HRSA), U.S. Department of Health andHuman Services (HHS), provides national leadership in the development, distribution, andretention of a diverse, culturally competent health workforce that can adapt to the population’schanging health care needs and provide the highest-quality care for all. The agency administersa wide range of training grants, scholarships, loans, and loan repayment programs that strengthenthe health care workforce and respond to the evolving needs of the health care system.The National Center for Health Workforce Analysis (the National Center) informs public andprivate sector decision-making related to the health workforce by expanding and improvinghealth workforce data, disseminating workforce data to the public, improving and updatingprojections of the supply and demand for health workers, and conducting analyses of issuesimportant to the health workforce.For more information about the National Center, e-mail us at healthworkforcecenter@hrsa.govor visit our website at ggested citation:U.S. Department of Health and Human Services, Health Resources and Services Administration,National Center for Health Workforce Analysis. Highlights From the 2012 National SampleSurvey of Nurse Practitioners. Rockville, Maryland: U.S. Department of Health and HumanServices, 2014.Copyright information:All material appearing in this report is in the public domain and may be reproduced or copiedwithout permission. Citation of the source, however, is appreciated.Highlights From the 2012 National Sample Survey of Nurse Practitioners2
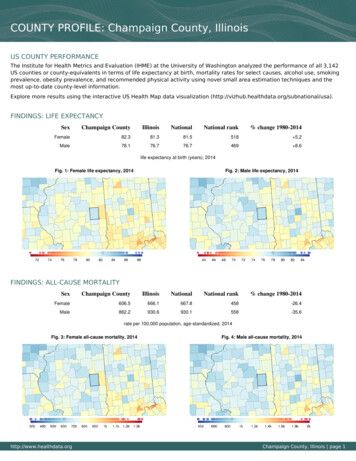
Highlights From the2012 National Sample Survey of Nurse PractitionersNurse Practitioners (NPs) play a critical role in extending access to health care by providing arange of primary and specialty care services. The Health Resources and Services Administration(HRSA) conducted the 2012 National Sample Survey of Nurse Practitioners (NSSNP) to provideaccurate national estimates of the NP workforce and to profile their education, certification, andpractice patterns. Surveys were completed by nearly 13,000 randomly selected licensed NPs, a60.1-percent response rate. This brief provides a summary of the key findings. See “About theData” at the end of this brief for more information on the study design.NP SupplyThere were an estimated 154,000 licensed NPs in the United States in 2012 (see Exhibit 1). Ofthese, more than 132,000 worked in a position requiring an NP credential (“the NP workforce”).Exhibit 1. The Estimated Nurse Practitioner (NP) Supply, 00080,00060,40760,00040,00020,0000Licensed NPNP workforceNP providing patientcareNP working in primarycareData Source: 2012 National Sample Survey of Nurse Practitioners.Within the NP workforce, about 127,000 NPs were providing patient care, and nearly half of NPsin patient care (60,407) were working in primary care practices or facilities. ApproximatelyHighlights From the 2012 National Sample Survey of Nurse Practitioners3
22,000 licensed NPs were not working in an NP position at the time of the survey; of these,approximately 11,000 were working as RNs.Education and CertificationEducation: About 94 percent of the total NP workforce held a graduate degree in some field.The majority (86 percent) held a master’s degree in nursing as their highest degree, 5 percentheld a doctoral degree in nursing, and 3 percent had a graduate degree in a non-nursing field.Of the 6 percent without a graduate degree, most (69 percent) were individuals who were trainedbefore 1992. States have increasingly moved to requiring a graduate degree for entry to theprofession, with NPs holding less than a master’s degree “grandfathered in.”Certification: Nearly all of the NP workforce (96 percent) reported having received formalcertification from a national certifying organization at some point in their careers. The majority(76 percent) received certification in what is generally considered a primary care specialty(family, adult, pediatric, or gerontology). The most widely held certification is family NP,reported by almost half of the NP workforce.DemographicsDiversity: In 2012, the NP workforce was largely homogeneous in gender and race/ethnicity.About 86 percent were white and non-Hispanic, 3 percent were Hispanic/Latino (any race),5 percent were Black (non-Hispanic), and 6 percent were of other non-Hispanic groups.Approximately 7 percent were male.Age Distribution: The average age within the NP workforce was 48 years. The largest-agecohort of NPs, 55 to 59 year olds, represented nearly 18 percent of the NP workforce, and those60 years of age and older represented 16 percent. At the same time, there was a healthyrepresentation of younger-age categories: 14 percent of NPs were under 35, 12 percent werebetween 35 and 39 years of age, 13 percent were in each of the 40 to 44 and 45 to 49 age groups,and another 15 percent were between 50 and 54 years of age.Practice PatternsPractice Position: The vast majority (75 percent) of the NP workforce reported working in asingle position. Only 19 percent held additional positions that also require NP licenses. TheHighlights From the 2012 National Sample Survey of Nurse Practitioners4
remaining (6 percent) held additional positions that did not require NP credentials. Almost all ofthe NP workforce were also in clinical practice (96 percent) providing direct patient care.However, a small number of NPs were in non-clinical roles requiring an NP credential, such asfaculty (nearly 3 percent) or administration (about 1 percent).Services Provided: The 127,210 NPs working in patient care in 2012 reported providing avariety of services to their patients, from patient education to medical procedures (see Exhibit 2).Exhibit 2. Services Provided by Nurse Practitioners (NP) Providing Direct Patient Care*Services provided to:Counsel and educate patients andfamiliesConduct physical examinations andobtain medical historiesPrescribe drugs for acute andchronic illnessesOrder, perform, and interpret labtests, x-rays, EKGs, and otherdiagnostic studiesDiagnose, treat, and manage acuteillnessesDiagnose, treat, and manage chronicillnessProvide preventive care includingscreening and immunizationsProvide care coordinationMake referralsPerform 00.0100.0100.0Data Source: 2012 National Sample Survey of Nurse Practitioners.*Survey question: “Thinking about your main NP position, for how many of your patients do you provide thefollowing services?”Note: Not all totals equal 100, because of rounding.EKG: Electrocardiogram.More than three-quarters of NPs reported providing the following services for most patients:counseling and educating them; conducting physical examinations and obtaining medicalHighlights From the 2012 National Sample Survey of Nurse Practitioners5
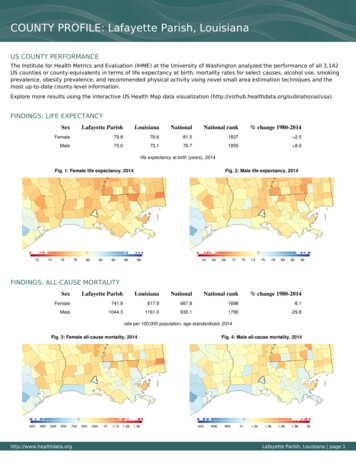
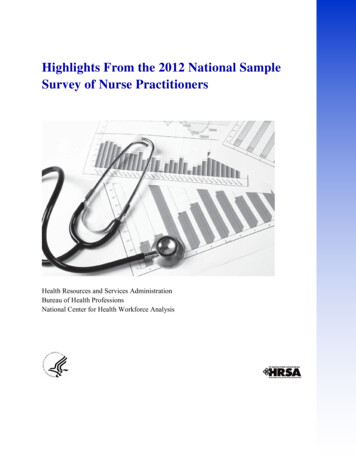
histories; prescribing drugs; and ordering, performing, and interpreting diagnostic studies. FewerNPs reported performing procedures, and making referrals.Specialty of Practice: In this study, specialty of practice is defined for those in patient care asthe reported specialty of the practice or facility in which NPs work in their main NP position.Although three-quarters of the NP workforce reported having been certified in a primary carespecialty, less than half of those in patient care (48 percent) worked in a primary care office orfacility (see Exhibit 3). More than 16 percent were in internal medicine or pediatricsubspecialties, almost 9 percent were in surgical specialties, and 6 percent were inpsychiatry/mental health. Neonatal (3 percent), emergency care (3 percent), and palliativecare/pain management (2 percent) were the most frequently reported specialties in the “other”category.Exhibit 3. Specialty of Practice/Facility for Nurse Practitioners Providing Patient CarePrimary Care60,407 (48.1%)Internal Medicine Subspecialties16,675 (13.3%)Surgical Specialties11,047 (8.8%)Pediatric Subspecialties3,880 (3.1%)Psychiatry/Mental Health7,034 (5.6%)Other25,079 (20.0%)No specialty1,586 umber of Nurse PractitionersData Source: 2012 National Sample Survey of Nurse Practitioners.Until recently, the probability of working in primary care decreased with each successivegraduating year (see Exhibit 4). While 59 percent of NPs who graduated in 1992 or earlier workin primary care, only 42 percent of those who graduated in 2003 to 2007 do so. However, thevery newest NPs (those graduating more recently than 2008) diverged from the overall trend,showing an uptick in the proportion in primary care (47 percent).Highlights From the 2012 National Sample Survey of Nurse Practitioners6
Exhibit 4. 2012 Specialty Distribution of Nurse Practitioners, by Graduating Psychiatry/MentalHealthSurgeryIM & PediatricSubspecialties40%30%Primary Care20%10%0%59.153.61992 or earlier 1993-199747.042.546.61998-20022003-20072008 or laterGraduation YearData Source: 2012 National Sample Survey of Nurse Practitioners.Setting of Practice: NPs in the workforce reported practicing in a large variety of settings(see Exhibit 5). Over half worked in ambulatory care settings in their principal NP positions,including private physician or NP practices and private or federal ambulatory clinics. Nearlyone-third of the NP workforce practiced in hospitals, and the largest share of this group workedin inpatient units.Exhibit 5. Setting for Principal Nurse Practitioner (NP) Position*NumberAmbulatory SettingsPrivate physician office/practicePrivate NP office/practiceFederal clinic†Community clinicRetail-based clinicSchool/college health serviceUrgent care clinicHighlights From the 2012 National Sample Survey of Nurse 2,125Percent56.731.64.16.72.92.22.21.87
NumberHealth maintenance organization/managed careMental health centerRural health clinic‡Nurse managed clinic‡Ambulatory surgery centerOther (unclassified) clinicHospital SettingsHospital inpatient unitHospital outpatient clinicHospital emergency departmentHospital surgical settingsHospital other clinical rolesHospital—otherFederal hospitalLong-Term and Elder CareLong-term care facilityHospiceHome care agencyPublic or Community HealthHealth departmentCorrectional facilityOther SettingsAcademic education programOccupational/employee 72.11.30.85.03.11.10.8100.0Data Source: 2012 National Sample Survey of Nurse Practitioners.*Survey question: “Your principal position is the position in which you work the most hours per week. Pleasereport only nursing (NP) positions for which you are paid. Do not include volunteer positions or adjunct facultystatus. Describe your principal position. Check only one.†Examples of federal clinics are Federally Qualified Health Centers, Veterans Affairs Medical Centers, and theIndian Health Service.‡Numbers practicing in rural health clinics and nurse managed health clinics may be understimates. They may beunderestimates because some respondents who work in rural/nurse managed health clinics, which are also hospitaloutpatient clinics or private practices, may have reported the latter as their primary practice setting.About 4 percent of the eligible respondents did not answer the question.Presence of Physicians: NPs providing patient care worked in a variety of collaborativearrangements with physicians, depending on state laws and the nature of the NP’s specific role.About 11 percent worked in a facility where there was no physician on site, but a majority (justover half) worked in settings where a physician was on site most of the time. NPs in long-termcare and public health had the least amount of physician time on site, whereas NPs in hospitalsreported the most physician presence (see Exhibit 6).Highlights From the 2012 National Sample Survey of Nurse Practitioners8
Exhibit 6. Presence of On-Site Physician for Nurse Practitioners Providing DirectPatient CareAmbulatoryHospital13%56%14% 6% 11%3% 10% 7% 10%Percentage oftime physicianpresent on site71%0%Long Term/Elder Care21%Public/Community Health17%Academic13%All Settings10%0%13% 8% 12%46%22%16%20%51%-75%76%-100%46%9% 11%56%7% 11%40%26%-50%34%8% 11%30%1%-25%60%80%100%Data Source: 2012 National Sample Survey of Nurse Practitioners.Billing: About 95 percent of NPs providing patient care reported having a National ProviderIdentifier (NPI) number, which is required for billing under Medicare, Medicaid, and manyprivate insurance companies. However, not all NPs reported using their NPI number for billingpurposes. About 63 percent of those who had an NPI number reported ever using it for billing.Salary: Salary varied substantially across the NP workforce depending on role, setting, andspecialty. NPs in patient care earned a median of 87,500 annually in 2012; those in surgicalspecialties earned the most (median salary 100,000), and primary care NPs earned the least(median salary 82,000). NPs in administrative roles requiring an NP credential earned a mediansalary of about 104,000, while NPs in faculty roles requiring an NP credential had a mediansalary of about 80,000 in 2012.NP Perceptions of Their WorkPerception of Scope of Practice: NPs in the workforce were generally satisfied that the dutiesof their principal position reflected the full scope of their NP capabilities and allowable scope ofpractice. Of those whose main position involves direct patient care, almost 84 percent agreedHighlights From the 2012 National Sample Survey of Nurse Practitioners9
that they “practice to the fullest extent of the state’s legal scope of practice,” and 89 percentagreed that their “NP skills are fully utilized.”Job Satisfaction: In general, NPs in the workforce reported high levels of job satisfaction.Overall, 92 percent of NPs were “satisfied” or “very satisfied” with their principal position.When specific elements of the job were examined, NPs were most satisfied with their level ofautonomy, time spent in patient care, sense of value for what they do, and respect from physiciancolleagues and other colleagues (see Exhibit 7). NPs were least satisfied with the amount ofpaperwork required, administrative support, and input into organizational or practice policies.Exhibit 7. Satisfaction of the Nurse Practitioners in the WorkforceLevel of autonomyProportion of time in patient careSense of value for workRespect from other colleaguesRespect from physician colleaguesPatient mixHours worked, including overtimePatient loadOpportunities for professional developmentSalary/benefitsAmount of administrative supportInput into organizational/practice policiesAmount of paperwork required0% 10% 20% 30% 40% 50% 60% 70% 80% 90% 100%Very SatisfiedSatisfiedDissatisfiedVery DissatisfiedData Source: 2012 National Sample Survey of Nurse Practitioners.Highlights From the 2012 National Sample Survey of Nurse Practitioners10
About the DataThe 2012 National Sample Survey of Nurse Practitioners (NSSNP) was designed to providenationally representative estimates of the U.S. Nurse Practitioner (NP) supply and to collect detaileddata on the licensure, education, clinical practice characteristics, and demographics of NPs. Thisstudy was reviewed and approved by the Office of Management and Budget (OMB control number0915-0348).HRSA designed the questionnaire in consultation with national nursing stakeholder groups andnursing workforce researchers. Cognitive testing was conducted with six licensed NPs representingthe range of individuals who would be responding to the NSSNP, and revisions to the questionnairewere made to improve its clarity and flow based on their feedback.To construct the sample, HRSA obtained a list of all actively licensed NPs from each state licensingboard and the District of Columbia in late 2011 and early 2012. A single national sampling frameutilizing probability matching was developed from 51 individual lists to help identify NPs withlicenses in multiple states. A random sample of 22,000 NPs was drawn from the unduplicated list,allocated by state in approximate proportion to the number of NPs licensed in each state.The survey was conducted entirely by mail, as the mailing address was the only contact informationconsistently captured across the 51 state licensing boards. The questionnaire was converted into ascannable data capture format to increase the accuracy and ease of data entry. Data were collectedfrom March 2012 to July 2012, using three waves of mailed questionnaires and a reminder postcard.The survey achieved a 60.1-percent response rate,1 and 12,923 NPs completed and returned usablequestionnaires. Sample weights were established to permit the development of unbiased nationalestimates.A public use file (PUF) is under development to facilitate more detailed analysis of the data. The PUFand related documentation will be housed on HRSA’s Data Warehouse and will be available fordownload free of charge: outNSSNP2012.aspx.1TheAmerican Association for Public Opinion Research (AAPOR) response rate 3 was used to calculate the 2012 NSSNP response rate. See The AmericanAssociation for Public Opinion Research. (2011). Standard definitions: Final dispositions of case codes and outcome rates for surveys. (7th ed.). Author. Available onlineat: finitions2011.pdf.Highlights From the 2012 National Sample Survey of Nurse Practitioners11
Data Source: 2012 National Sample Survey of Nurse Practitioners. Until recently, the probability of working in primary care decreased with each successive graduating year (see Exhibit 4). While 59 percent of NPs who graduated in 1992 or earlier work in primary care, only 42 percent of those who graduated in 2003 to 2007 do so. However, the