Transcription
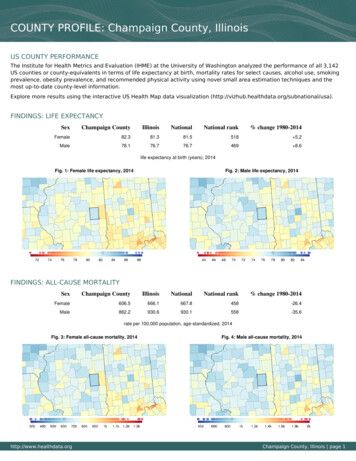
COUNTY PROFILE: Champaign County, IllinoisUS COUNTY PERFORMANCEThe Institute for Health Metrics and Evaluation (IHME) at the University of Washington analyzed the performance of all 3,142US counties or county-equivalents in terms of life expectancy at birth, mortality rates for select causes, alcohol use, smokingprevalence, obesity prevalence, and recommended physical activity using novel small area estimation techniques and themost up-to-date county-level information.Explore more results using the interactive US Health Map data visualization DINGS: LIFE EXPECTANCYSexChampaign CountyIllinoisNationalNational rank% change 1980-2014Female82.381.381.5518 5.2Male78.176.776.7469 8.6life expectancy at birth (years), 2014Fig. 1: Female life expectancy, 2014Fig. 2: Male life expectancy, 2014FINDINGS: ALL-CAUSE MORTALITYSexChampaign CountyIllinoisNationalNational rank% change .6930.1558-35.6rate per 100,000 population, age-standardized, 2014Fig. 3: Female all-cause mortality, 2014http://www.healthdata.orgFig. 4: Male all-cause mortality, 2014Champaign County, Illinois page 1
FINDINGS: ISCHEMIC HEART DISEASESexChampaign CountyIllinoisNationalNational rank% change 7191.5542-62.4rate per 100,000 population, age-standardized, 2014Fig. 5: Female ischemic heart disease, 2014Fig. 6: Male ischemic heart disease, 2014FINDINGS: CEREBROVASCULAR DISEASE (STROKE)SexChampaign CountyIllinoisNationalNational rank% change 8552-56.2rate per 100,000 population, age-standardized, 2014Fig. 7: Female cerebrovascular disease (stroke), 2014http://www.healthdata.orgFig. 8: Male cerebrovascular disease (stroke), 2014Champaign County, Illinois page 2
FINDINGS: TRACHEAL, BRONCHUS, AND LUNG CANCERSexChampaign CountyIllinoisNationalNational rank% change 1980-2014Female43.046.843.81096 30.1Male62.770.367.6872-38.4rate per 100,000 population, age-standardized, 2014Fig. 9: Female tracheal, bronchus, and lung cancer, 2014Fig. 10: Male tracheal, bronchus, and lung cancer, 2014FINDINGS: BREAST CANCERSexChampaign CountyIllinoisNationalNational rank% change 530-21.0rate per 100,000 population, age-standardized, 2014Fig. 11: Female breast cancer, 2014http://www.healthdata.orgFig. 12: Male breast cancer, 2014Champaign County, Illinois page 3
FINDINGS: MALIGNANT SKIN MELANOMASexChampaign CountyIllinoisNationalNational rank% change 1980-2014Female1.81.81.9645 4.4Male4.24.14.5780 19.8rate per 100,000 population, age-standardized, 2014Fig. 13: Female malignant skin melanoma, 2014Fig. 14: Male malignant skin melanoma, 2014FINDINGS: DIABETES, UROGENITAL, BLOOD, AND ENDOCRINE DISEASES MORTALITYSexChampaign CountyIllinoisNationalNational rank% change 1980-2014Female47.649.949.6951 15.7Male59.264.763.8945 4.9rate per 100,000 population, age-standardized, 2014Fig. 15: Female diabetes, urogenital, blood, and endocrine diseasesmortality, 2014http://www.healthdata.orgFig. 16: Male diabetes, urogenital, blood, and endocrine diseasesmortality, 2014Champaign County, Illinois page 4
FINDINGS: SELF-HARM AND INTERPERSONAL VIOLENCE MORTALITYSexChampaign CountyIllinoisNationalNational rank% change -10.0rate per 100,000 population, age-standardized, 2014Fig. 17: Female self-harm and interpersonal violence mortality, 2014Fig. 18: Male self-harm and interpersonal violence mortality, 2014FINDINGS: TRANSPORT INJURIES MORTALITYSexChampaign CountyIllinoisNationalNational rank% change 5-50.1rate per 100,000 population, age-standardized, 2014Fig. 19: Female transport injuries mortality, 2014http://www.healthdata.orgFig. 20: Male transport injuries mortality, 2014Champaign County, Illinois page 5
FINDINGS: MENTAL AND SUBSTANCE USE DISORDERS MORTALITYSexChampaign CountyIllinoisNationalNational rank% change 1980-2014Female5.56.48.2768 415.3Male16.017.018.71662 310.8rate per 100,000 population, age-standardized, 2014Fig. 21: Female mental and substance use disorders mortality, 2014Fig. 22: Male mental and substance use disorders mortality, 2014FINDINGS: CIRRHOSIS AND OTHER CHRONIC LIVER DISEASES MORTALITYSexChampaign CountyIllinoisNationalNational rank% change 1980-2014Female10.410.311.8861 1.8Male19.618.322.21127 2.0rate per 100,000 population, age-standardized, 2014Fig. 23: Female cirrhosis and other chronic liver diseases mortality,2014http://www.healthdata.orgFig. 24: Male cirrhosis and other chronic liver diseases mortality, 2014Champaign County, Illinois page 6
FINDINGS: HEAVY DRINKINGSexChampaign CountyIllinoisNationalNational rank% change 2005-2012Female8.58.56.72707 46.5Male10.911.29.91837 12.0prevalence (%), age-standardized, 2012Fig. 25: Female heavy drinking, 2012Fig. 26: Male heavy drinking, 2012FINDINGS: BINGE DRINKINGSexChampaign CountyIllinoisNationalNational rank% change 2002-2012Female14.515.912.42414 23.8Male26.028.824.51893 10.1prevalence (%), age-standardized, 2012Fig. 27: Female binge drinking, 2012http://www.healthdata.orgFig. 28: Male binge drinking, 2012Champaign County, Illinois page 7
FINDINGS: SMOKINGSexChampaign CountyIllinoisNationalNational rank% change 118-19.0prevalence (%), age-standardized, 2012Fig. 29: Female smoking, 2012Fig. 30: Male smoking, 2012FINDINGS: OBESITYSexChampaign CountyIllinoisNationalNational rank% change 2001-2011Female36.336.336.1974 37.5Male32.233.933.8280 30.2prevalence (%), age-standardized, 2011Fig. 31: Female obesity, 2011http://www.healthdata.orgFig. 32: Male obesity, 2011Champaign County, Illinois page 8
FINDINGS: RECOMMENDED PHYSICAL ACTIVITYSexChampaign CountyIllinoisNationalNational rank% change 2001-2011Female56.554.252.6532 21.7Male58.554.856.3563-5.9prevalence (%), age-standardized, 2011Fig. 33: Female recommended physical activity, 2011Fig. 34: Male recommended physical activity, 2011CITATION:Institute for Health Metrics and Evaluation (IHME),US County Profile: Champaign County, Illinois.Seattle, WA: IHME, 2016.Institute for Health Metrics and Evaluation2301 Fifth Ave., Suite 600Seattle, WA 98121 USAhttp://www.healthdata.orgTelephone: 1-206-897-2800E-mail: engage@healthdata.orgwww.healthdata.orgChampaign County, Illinois page 9
Sex Champaign County Illinois National National rank % change 2005-2012 Female 8.5 8.5 6.7 2707 46.5 Male 10.9 11.2 9.9 1837 12.0 prevalence (%), age-standardized, 2012 Fig. 25: Female heavy drinking, 2012 Fig. 26: Male heavy drinking, 2012 FINDINGS: BINGE DRINKING Sex Champaign County Illinois National National rank % change 2002-2012