Transcription
Treemaps and Choropleth Maps Applied to Regional Hierarchical Statistical DataMikael Jern, Jakob Rogstadius, Tobias ÅströmNCVA – National Center for Visual Analytics, Linkoping University, Swedenmikael.jern@itn.liu.se, jakob.rogstadius@gmail.com, tobias.astrom@itn.liu.seKeywords--- Information visualization, treemap,choropleth map, linked views, demographics datagroups and to discuss strengths and weaknesses ofthis method of representation. Choropleth map only – to discuss strengths andweaknesses of this method of representation and tomake comparisons with the treemap. Combined treemap and choropleth map applied in adynamically linked views environment – toillustrate how the two methods counter each other’smain weaknesses when used together.The main contribution of our paper is an informalevaluation with domain experts and the authors’ informalreflections that a treemap representation could be a validvisual exploration and communication method foranalyzing large hierarchical social science data. We alsosuggest that benefits can be gained by dynamicallylinking a choropleth map view with a treemap whensearching for patterns and structure in the data. Thepaper is organized as follows: Related work is describedbelow followed by an overview of the hierarchicalregional OECD dataset in Section 3. Sections 4–6describe the three application scenarios and theirassessment. In the last section a longer analyticalreasoning is given based on informal user evaluation andthe authors’ own conclusions.1. Introduction2. Related workMassive volumes of geospatial statistical data aretoday generated all over the world but not used aseffectively as one would wish for [16]. Too little focushas been given to making advanced Geovisual Analyticstechnologies practical and accessible to statisticians. Thispaper reflects a challenging applied research task tostimulate, at global level, an exchange of best practicesthrough Geovisual Analytics [18]. Tools are introducedthat help establish progress initiatives at international andsub-national levels aimed at measuring economic, socialand environmental developments. In this article wedemonstrate and reflect upon the synergy between thetreemap and the choropleth map. We illustrate theconcept by visualizing hierarchical high resolutionpopulation data from OECD, with three usage scenarios: Treemap only - to explore a large hierarchicaldataset containing population data in different ageHierarchical data is often visualized as data densetreemap layouts [1], [2], which fill the screen efficientlywithout empty space between data items. Rectangles arecreated in a visual order that matches the input to atreemap algorithm [3], [4], where dense layoutsrecursively subdivide space at each level in a hierarchyand child nodes are placed inside their parents. Each dataitem is considered to be a node and can have labels andstatistical attributes encoded as relative object size orcolour. Treemaps provide spatial area for nodes underthe same parent and visually emphasize the sizes of, inour application, “population” at all levels in the regionalstatistical data hierarchy. This is not difficult to program,can run fast and is easy to perceive and compare visually.Shneiderman and Plaisant [6] give an excellenthistorical overview of the evolution and commercialsuccess of treemaps. Geospatial hierarchical data appliedin treemaps and grouped by space was first used byAbstractAn emerging and challenging Geovisual Analyticsapplication domain is visualization of hierarchicalregional (sub-national) statistics. The OECD regionaldatabase is a potential treasure chest for policy-makers,researchers and citizens to gain a better understandingof a region’s structure and performance and to carry outanalysis of territorial trends and disparities based onsound information comparable across countries. Newmethods are needed to visually make comparisonsbetween groups on different hierarchical levels, such ascities with countries or parts of countries. In this context,we demonstrate and reflect upon the potential synergybetween information and geovisualization through theuse of a squarified treemap dynamically linked to achoropleth map to facilitate visualization of complexhierarchical social science data. We exemplify andevaluate our approach with three usage scenarios thatexplore population change in the OECD countries using1) squarified treemap, 2) regional choropleth map and 3)combined treemap and choropleth map.
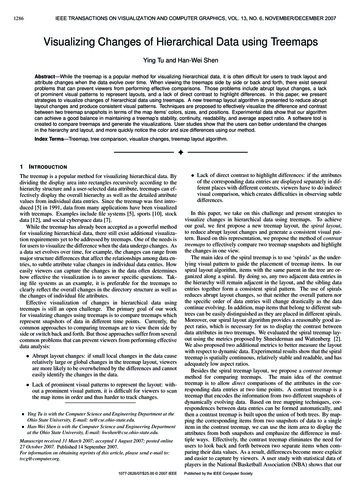
Smartmoney [7] and later by Panopticon [8]. A relatedspatial treemap approach was recently introduced bySlingsby, Dykes and Wood [9], [10]. They considervariable combinations as a hierarchy and use treemapsfor a large dataset and demonstrate links betweentreemap and maps. Little published research, however,has so far been made to use a combination of treemapsand maps to explore multilevel hierarchical geographicaldata.Our approach demonstrates and reasons about thebenefits of a single or combined choropleth map andtreemap. We explore raw and aggregated social scienceregional data at several hierarchical levels aiming todiscover statistical patterns that relate to significantcharacteristics of regions under study.Figure 1: A squarified treemap ordered by population size and NUTS1 regions, dynamically linked to a choropleth map, both colouredby the ratio of the population that is older than 65 years, and applied on a limited (Italy) OECD regional hierarchical dataset. The spatialhierarchical data structure is based on 5 levels: continent, country, NUTS1, NUTS2 and NUTS3.We are interested in finding answers about whatmethods and tasks are important when exploringdemographical hierarchical data, such as generaloverview, trends over time, geographical patterns,indicator correlation, outliers and simultaneouslymapping two dependent indicators such as age group andtotal population. For example, for a choropleth mapscreen space is always allocated depending ongeographical area rather than an indicator of interest?Can the treemap compensate this weakness and are itsknown strengths and weaknesses applicable to thedemographics data domain? A well-known approach forshowing regional statistical data is the cartogram [14],which distorts a map by resizing its regions according to,for example, population density or total population. Weevaluated this method for OECD regional data but thedomain experts could not recognize the many smallregions and found it almost impossible to tell which oftwo regions of similar size but different shape is thelargest, or by how much the size differs.Many papers [11], [12], [13] describe a combinationof choropleth map, scatter plot, parallel coordinates plotand heatmap etc. These papers do, however, not addressthe need for access to regional datasets on all hierarchicallevels, to for example make comparisons between groupson different hierarchical levels, such as cities withcountries or parts of countries.3. DatasetOECD countries have experienced a growing interest inregional development [15]. The performance of regionaleconomies and the effectiveness of regional policy helpdetermine a nation’s growth and shape the measure ofwell-being across countries. The OECD Regionaldatabase [16] provides statistical information at subnational level for all the OECD member countries. Itcontains yearly time-series for around 50 indicators ondemography, economy and labour market opportunities,environment, social issues and innovation relatedactivities for more than 1,700 regions of the OECDcountries. Data is organized in a five-level hierarchicalstructure – continent, country, Territorial Level 1 (TL1),TL2 and TL3 or European corresponding NUTS(1,2,3)regions. These levels are illustrated in Figure 1. For thisusage scenario, each region contains information aboutpopulation 2002-2007, for each year and separated by theage groups 0-14, 15-64 and 65 . The population valuesalso let us calculate the average population over time,average yearly population change in percent (the averageyearly percentage increase or decrease is calculated usingregression analysis to fit an exponential curve to thepopulation measurements for each year) and thepercentage of the population that falls into each agegroup.
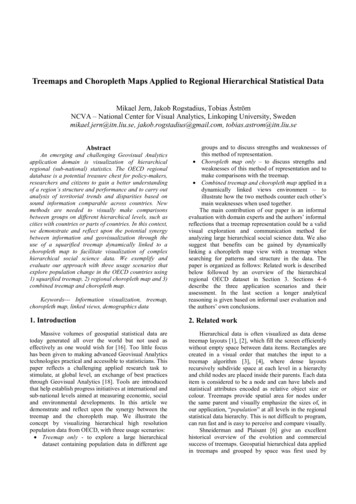
4. Treemap Displaying Population ChangeOur first usage scenario, figure 3, presents a treemapbuilt on the full OECD regional dataset, using thehierarchy Age Group, Continent, Country, TL1, TL2,Region Name. The size of each cell represents theaverage population of each region during the 2002-2007periods and the colour represents the population changeper year in percent. Below the treemap is a colour legendwith an overlaid histogram showing the populationchange distribution. To highlight highs and lows withoutmaking the representation overly sensitive to outliers, thecolours are scaled to match this distribution using the 1st,10th, 90th and 99th percentiles and with gray centred atzero (no change). Red tones represent a growingpopulation and blue tones represent a shrinkingpopulation.The top half of the treemap displays values for thetotal population, while the bottom half is split into theage groups 0-14, 15-64 and 65 . This means that Japanfor instance shows up four times; once with its totalpopulation displayed in the top half and three times inthe bottom half, where it is split into the three agegroups. Japan’s total cell area is the same in the bottomand top half. Note that a region’s rate of change for aspecific age group corresponds to the size of that agegroup only, not to its fraction of the region’s totalpopulation.The software used to create figure 2 lets the userinteract by selecting different regions in the treemap tocompare their exact values in a tabular view. The usercan also drill down in the data by choosing to render onlya specific branch of the tree, for instance ages 0-14,Europe, Germany. This is done by double clicking on agroup in the plot, which then allocates the entire screenarea to that branch so that smaller items can beidentified.4.1. What can be seen?We see from the size of the European group (top leftquarter of the treemap in figure 2) that the population ofthe European OECD member countries together isslightly larger than that of North America. We also seethat while there are slightly more children (people aged0-14) in North America than in Europe and far less inJapan, Europe has more elderly people (ages 65 ) thanNorth America and Japan together. Japan also has around70% as many elderly people as the USA, despite that itstotal population is less than half the size.Turning our attention to the colour of the cells in thetop half of the treemap (the total population), we see farmore red tones than blue. This indicates that the OECDpopulation as a whole is generally increasing, which iscorrect. Such a conclusion can be drawn in a treemapwhere colour is mapped to the rate of change in size ofeach cell, but would be impossible to draw in achoropleth map where the size instead represents thephysical area of each region.We also see that the number of children isdecreasing overall in the OECD member countries andthat the number of elderly people is increasing. Turkey,Poland, Germany and Korea are seeing dramaticdecreases in child populations with numbers in parts ofTurkey decreasing by up to eight percent per year. Notehowever that there are very large differences betweendifferent regions in Turkey, which we will return to inthe next section. Just like the young population isdecreasing, Turkey, Korea, Mexico, Japan, Germany andmany other European countries face equally dramaticincreases in elderly populations, again with Turkeytaking the lead with yearly increases of up to 14%.A few regions show values that drastically differfrom all other regions within the same country. Thismight indicate changes in regional borders, errors in thedata or important local events. The latter is likely thecase for New Orleans where the hurricane Katrina forceda large part of the population to move out in August2005. If we look closely, we can even see that NewOrleans’ population decrease is much larger for childrenthan for senior citizens.Last but not least, the treemap representation makesit very obvious just how small many of the Europeancountries are population wise. In fact, half of thesecountries have smaller populations than the largestAmerican, Japanese, Turkish and Korean city regions.The use of map borders for the treemap structure doeshowever also mean that political decisions on how todraw those borders affect our interpretation of the data.An example of this is that Paris is shown as havingroughly the same population as Stockholm, while inreality the urban populations of the two cities have aratio of around 8:1.5. Subset of Data in Choropleth MapFor reference we have included a subset of the datafrom figure 2 visualized using standard choropleth maps.Figure 3 shows the yearly population change for theregions in the European OECD member countries, foreach age group.It is safe to say that the geographical representationis more intuitive for most people to interpret than thetreemap is. The geographical patterns that were lost inthe treemap also show up, with Turkey having very largeincreases in the number of senior citizens mainly in thesouth-eastern (Kurdish) regions. The maps also showthat the number of children in Italy is decreasing in thesouth and increasing in the north.However, this perceived clarity does come at a cost.The maps only visualize one indicator of interest(population change) and all information about absolutepopulation size is lost. This for instance makes it easy todraw the false conclusion that the total population ofTurkey is decreasing, as there is more blue than red onthe map. In reality, Turkey experiences a slight yearlypopulation increase. The treemap visualization in figure4 does not suffer from the same problem and we can see
that Istanbul (a very small region on the map) isinhabited by a very large (and growing) part of the totalTurkish population.6. Treemap and Choropleth Map TogetherOur last usage scenario, figure 4, shows the youngpopulation of the European OECD member countriesvisualized using a combination of a choropleth map anda treemap. Colour in this figure, which again is mappedusing the 1st, 10th, 50h, 90th and 99th percentiles,represents the percentage of the total population that fallsinto the 0-14 age group. In other words, red areas have ahigh ratio of children and blue areas have a low ratio.Cell size in the treemap represents the total number ofpeople in each region.Four extreme clusters of regions immediately standout in the choropleth map. Again, south-eastern Turkeyis one of them, with children in some parts making upalmost half the population1. On the opposite end of thedistribution, with ratios down to nine percent, lie formerEast Germany, north-eastern Spain and northern Italy.The additional information provided by the treemapthat the choropleth map lacks is all based on theintroduction of a second indicator; in this case the size ofeach region’s population. For instance, it becomesapparent that despite that Sweden is the third largest ofthe included countries measured in physical area, it onlyhas a population of nine million – less than Turkey’sIstanbul region alone. It is also possible to see that whileGermany and Turkey currently have almost identicaltotal population numbers, Turkey has far more children.Over the next few decades Turkey is therefore likely toovertake Germany as the European OECD membercountry with the highest population.7. ConclusionsWe have with three usage scenarios shown that thetreemap is a valid visualization method for hierarchicaldemographics data and that many benefits are gainedwhen linking a choropleth map view with a treemap.Domain experts who have analyzed this data use thechoropleth map’s geographical representation to drawconclusions that take into account political and historicalevents that may have caused the current trends.At the same time, the treemap offers an alternativeway of simultaneously viewing the same data,independent of geography. In this view it is much easierto compare groups of regions, even on differenthierarchical levels. This is true in particular whenmapping cell size to an absolute number and colour tothe rate of change of the same indicator, as an averagerate of change can be estimated based on the averagecolour of the group. Doing this in a choropleth map canlead to highly incorrect conclusions, as a tiny region may1Less than four percent of the population is above 65years of age in many of the same regions.(and in the case of densely populated capital regionsoften does) account for almost the entire change.Our first informal usability tests with domainexperts resulted in both positive and negative results butencouraging qualitative feedback. We summarize belowsome comments based on informal discussion andevaluation between domain experts and authors: It is easier to generate hypotheses from a choroplethmap than from a treemap, but hypotheses generatedfrom a treemap may hold more value. The treemap is difficult to interpret, but even moredifficult to misinterpret. Once a pattern has beenfound it is very rarely later dismissed as incorrect. The choropleth map is easy both to interpret and tomisinterpret, as many conclusions fail to take intoaccount that indicator values for different regionsmay not correlate with region size. Colour and area that dominate the treemap arefairly vague value mappings. This means that thetreemap can give an overview and be hypothesisgenerating, but that other methods which give theuser access to more precise comparisons arerequired for validation. The treemap is a rather complex visualrepresentation that requires the user to focusintensely on it to be able to fully draw conclusions.This should be taken into consideration whencombining it with other views, as there is a risk forinformation overload. Our experiences show thatusers have a tendency to look at the views that areeasier to understand and draw conclusions fromthere, instead of trying to interpret the treemap. Although the treemap-choropleth map combinationmay lack the strong visual impact that oftencharacterizes a cartogram, we argue that it gives atruer image of the visualized data and that it istherefore far more suitable for demographicalanalytical situations. All hypothesis evaluation related to social sciencedata requires a strong understanding of theunderlying factors that govern the measuredindicators, but the evaluation process can efficientlybe supported by a combination of these examplesand other methods that let the analyst access thevalues directly. Statistical social science data collected per regionbenefits strongly from the alternative viewpointprovided by the treemap representation. Regions ofhigh interest tend to be characterized by highpopulation density; or a large population (orotherwise large absolute indicator values) and asmall geographical size. Such characteristics areallocated more screen space in a treemap, unlike achoropleth map where the relation is inversed andpopulation dense regions tend to be very small.We have reached the conclusion based on our ownreasoning together with domain experts’ evaluation that
for a combined treemap and choropleth map approachthe analyst is able to: Easily see geographical patterns and clusters,including ones that span national borders. Make far more accurate estimates of the averagevalues for groups of regions, than if a choroplethmap had been used alone. In a single view compare individual regions andgroups of regions with each other on differenthierarchical levels. Focus the attention to regions of interest, evenwhen they are geographically very small.Our next step is to conduct a more controlled evaluationwithin our engagement in the Global Project on"Measuring the Progress of Societies" [18], which seeksto become the world wide reference point for those whowish to assess the progress of their societies.AcknowledgementThis applied research case study was carried out byNational Center for Visual Analytics (NCVA), ITN,Linkoping University, in close collaboration with OECDwhich supplied data and domain expertise. The researchis in part funded by the “Visualization Program”coordinated by the Swedish Knowledge Foundation.References[1] B. Shneiderman. Tree visualization with tree-maps: a 2dspace-filling approach. ACMTransactionson Graphics,11(1):92–99, September 1992.[2] B. Johnson and B. Shneiderman. Treemaps: a space-fillingapproach to the visualization of hierarchical informationstructures. In Proc. of the 2nd International IEEEVisualization Conference, pages 284–291, October 1991.[3] Schiederman B. Tree visualization with tree-maps: a 2dspace-filling approach. ACM Transactions on Graphics1992; 11(1): 92-99.[4] B. Bederson, B. Shneiderman, and M.Wattenberg. Orderedand quantum treemaps: Making effective use of 2d space todisplay hierarchies.ACM Trans. Graph., 21(4):833–854,2002.[5] M. Bruls, K. Huizing, and J. J. Van Wijk. Squarifiedtreemaps. In Proceedings of the Joint Eurographics andIEEE TCVG Symposium on Visualization, 2000.[6] B. Shneiderman and C. Plaisant. Treemaps for spaceconstrained visualization of hierarchies, ] M.Wattenberg. Map of the Market. p/[8] Panopticon, Stockholm, Sweden.[9] A. Slingsby, J. Dykes and J. Wood. Using treemaps forvariable selection in spatio-temporal visualisation,Information Visualization, Volume 7, Numbers 3-4, 2008 ,pp. 210-224(15).[10] J. Wood and J. Dykes From slice and dice to hierarchicalcartograms: Spatial referencing of treemaps, inProceedings of GIS Research UK, Lambrick D, Editor.2008: Manchester. p. 1-8.[11] D. Guo, M.Gahegan, A. MacEachren and B.Zhou,“Multivariate Analysis and Geovisualization with anIntegrated Geographic Knowledge Discovery Approach”,Cartography and Geographic Information Science, Vol. 32,No. 2, 2005, pp 113-132.[12] D. Guo, J. Chen, A.M. MacEachren, K. Liao “Avisualization system for space-time and multivariatepatterns (VIS-STAMP),” IEEE Visualization and ComputerGraphics, Vol 12, No 6, 2006.[13] G. Andrienko, N. Andrienko, R. Fischer, V. Mues, and A.Schuck. “The parallel coordinate plot in action: design anduse for geographic visualization.” International Journal ofGeographical Information Science, 20(10) :1149–1171,November 2006.[14] D. Keim, S. North, C. Panse .CartoDraw: a fast algorithmfor generating contiguous cartogramsVisualization and Computer Graphics, IEEE Transactionson Volume 10, Issue 1, Jan.-Feb. 2004 Page(s):95 - 110[[15] http://www.oecd.org/GOV/regionaldevelopment[16] OECD Regional databasehttp://stats.oecd.org/WBOS/index.aspx[17] OECD Regions at a glance: 2009 edition[18] http://www.oecd.org/document/7/0,3343,en 40033426 40037426 40037831 1 1 1 1,00.html
Figure 2: The population and population change in the OECD member countries, plotted as a Treemap. Colour represents populationincrease (red) or decrease (blue) and the size of each cell is mapped to the average population of each region during the measured timeperiod. The top half of the Treemap shows the values for the total population, while the bottom half is split into three different age groups0-14, 15-64 and 65 . The image is available in colour and full resolution ctures/oecd population change treemap A4%20FIGURE%203.png
Figure 3: The estimated yearly population change in percent in the regions of the European OECD member countries. Each map showsthe change within a specific age group.
Figure 4: Linked treemap and choropleth map showing the ratio of children in the European OECD member countries. The colour ofeach region represents the percentage of the total population that falls within the 0-14 age group. Size in the Treemap shows the size ofthe total population. The image is available in colour and full resolution at: res/europe 014 ratio treemap%2Bchoropleth A4%20Figure%205.png.
hierarchical social science data. We exemplify and evaluate our approach with three usage scenarios that explore population change in the OECD countries using 1) squarified treemap, 2) regional choropleth map and 3) combined treemap and choropleth map. Keywords--- Information visualization, treemap, choropleth map, linked views, demographics .