Transcription
Stricker-Krongrad et al. BMC Clinical Pathology (2018) 18:1DOI 10.1186/s12907-017-0068-6RESEARCH ARTICLEOpen AccessComparison of a microsphere-basedplatform with a multiplex flow cytometricassay for determination of circulatingcytokines in the mouseAlain Stricker-Krongrad*, Catherine Shoemake, Miao Zhong, Jason Liu and Guy BouchardAbstractBackground: Measuring expression profiles of inflammatory biomarkers is important in monitoring the polarizationof immune responses; therefore, results should be independent of quantitation methods if they are to be acceptedas validated clinical pathology biomarkers. To evaluate effects of differing quantitation methods, the seven majorcirculating Th1/Th2/Th17 cytokines interleukin 2 (IL-2), interferon γ (IFN-γ), tumor necrosis factor α (TNF-α), IL-4, IL-6,IL-10 and IL-17A were quantified in plasma of lipopolysaccharide (LPS)-treated mice with two different multiplexplatforms.Methods: Female C57BL6 mice were treated orally with vehicle or dexamethasone, followed by LPS intravenously.Plasma samples were analyzed 0.5, 1, 2, 4, and 6 h post-LPS challenge with assays at Myriad-RBM and compared toassays performed on a BD Accuri C6 flow cytometer.Results: IL-17A response to LPS was limited but sustained, and the response for the remaining cytokines were earlyand transient; dexamethasone reduced expression of all 7 cytokines. TNF-α and IL-6 levels were similar across bothassays, and IL-4 levels were generally very low. Plasma levels of remaining cytokines were variably lower with BDassays than Myriad-RBM assays.Conclusions: The present findings demonstrate that quantitation of circulating biomarkers of inflammation can beachieved using multiplexed flow cytometry, but careful consideration must be taken for assay validation whencross-referencing with another multiplexed assay.BackgroundA number of cytokines, such as interleukin 2 (IL-2),interferon γ (IFN-γ), tumor necrosis factor α (TNFα),IL-4, IL-6, IL-17A and IL-10, become elevated in tissuesin response to inflammation. These cytokines are alsokey regulators of immune responses and elevations ofthese different cytokines are individually associated withresponses of specific T helper cell (Th) lineages. IFN-γ,IL-2, and TNFα are associated with the Th1 response.IL-4, IL-6 and IL-10 are associated with the Th2response. IL-6 and IL-17A are associated with the Th17response. Since these variabilities exist, measuring* Correspondence: astricker@sinclairresearch.comSinclair Research Center, LLC, 562 State Rd. DD, Auxvasse, MO 65231, USAexpression profiles of these cytokines is important tomonitor the polarization of the immune response.Lipopolysaccharide (LPS) administration reliablyinduces an acute inflammation that is associated withincreases of a number of inflammatory cytokines in theperipheral blood of LPS-treated animals [1]. Additionally, dexamethasone (DEX) administration inhibits theeffects of LPS on cytokine synthesis in animal models[2]. These properties of LPS and DEX can then be usedfor evaluation of anti-inflammatory drug effects or, as inthe present case, comparison and validation of cytokineidentification and quantitation methods. The objectiveof the present study was to implement and validatebench top flow cytometry for the ex vivo quantitation ofcirculating cytokine levels in multiplex assay formats. The Author(s). 2018 Open Access This article is distributed under the terms of the Creative Commons Attribution 4.0International License (http://creativecommons.org/licenses/by/4.0/), which permits unrestricted use, distribution, andreproduction in any medium, provided you give appropriate credit to the original author(s) and the source, provide a link tothe Creative Commons license, and indicate if changes were made. The Creative Commons Public Domain Dedication o/1.0/) applies to the data made available in this article, unless otherwise stated.
Stricker-Krongrad et al. BMC Clinical Pathology (2018) 18:1Cytokine quantitation was performed on a Becton Dickson (BD) Accuri C6 flow cytometer, and results werecompared to those produced by a commercial biomarkertesting laboratory performing rodent multi-analyte profile (MAP) assays.MethodsTest systemFemale C57BL/6 mice, approximately 6–9 weeks of ageand weighing 17–20 g, were purchased from CharlesRiver Laboratories. The mice were housed 2–3 per cagein shoebox cages in a room with temperature maintained between 64 and 80 F (18-29 C) and with a 12-hlight/12-h dark photoperiod. The animals had ad libitumaccess to Harlan Teklad Global Rodent Diet 2018 anddeep well water. All study procedures were reviewed andapproved by Sinclair Research Center’s Institutional Animal Care and Use Committee. Housing and animal careconformed to the guidelines of the Guide for the Careand Use of Laboratory Animals, 8th edition published bythe U.S. National Institutes of Health and to applicableinstitutional standard operating procedures. Euthanasiaswere performed in accordance with the American Veterinary Medical Association’s published guidelines [3].After being acclimated for 3 days, mice were randomized into groups with 6 mice in the untreated group, 32mice in a group treated with LPS, and 32 mice in a grouptreated with LPS plus DEX. Identification of each animalwas maintained using ear notches and cage cards.Methyl cellulose, DEX, and LPS were obtained fromSigma-Aldrich (St Louis, Missouri). Methyl cellulose wasdissolved in sterile water (Hospira, Lake Forest, Illinois)overnight to form a 0.5% solution for use as the vehicle.DEX was suspended overnight in 0.5% methyl celluloseat a concentration of 0.5 mg/mL and then sonicatedbriefly before dosing. LPS was prepared the day beforedosing in 0.9% saline for injection (Hospira) at a concentration of 0.04 mg/mL.Mice in the untreated group were bled for plasmawithout any treatment. Mice in the LPS treatment groupwere administered 0.5% methyl cellulose at 10 mL/kg viaoral gavage, and then were treated 1.5 h later with0.2 mg/kg LPS intravenously (IV) at a volume of 5 mL/kg. The LPS plus DEX groups were administered 5 mg/kg dexamethasone via oral gavage, and then underwentthe same IV LPS treatment as above 1.5 h later. Six toeight mice from each treatment group were bled forplasma at 0.5, 1, 2, 4, and 6 h following LPS challenge.Page 2 of 6The samples were centrifuged at 3000 rpm for 15 min at4 C; plasma was then drawn off and placed into separate vials. Plasma samples were separated into two setsand placed on dry ice and stored at 70 C before beinganalyzed for cytokine profiles.One set of plasma samples were shipped on dry ice toMyriad RBM, Inc. (Austin, TX) for cytokine profiling withMouse Cytokine Panels A & B (4-h time point) and RodentMAP V3.0 Antigen (0.5-, 1, 2, and 6-h time points) assays(based on a Multiplexed Luminex Platform).Seven cytokines (IL-2, IFN-γ, TNFα, IL-4, IL-6, IL17A, and IL-10) were analyzed at the 2- and 4- h timepoints in the second set of collected plasma sampleswith a cytometric bead array (CBA) mouse Th1/Th2/Th17 cytokine kit (BD Biosciences) on a BD Accuri C6flow cytometer. The CBA Mouse Th1/Th2/Th17 Cytokine Kit Manual (BD Biosciences) was followed for theassay procedure. Plasma samples were thawed at roomtemperature and then placed on wet ice for duration ofanalysis. One vial of mixed standards was freshly reconstituted in 2.0 mL of assay diluent, and then was serialdiluted. The concentrations of standards for each cytokine were 0, 20, 40, 80, 156, 312.5, 625, 1250, 2500, and5000 pg/mL. Seven types of cytokine capture beads werefreshly mixed in equal amounts (10 μL bead per assaytube) in a master tube. To perform the assay, 50 μL ofthe mixed beads were incubated with 50 μL of standardsor samples along with 50 μL of Phycoerythrin (PE)Detection Reagent in a MultiScreen filter plate (1.2 μmpore size, EMD Millipore, Darmstadt, Germany) at roomtemperature for 2 h. At the end of incubation, the platewas drained on a vacuum manifold. The beads in eachof the individual wells of the plate were resuspended in120 μL of wash buffer, and were then analyzed on theBD Accuri C6 flow cytometer. The seven distinct fluorescence beads were sorted with fluorescence signals captured in FL4 channel. PE intensity of individual beadswas captured in FL2 channel. Approximately 200 eventsfor each bead group were acquired (based on experiencein generating data in previous experiments). The acquired data were subsequently analyzed for individualcytokine concentrations in each sample using the FCAPArray software (BD Biosciences).Results for the 7 cytokines IL-2, IFN-γ, TNFα, IL-4, IL-6,IL-17A, and IL-10 were compared between BD Biosciencesand Myriad RBM assays. Concentrations for individualcytokines were expressed as mean standard deviation.Effects of DEX on LPS-induced plasma cytokine changeswere evaluated with a two-way student t-test.Plasma preparation and analysisAll blood samples were collected into K2EDTA tubes(0.5 mL, Greiner Bio-One North America, Inc. Monroe,North Carolina). Filled tubes were placed on wet ice andwere processed within 30 min after blood collections.ResultsLevels of the selected cytokines in plasma of normal miceFor flow cytometry using BD CBA, a set of mixed standards for the 7 cytokines (IL-2, IFN-γ, TNF-α, IL-4, IL-6,
Stricker-Krongrad et al. BMC Clinical Pathology (2018) 18:1IL-17A and IL-10) were freshly prepared with serial dilution. When recombinant standards were diluted in normal mouse plasma, the data showed that each of the 7cytokines was quantitated in the linear range betweenthe expected concentrations of 20–5000 pg/mL. Circulating concentrations of the same cytokines were measured in 6 untreated normal mouse plasma samples.None of the 7 cytokines could be detected or quantifiedwith the CBA or the Myriad RBM assays in the normalplasma, indicating that the background of cytokine levelswere below the lower limit of detection.Time-course of cytokines stimulation after LPSadministrationThe pharmacodynamics effects of LPS on Th1/Th2/Th17 circulating cytokines as quantitated with the Myriad RBM Assay are indicated in Table 1. After acute IVadministration of 0.2 mg/kg LPS in mice, classical stimulatory responses were observed with a TNF-α peak at 1–2 h, followed by peaks of IFN-γ, IL-10 and IL-6 at 2 h,and gradual decline over the following 4 h. [4]. Thesetime course data were used to select two critical timepoints, 2- and 4-h post LPS stimulation, to conduct further comparative analyses of the two analytical methods.Comparative levels of the selected cytokines in plasma ofLPS treated miceFor flow cytometry using BD CBA, the 7 cytokineswere detected in diluted plasma for the 2-h samplesand in undiluted plasma for the 4-h samples. IL-2 andIL-4 were below the lower limit of detection (LLOD) inboth 2- and 4- h samples (data not shown). IL-17A wasdetectable only in the 4-h samples, but was below thelower limit of quantification (LLOQ). The other 4 cytokines (IFN-γ, TNF, IL-6, and IL-10) were detectedwithin the defined concentration ranges. IL-6 was theonly cytokine that needed to be quantitated in the diluted plasma. It was shown that 10 dilution was appropriate for the 2-h samples and 5 dilutionpotentially for the 4-h samples. Variations in concentrations of cytokines were consistent and acceptable whenPage 3 of 6determined in diluted plasma samples with BD CBAassay. Minimum required dilution was evaluated at the2-h time point since the linear range of the BD CBAassay was limited to 20–5000 pg/mL. Coefficient of variations for dilutions of IL-10, TNF-α, and IL-6 were12.5%, 11.2%, and 11.1% respectively in the LPS treatedsamples, and were 2.5%, 5.5%, and 6.2% respectively inthe LPS plus DEX treated samples (Table 2).In the Myriad RBM platform, while LPS was shownto increase plasma TNF-α to similar levels in both 2and 4- h samples (Table 3), DEX had much weaker inhibition in 4-h samples than in 2-h samples (Table 4).Plasma IFN-γ was increased as previously reported [1]following LPS challenge in the Myriad RBM assays,while an increase did not occur in the BD CBA assay(Tables 3 and 4). IL-10 was quantified at lower plasmalevels with a less potent inhibition of DEX in BD CBAassay than in Myriad-RBM assay.In a comparison of both the Myriad RBM and BDBiosciences multiplex platforms, DEX was shown toinhibit plasma concentrations of IFN-γ, TNF-α, IL-6,and IL-10 in both 2- and 4- h samples. A similar inhibitory effect of DEX was also observed for IL-17Ain the 4-h samples. However, variations were observedbetween the two assay platforms in terms of cytokineconcentrations, time course effects of LPS, and magnitudes of DEX inhibition. IL-6 was the only cytokinethat was detected comparably with Myriad-RBM assays and BD CBA assay, as demonstrated by the direct relationship between the two assays (Fig. 1).DiscussionPlasma TNF-α has previously been shown to peak at 1 hpost-LPS challenge and then to gradually decrease overtime in treated mice [5]. In the BD CBA assay, a similarLPS effect on TNF-α was observed in the 2- and 4- hplasma samples, and the DEX inhibitions were comparable between the 2- and 4- h plasma samples. In theMyriad-RBM platform, while LPS was shown to increaseplasma TNF-α to similar levels in both the 2- and 4- hsamples, DEX had much weaker inhibition in the 4-hTable 1 Time Course Effects of LPS on Th1/Th2/Th17 Cytokine Plasma Levels in LPS-Treated Mice Quantitated with Myriad AssayTime post-LPS exposureCytokines0.5a Hours1.0a Hours2.0a Hours4.0b Hours6.0a HoursIL-2 (pg/mL)––24568–IL-4 (pg/mL)–––80–IL-6 (pg/mL)176459724,66729361066IL-10 (pg/mL)6975013771738781646IL-17A (ng/mL)–0.0250.0830.0800.031INF-γ (pg/mL)–4471347287341TNF-α (ng/mL)0.221.820.420.400.15an 6, bn 8
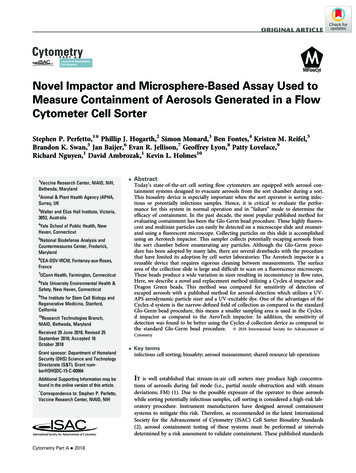
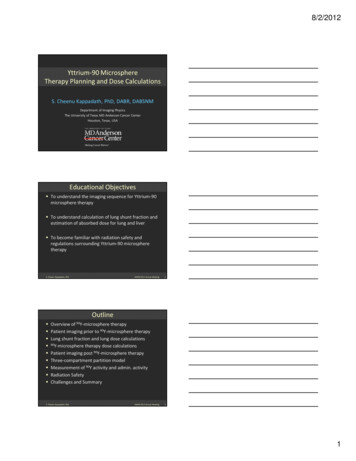
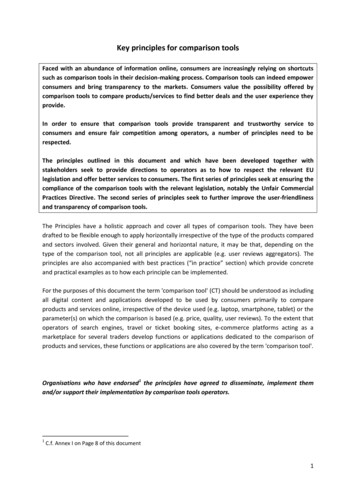
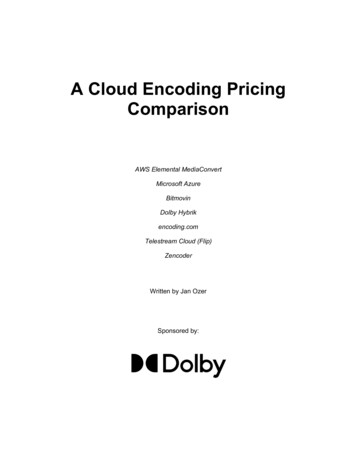
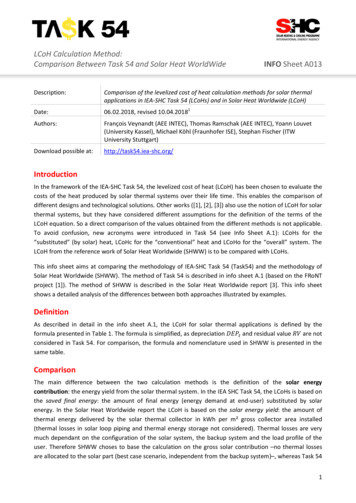
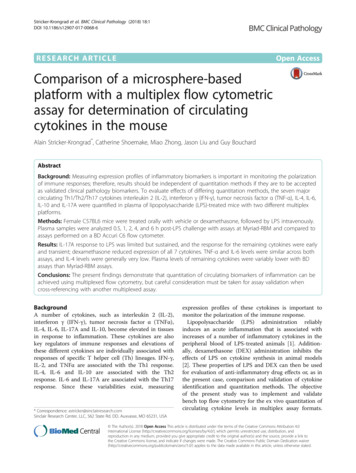
Stricker-Krongrad et al. BMC Clinical Pathology (2018) 18:1Page 4 of 6Table 2 Quantitation of Circulating IL-6, IL-10, & TNF-α in Diluted 2-Hour Plasma Samples with the BD CBA AssayTreatmentsLPSLPS DexamethasoneCytokines10 dilution5 dilution2 dilution%CVa10 dilution5 dilution2 dilution%CVaIL-6 IL-10 (pg/mL)34442643512.53513423342.5TNF-α (ng/mL)1.82.22.311.20.20.20.35.5a%CV coefficient of variationsamples than in the 2-h samples. Therefore, this wouldsuggest that the BD CBA assay was more accurate inmeasuring biologically-relevant TNF levels than MyriadRBM assays. In addition, this is supported by the lack ofdirect relationship between the two assays as illustratedin Fig. 2.Plasma IFN-γ was shown to increase through 4 hpost-LPS challenge in treated mice [1]. A similar LPSeffect on IFN-γ was observed in the 2- and 4- h plasmasamples with the BD CBA assay, whereas an oppositetrend for the IFN-γ secretion was observed in the samesamples with the Myriad RBM assays.Plasma IL-10 was quantified at lower levels in the BDCBA assay than in Myriad RBM assays. DEX wasshown to be less potent to inhibit IL-10 with BD CBAassay than with Myriad RBM assays. No other differences were found for IL-10 quantification between thetwo assay platforms, although the relationship betweenthe two assays was weak (Fig. 3). LPS and DEX are frequently used in rodent studies evaluating various inflammatory diseases, responses, and chemical ormedical agents. Their respective effects and responsesin various scenarios have been described in publicationssuch as those by NO Al-Harbi, F Imam, MM Al-Harbi,MA Ansari, KM Zoheir, HM Korashy, MM SayedAhmed, SM Attia, OA Shabanah and SF Ahmad [6].In the BD CBA assay, the time course effect of LPS onplasma TNF-α was consistent with what was previouslyreported [5], and the DEX inhibitions were comparablebetween the 2- and 4- h plasma samples. Reproduciblecirculating IL-6 was obtained for plasma samples of theLPS treated mice with the assays from both MyriadRBM and BD Biosciences. IL-6 was the only cytokinethat was quantified comparably between the BD CBAand the Myriad-RBM assays, and also the only cytokinethat needed be quantitated in diluted plasma when usingthe BD CBA assay, an indication of a high level of stimulation. IL-4 was the signature Th2 cytokine [7] whichwas supposed to not be induced by LPS treatment. Thelack of signal in IL-4 quantification with BD CBA assayreflected the specificity of this kit in IL-4 measurement.The BD CBA cytokine assay was not as sensitive asthe Myriad RBM assays in detecting and quantitatingcirculating IL-2, IL-10, and IL-17A levels in the LPStreated mice, but was more biologically-accurate inmeasuring circulating IL-4, TNF-α, and IFN-γ levels.Differences and similarities between these two assaysmay relate to the format of these multiplexed assaysbut also to the nature of the immunological reagentsused to capture and detect these cytokines. Althoughunknown at this time, it is quite possible that theantibodies used for the two assay platforms are identical when IL-6 is considered and different when TNF-αand IL-10 are measured.There are well-accepted methods for the validation ofbiomarkers [8, 9], although some form of consensusTable 3 Concentrations of the Circulating Th1/Th2/Th17Cytokines in LPS-Treated Mice Quantitated with Myriad and BDCBA AssaysTable 4 Concentrations of the Circulating Th1/Th2/Th17Cytokines in LPS plus Dexamethasone-Treated Mice Quantitatedwith Myriad and BD CBA AssaysTime post-LPS exposure2hTime post-LPS exposure4h2h4hCytokinesMyriadBD CBAMyriadBD CBACytokinesMyriadBD CBAMyriadBD CBAIL-2 (pg/mL)245–68–IL-2 (pg/mL)120–68–IL-4 (pg/mL)––80–IL-4 (pg/mL)––53–IL-6 (pg/mL)24,66735,40229355925IL-6 (pg/mL)648211,158314629IL-10 (pg/mL)77174023878238IL-10 (pg/mL)40603431438164IL-17A (ng/mL)0.083–0.080–IL-17A (ng/mL)0.037–0.020–INF-γ (pg/mL)13470.828741INF-γ (pg/mL)690–82–TNF-α (ng/mL)0.422.090.400.35TNF-α (ng/mL)0.110.200.180.05
Stricker-Krongrad et al. BMC Clinical Pathology (2018) 18:1Fig. 1 Comparison between Myriad and BD CBA assays inmeasuring individual circulating IL-6 levels in mice exposed toacute LPS administration with/withoutdexamethasone suppressionstill needs to be reached on standardization and validation of multi-parametric flow cytometry assays [10]and there are challenges surrounding both clinicalspecimen analysis and technical variations betweeninstruments [11]. As a general rule, multiplex cytokineassays are cross-validated with or referenced to singleanalyte immunoassays [12] and more studies comparingdifferent multiplex platform are needed to enable usersto determine which are best for a particular study [13].Previous studies have highlighted the intrinsic differences in reproducibility and accuracy between thesetechnologies [14, 15] and our present report supportsthe current notion that careful consideration must betaken before generalization of biomarker clinical datawhen generated on a specific multiplex platform.Page 5 of 6Fig. 3 Comparison between Myriad and BD CBA assays inmeasuring individual circulating IL-10 levels in mice exposed toacute LPS administration with/withoutdexamethasone suppressionConclusionIn conclusion, reproducible quantitation of circulatingTNF-α and IL-6 levels were obtained from plasma samples of LPS treated mice with assays from both MyriadRBM and BD Biosciences. The BD CBA cytokine assaywas not as sensitive as the Myriad RBM assays in detecting and quantitating circulating IL-2 and IL-4 and IL17A levels in the LPS treated mice, but was moresensitive in measuring circulating IFN-γ levels. Reliablecirculating IL-4 measurements were not achieved byeither assay. The present data demonstrate that thequantitation of circulating biomarkers of inflammationcan be achieved using multiplexed flow cytometry, butthat careful considerations have to be made to thebiological validation of the assays. This data also suggestthat a multiplex assay cannot be used as a validationreference when implementing another multiplex assayon a different platform.AbbreviationsBD: Becton Dickson; CBA: Cytometric bead array; DEX: Dexamethasone; IFNγ: Interferon-γ; IL: Interleukin; IV: Intravenously; LLOD: Lower limit ofdetection; LLOQ: Lower limit of quantification; LPS: Lipopolysaccharide;MAP: Multi-analyte profile; PE: Phycoerythrin; Th: T helper cell; TNF-α: Tumornecrosis factor-αAcknowledgementsThe Authors would like to thank Amanda Teel for generating the artwork forthe figures.FundingThe present studies were funded by the Sinclair Research Center with noother sources of funding.Fig. 2 Comparison between Myriad and BD CBA assays inmeasuring individual circulating TNF-α levels in mice exposed toacute LPS administration with/withoutdexamethasone suppressionAvailability of data and materialsDatasets with all individual mouse cytokines data (files in Excel format)generated with the Myriad-RBM and BD Accuri C6 flow cytometer will besend upon request to the corresponding author.
Stricker-Krongrad et al. BMC Clinical Pathology (2018) 18:1Authors’ contributionsASK conceived the study, designed the experiment, carried out the flowcytometric data analyses, participated in the cytokines data analyses anddrafted the manuscript. CS participated in the design of the experiment,participated in the cytokines data analyses and drafted the manuscript. MZcarried out the animal experiment, carried the flow cytometry experiment,conducted the cytokines data analyses and participated in the drafting ofthe manuscript. JL participated in the design and coordination of the studyand helped to draft the manuscript. GB participated in the design andcoordination of the study and helped to draft the manuscript. All authorsread and approved the final manuscript.Page 6 of 613. Richens JL, Urbanowicz RA, Metcalf R, Corne J, O'Shea P, Fairclough L.Quantitative validation and comparison of multiplex cytokine kits. J BiomolScreen. 2010;15(5):562–8.14. Moncunill G, Campo JJ, Dobano C. Quantification of multiple cytokines andchemokines using cytometric bead arrays. Methods Mol Biol. 2014;1172:65–86.15. Djoba Siawaya JF, Roberts T, Babb C, Black G, Golakai HJ, Stanley K, BapelaNB, Hoal E, Parida S, van Helden P, et al. An evaluation of commercialfluorescent bead-based luminex cytokine assays. PLoS One. 2008;3(7):e2535.Ethics approval and consent to participateAll study procedures were reviewed and approved by Sinclair ResearchCenter’s Institutional Animal Care and Use Committee.Consent for publicationNot applicable.Competing interestsThe authors are employees of Sinclair Research Center, a private researchorganization. The Sinclair Research Center did not have any influence on theoutcome the study or the interpretation of the data.Publisher’s NoteSpringer Nature remains neutral with regard to jurisdictional claims inpublished maps and institutional affiliations.Received: 10 August 2016 Accepted: 28 December 2017References1. Pini M, Castellanos KJ, Rhodes DH, Fantuzzi G. Obesity and IL-6 interact inmodulating the response to endotoxemia in mice. Cytokine. 2013;61(1):71–7.2. Goodwin JE, Feng Y, Velazquez H, Zhou H, Sessa WC. Loss of theendothelial glucocorticoid receptor prevents the therapeutic protectionafforded by dexamethasone after LPS. PLoS One. 2014;9(10):e108126.3. Leary S, Underwood W, Anthony R, Cartner S, Corey D, Grandin T, GreenacreCB, Gwaltney-Bran S, McCrackin MA, Meyer R. AVMA Guidelines for theEuthanasia of Animals, 2013 Edition. Schaumburg: American VeterinaryMedical Association; 2013.4. Biesmans S, Meert TF, Bouwknecht JA, Acton PD, Davoodi N, De Haes P,Kuijlaars J, Langlois X, Matthews LJ, Ver Donck L, et al. Systemic immuneactivation leads to neuroinflammation and sickness behavior in mice.Mediat Inflamm. 2013;2013:271359.5. Dinges MM, Schlievert PM. Role of T cells and gamma interferon duringinduction of hypersensitivity to lipopolysaccharide by toxic shock syndrometoxin 1 in mice. Infect Immun. 2001;69(3):1256–64.6. Al-Harbi NO, Imam F, Al-Harbi MM, Ansari MA, Zoheir KM, Korashy HM,Sayed-Ahmed MM, Attia SM, Shabanah OA, Ahmad SF. Dexamethasoneattenuates LPS-induced acute lung injury through inhibition of NF-kappaB,COX-2, and pro-inflammatory mediators. Immunol Investig. 2016;45(4):349–69.7. Raphael I, Nalawade S, Eagar TN, Forsthuber TG. T cell subsets and theirsignature cytokines in autoimmune and inflammatory diseases. Cytokine.2015;74(1):5–17.8. Chau CH, Rixe O, McLeod H, Figg WD. Validation of analytic methods forbiomarkers used in drug development. Clin Cancer Res. 2008;14(19):5967–76.9. Lee JW, Devanarayan V, Barrett YC, Weiner R, Allinson J, Fountain S, Keller S,Weinryb I, Green M, Duan L, et al. Fit-for-purpose method development andvalidation for successful biomarker measurement. Pharm Res. 2006;23(2):312–28.10. Barnard RM. Flow cytometry: a flexible tool for biomarker research.Bioanalysis. 2012;4(20):2471–83.11. Wu DY, Patti-Diaz L, Hill CG. Development and validation of flow cytometrymethods for pharmacodynamic clinical biomarkers. Bioanalysis. 2010;2(9):1617–26.12. NC dP, Wang K, Wadhwa PD, Culhane JF, Nelson EL. Validation andcomparison of luminex multiplex cytokine analysis kits with ELISA:determinations of a panel of nine cytokines in clinical sample culturesupernatants. J Reprod Immunol. 2005;66(2):175–91.Submit your next manuscript to BioMed Centraland we will help you at every step: We accept pre-submission inquiries Our selector tool helps you to find the most relevant journal We provide round the clock customer support Convenient online submission Thorough peer review Inclusion in PubMed and all major indexing services Maximum visibility for your researchSubmit your manuscript atwww.biomedcentral.com/submit
assays performed on a BD Accuri C6 flow cytometer. Results: IL-17A response to LPS was limited but sustained, and the response for the remaining cytokines were early and transient; dexamethasone reduced expression of all 7 cytokines. TNF-α and IL-6 levels were similar across both assays, and IL-4 levels were generally very low.