Transcription
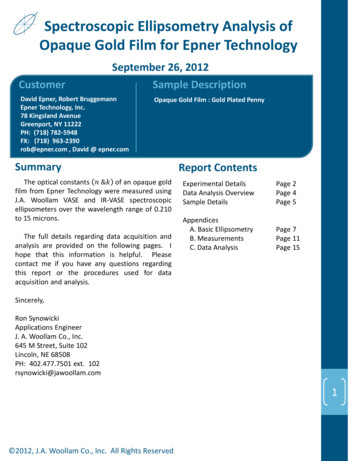
Spectroscopic Ellipsometry Analysis ofOpaque Gold Film for Epner TechnologyCustomerSeptember 26, 2012Sample DescriptionDavid Epner, Robert BruggemannEpner Technology, Inc.78 Kingsland AvenueGreenport, NY 11222PH: (718) 782-5948FX: (718) 963-2390rob@epner.com , David @ lm : GoldPlatedPennyReference Sample: Al2O3 on GaAsSample 1: DP5973, Al2O3/TiO2/Al2O3 StackSample 2: DP5972, Al2O3/TiO2/Al2O3 StackSample 3: DP5659, Al2O3/TiO2/Al2O3 StackSample 4: Y4613, Al2O3/TiO2/Al2O3 StackSummaryThe optical constants 𝑛 &𝑘 of an opaque goldfilm from Epner Technology were measured usingJ.A. Woollam VASE and IR-VASE spectroscopicellipsometers over the wavelength range of 0.210to 15 microns.The full details regarding data acquisition andanalysis are provided on the following pages. Ihope that this information is helpful. Pleasecontact me if you have any questions regardingthis report or the procedures used for dataacquisition and analysis.Report ContentsExperimental DetailsData Analysis OverviewSample DetailsPage 2Page 4Page 5AppendicesA. Basic EllipsometryB. MeasurementsC. Data AnalysisPage 7Page 11Page 15Sincerely,Ron SynowickiApplications EngineerJ. A. Woollam Co., Inc.645 M Street, Suite 102Lincoln, NE 68508PH: 402.477.7501 ext. 102rsynowicki@jawoollam.com1 2012, J.A. Woollam Co., Inc. All Rights Reserved
Experimental MeasurementsV-VASE The VASE variable angle spectroscopicellipsometer was used for measurementsin this report. It features computercontrolled wavelength and angle ofincidence selection.A Xenon lampsupplies light from the ultraviolet (UV) tothe near infrared (NIR).Individualwavelengths are selected with a doublechamber monochromator.A stackedSi/InGaAs detector is used from 190nm to2500nm and a InAs detector is used from2500 nm – 3300 nm. The VASE uses arotating analyzer ellipsometer (RAE)configuration with the addition of ourpatented AutoRetarder .System InformationInstrumentV-VASEReference Sample: GaAs SubstrateReferenceSample:GaAs3 onnmWavelengthRangeAl2O192to 3300 nmSample1:DP5973,AlO/TiOO3 Stack2(1923 nm2/Al(Analysis Range)to 23300nm)Sample 2: DP5972, Al2O3/TiO2/Al2O3 StackSample 3: DP5659, Al2O3/TiO2/Al2O3 StackAngles 4:of Incidenceto 75 by 10 SampleY4613, Al2O55 3/TiO2/Al2O3 StackMeasurement Type Spectroscopic EllipsometrySoftwareWVASE32 v. 3.770TheAutoRetarderchangesthepolarization state of light prior to thesample to maximize measurementaccuracy. In addition, it allows advancedmeasurements of depolarization, Muellermatrix elements, and generalizedellipsometry (for anisotropic materials).Spectroscopic EllipsometryEllipsometry uses polarized light to characterizethin film and bulk materials. A change inpolarization is measured after reflecting lightfrom the surface.This measurement isexpressed as two values: Psi and Delta, whichare related to the ratio of Fresnel reflectioncoefficients, Rp and Rs, for p- and s- polarizedlight, respectively. The Psi-Delta data are analyzed usingregression methods to determine propertiesabout the sample of interest. These propertiescan include film thickness and layer opticalconstants.A complete description of the Analysisprocedures used in this report will be discussedin the next section.RP tan( )e i RS 2012, J.A. Woollam Co., Inc. All Rights Reserved2
Experimental MeasurementsIR-VASE The IR-VASE variable angle spectroscopicellipsometer for the infrared was used formeasurements in this report. The IR-VASEcollects data from about 1.7mm – 33mmbased on a Fourier-transform spectrometer.The angle of incidence is computer controlledfrom 30 to 90 . The IR-VASE uses ourpatented rotating compensator ellipsometer(RCE) configuration for fast, accuratemeasurements.System InformationInstrumentIR-VASE1.7Substrateµm to 33 µmWavelengthRange GaAsReference Sample:(AnalysisReferenceRange)Sample: Al2(1.7O3 onGaAsµmto 20 µm)Sample 1: DP5973, Al2O3/TiO2/Al2O3 StackSampleof2:IncidenceDP5972, Al55 /TiOAngles75 by2O10 2O3to2/Al3 StackSample 3: DP5659, Al2O3/TiO2/Al2O3 StackMeasurementTypeAl SpectroscopicEllipsometrySample 4: Y4613,2O3/TiO2/Al2O3 StackSoftwareWVASE32 v. 3.770Spectroscopic EllipsometryEllipsometry uses polarized light tocharacterize thin film and bulk materials. Achange in polarization is measured afterreflecting light from the surface.Thismeasurement is expressed as two values: Psiand Delta, which are related to the ratio ofFresnel reflection coefficients, Rp and Rs, forp- and s- polarized light, respectively. A complete description of the Analysis proceduresused in this report will be discussed in the nextsection.RP tan( )e i RSThe Psi-Delta data are analyzed usingregression methods (see flowchart) todetermine properties about the sample ofinterest. These properties can include filmthickness and layer optical constants. 2012, J.A. Woollam Co., Inc. All Rights Reserved3
Data Analysis: SoftwareWVASE32 SoftwareWVASE32 is a comprehensive ellipsometric dataanalysis program. It provides extensive modelingoptions along with state of the art mathematicalfitting algorithms.Reference Sample: GaAs SubstrateReference Sample: Al2O3 on GaAs Experimental: WVASE32 software controls Sample 1: DP5973, Al2O3/TiO2/Al2O3 Stack ,system calibration and data collection on VASESample2: DP5972, Al2O3/TiO2/Al2O3 Stack VUV-VASE , and M-2000 ellipsometers.Sample 3: DP5659, Al2O3/TiO2/Al2O3 StackMeasurements can include spectroscopicSample 4: Y4613, Al2O3/TiO2/Al2O3 Stackellipsometry, generalized (anisotropic)ellipsometry, Mueller-matrix, and intensity-basedreflection and transmission.Modeling: WVASE32 comes with extensivemodeling capabilities. This starts with a library ofoptical constants for over 500 different materials.Then, customized material files can be createdusing the widest variety of dispersion equationsavailable: CauchySellmeierLorentzGaussianHarmonic Tauc-LorentzCody-LorentzPSEMITanguyTOLOData Analysis: The regression capabilities ofWVASE32 are extremely powerful. The NormalFit is based on the Levenberg-Marquardtalgorithm to reduce the least-squares differencebetween experimental and model-generateddata. Advanced regression includes Random andGrid Global Fitting. Results can be tested withMonte-Carlo and Uniqueness Simulations. 2012, J.A. Woollam Co., Inc. All Rights Reserved4
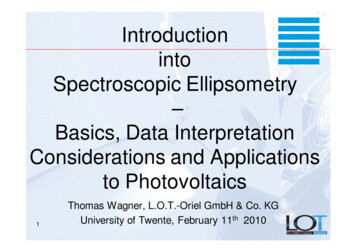
Opaque Gold Film: UV-VIS-NIR Results VASE and IR-VASE data were fit simultaneously over the spectral range 0.210 to 15 microns. The plated Gold film was assumed to be fully opaque an infinitely thick. The Gold optical constants n & k were fit to a series of mathmatical dispersion functionsdescribed in Appendices C-10 through C-14. Two Sellmeier, 1 Drude , 4 Lorentz, 1 Tauc-Lorentz, and 5 Gaussian dispersion functionswere used to describe the optical constants over the measured spectral range.Model:Fit Results:0 au-plated-genoscMSE 1.01 mm1.5305 0.004060.64606 0.006390.49462 0.00531.2663 0.003470.56153 0.03061.1559 0.01941.5429 0.021924.139 0.9763146.9 21.31423.4 58.9864.44 7.391065.5 20.40.57129 0.007620.52915 0.002742.4364 0.003130.93111 0.00430.10753 0.0171Experimental Data and Corresponding FitsGenerated and ExperimentalGenerated and Experimental4518015035 in degrees in degrees40Model FitExpE65 ExpE70 ExpE75 30250.012090Model FitExpE65 ExpE70 ExpE75 600.51.01.5Wavelength (µm)2.0300.02.50.51.01.5Wavelength (µm)Psi, Degrees2.02.5Delta, DegreesGold Optical Constants: avelength (µm)Optical Constants n & k 2012, J.A. Woollam Co., Inc. All Rights Reserved2.002.5Extinction Coefficient ' k'Index of Refraction 'n'1.85
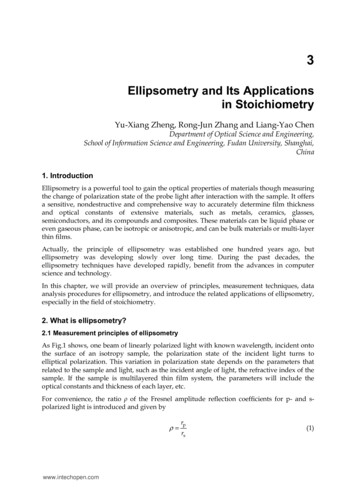
Opaque Gold Film: IR-VASE Results VASE and IR-VASE data were fit simultaneously over the spectral range 0.210 to 15 microns. The plated Gold film was assumed to be fully opaque an infinitely thick. The Gold optical constants n & k were fit to a series of mathmatical dispersion functionsdescribed in Appendices C-10 through C-14. Two Sellmeier, 1 Drude , 4 Lorentz, 1 Tauc-Lorentz, and 5 Gaussian dispersion functionswere used to describe the optical constants over the measured spectral range.Model:Fit Results:0 au-plated-genoscMSE 1.01 mm1.5305 0.004060.64606 0.006390.49462 0.00531.2663 0.003470.56153 0.03061.1559 0.01941.5429 0.021924.139 0.9763146.9 21.31423.4 58.9864.44 7.391065.5 20.40.57129 0.007620.52915 0.002742.4364 0.003130.93111 0.00430.10753 0.0171Experimental Data and Corresponding FitsGenerated and ExperimentalGenerated and Experimental44.818017544.6 in degrees in degrees17044.444.2Model FitExpE65 ExpE70 ExpE75 44.043.803165160Model FitExpE65 ExpE70 ExpE75 15515069Wavelength (µm)12151450369Wavelength (µm)Psi, Degrees1215Delta, DegreesGold Optical Constants: Infrared8012609406nk300369Wavelength (µm)Optical Constants n & k 2012, J.A. Woollam Co., Inc. All Rights Reserved1220015Extinction Coefficient ' k'Index of Refraction 'n'156
Appendix A: Basic EllipsometryA-1: Ellipsometry IntroductionEllipsometry uses polarized light to characterize thin film and bulk materials. A change inpolarization is measured after reflecting light from the surface. Thin film thickness (t) andoptical constants (n, k) are derived from the measurement. Information is obtained fromeach layer interacting with the measurement. Light returning from the film–substrateinterface interferes with the surface reflection to provide layer information (figure to right).n 0n 1t1n 2An ellipsometry measurement is a description of the change in polarization (figure to left)as polarized light is reflected from a sample surface. It is expressed as two parameters foreach wavelength-angle combination: Psi (Ψ) and Delta (Δ). These values can be relatedto the ratio of complex Fresnel reflection coefficients, rp and rs, for p- and s- polarizedlight, respectively.rP tan( )ei rSEllipsometry offers three main advantages over simple intensity-based reflection ortransmission measurements:1. Measurement is defined by a ratio, thus ellipsometry is not sensitive to changes inabsolute intensity of measurement beam (i.e. the sample becomes the ‘reference’for the measurement).2. Phase information (from Δ) provides enhanced sensitivity to ultra-thin films, evendown to sub-nm level.3. Ellipsometry measures 2 values (Ψ and Δ) at each wavelength, doubling theinformation content compared to an intensity reflection or transmissionmeasurement. For further reading:1. H. Fujiwara, Spectroscopic Ellipsometry Principles and Applications, West Sussex, John Wiley & Sons, 2007.2. H.G. Tompkins and W. A. McGahan, Spectroscopic Ellipsometry and Reflectometry, New York: Wiley, 1999.3. H.G. Tompkins and E.A. Irene (eds), Handbook of Ellipsometry, New York: William Andrew, 2005. 2012, J.A. Woollam Co., Inc. All Rights Reserved7
Appendix A: Basic EllipsometryA-2: Data Analysis OverviewData analysis is a very important part of spectroscopic ellipsometry (SE): without dataanalysis, SE only measures the ellipsometry parameters Psi and Delta versus wavelength.Data analysis is used to determine optical constants, layer thickness, and other materialproperties. The basic steps of this approach include:1. SE data is measured on the sample.2. A model describes the measured sample using layers for each material. Thickness andoptical constants (n and k) describe each layer over the measured wavelength range,with estimates for any unknown properties.3. The unknown properties of the sample are defined as model “fit” parameters. Thesoftware automatically adjusts these parameters to improve the agreement betweenthe measured and model-generated data.4. The results of the fit are evaluated. If results are not acceptable, the process can berepeated with a new model or different “fit” parameters until the best description isfound.A-3: Optical PropertiesOptical constants of isotropic materials can be described using two parameters. These valuescharacterize how a material responds to excitation by light of a given wavelength. Onerepresentation is the complex index of refraction, 𝑛 𝑛 𝑖𝑘, where the real part n is theindex and the imaginary part, k, is the extinction coefficient. The index, n, describes phasevelocity of light in a material compared to propagation in vacuum. The figure below (on left)shows light traveling through different media, where the index of air, Film 1, and Film 2 isn 1, 4, and 2, respectively. Film 1 is also absorbing, as demonstrated by the exponentialdecrease in amplitude as the film travels through. The absorption of light is governed by theextinction coefficient, k. These quantities also determine the amount of light reflected andtransmitted at an interface between two materials. A large index difference will reflect morelight at the interface.Film 1Film 224601250400 1 2-1220-24-360.0330 2 1Air100.10.313Photon Energy – eV (log scale)010Alternately, the optical constants can be described using the complex dielectric constant,given as 𝜀. The complex dielectric constant is related to the complex index of refraction by𝜀 𝑛2 . Both are commonly encountered in the literature.The optical constants will vary at different wavelengths, as shown for TiO2 in the figureabove (on right). The absorption, given by e2, will occur due to different mechanisms in thematerial, such as phonon vibration or electronic transitions. 2012, J.A. Woollam Co., Inc. All Rights Reserved8
Appendix B: Measurement DetailsB-1: Standard Spectroscopic EllipsometryTraditional ellipsometry measures the relative change in polarization due toreflection/transmission from a sample as,𝑟𝑝𝜌 tan 𝜓 𝑒 𝑖Δ𝑟𝑠where the sample is described using only the diagonal elements of a 2 X 2 Jones matrix.𝐸𝑝𝐸𝑠𝑜𝑢𝑡𝑟𝑝 00𝑟𝑠𝐸𝑝𝐸𝑠𝑖𝑛This definition is valid for isotropic samples and certain orientations of uniaxial anisotropy.Thus, a standard ellipsometry measurement does not involve any cross-coupling betweenp- and s- polarization directions. The amplitude ratio, tan(Y) and the relative phasedifference, D, are measured by comparing the effects of light in p- and s- directionsrespectively. In this manner, the measurement is self-referencing and can be highlyaccurate.B-2: Intensity MeasurementIn addition to ellipsometry measurements, which measure the polarization change, mostellipsometers can also collect intensity-based (spectrophotometric) measurements. This caninclude polarized or cross-polarized reflectance and transmittance data. As thesemeasurements require accurate intensity values, they are generally less accurate thanellipsometry measurements, which are self-referencing. The tangent of Psi is related to theamplitude ratio of Fresnel reflection or transmission coefficients. These are in-turn equal tothe square root of the Reflectance (R) or Transmittance (T) intensity measurements.𝑟𝑝tan 𝜓 𝑟𝑠 2012, J.A. Woollam Co., Inc. All Rights Reserved𝑅𝑝𝑅𝑠9
Appendix B: Measurement DetailsB-3: Wavelength UnitsLight can be described in various units: wavelength (l), photon energy (E), and wavenumber(K). Wavelength is the distance between adjacent peaks of an electromagnetic wave,commonly given in nanometers (nm) or microns (mm). Wavenumber refers to the numberof waves in a length of one centimeter, with units of reciprocal centimeters (cm-1).1240107λ𝑛𝑚 λ𝜇𝑚 1000 𝐸𝑒𝑉𝐾𝑐𝑚 1B-4: Angle of IncidenceEllipsometry measurements are acquired at oblique angles of incidence, with typical anglesbetween 45 and 80 relative to the sample normal. At these angles, there is highsensitivity to the differentiation between p- and s- polarized light. If polarized light reflectsfrom an isotropic material, the s-polarized light will increase with angle of incidence, whilethe p-polarized light goes through a minimum at the Brewster angle before climbing backup. This is shown in the following figure for a coated glass slide. The reflected intensitiesare shown for both p- and s- polarized light. The ellipsometry parameters (Ψ and Δ) aredefined from the complex ratio of Rp and Rs given the values shown in the correspondingfigure. Notice, the largest changes occur at oblique angles (in this case near 65 ).1.0RpRs in degrees400.60.40.20.002001503010020 5010204060Angle of Incidence ( )8010000204060Angle of Incidence ( )800100NOTE: With modern ellipsometers, it is not critical to measure at the Brewster angle. AllWoollam ellipsometers include a compensator (see B-6), which allows precisemeasurements over a wide range of angles. However, the change in polarization would benegligible at angles near normal incidence. Thus, it is still important to use oblique anglesfor common SE applications. 2012, J.A. Woollam Co., Inc. All Rights Reserved in degreesReflection0.85010
Appendix B: Measurement DetailsB-5: Spectroscopic Ellipsometry or Single Wavelength?A single wavelength ellipsometer measures two pieces of information that describeamplitude and phase changes due to the sample (Ψ and Δ) for that single wavelength. Thisinformation can be used to determine a maximum of 2 unknown sample properties: n andk of a bare substrate; n and t for a transparent film on known substrate, etc. Spectroscopicellipsometry measures two values at every wavelength. Thus, with 100 measuredwavelengths, there are 200 data points. All of this information can be used to solvematerial questions. Even in the simple case of a transparent layer on known substrate, thisis equivalent to using 100 separate single-wavelength ellipsometers to get the one uniqueanswer. However, the benefits are far more reaching, because each wavelength probes thesame sample with different light frequency. If one wavelength is insensitive to the filmbecause of poor data response, the other 99 wavelengths can help insure a correctresponse. In addition to possible insensitive regions, the measurement from a singlewavelength will repeat itself (for transparent film). This introduces multiple solutions forthe exact same data point (see figure below- left). This problem is solved withspectroscopic measurements. Even though the data at one wavelength may match forvarious possible solutions, the surrounding wavelength data will uniquely determine thecorrect answer (see figure below-right).121008 in degreesReal(rho)10Full Thickness Cycle6450, 276, 502nm 280Data match at 500 nm6050 nm276 nm502 01400Wavelength (nm)B-6: Ellipsometry with an adjustable Retarder or CompensatorMany ellipsometer types utilize polarizers for their measurement: rotating analyzer (RAE)and Rotating Polarizer (RPE) in particular. These ellipsometers are very simple to constructand can be very accurate. However, they have known limitations:1. Can’t determine the ‘handedness’ of Δ.2. Precision and accuracy of measured Δ is poor when Δ is near 0 or 180 .These limitations are inconsequential for many applications, but limit the accuratemeasurement of some difficult samples. We eliminate these problems by simply adding acompensator to the beam path (either before or after the sample). Our standardinstruments all incorporate patented compensator technology to acquire the highestaccuracy measurements. VASE and VUV-VASE: RAE with AutoRetarder M-2000, alpha-SE and IR-VASE: Rotating Compensator Ellipsometer (RCE) 2012, J.A. Woollam Co., Inc. All Rights Reserved11
Appendix B: Measurement DetailsB-7: DepolarizationEllipsometry measurements use polarized light. If the sample is isotropic and ideal, thismeasurement can be described by two parameters: Ψ and Δ. However, if a sample ispartially depolarizing, two parameters are insufficient to fully describe the ellipsometrymeasurement. The addition of an adjustable or rotating compensator (See B-6) permitsseparate measurements of three quantities, reported as: Ψ, Δ, and %depolarization.Depolarization of the light beam can occur with non-uniform layer thicknesses, patternedfilms, finite spectral bandwidth, finite angular bandwidth, and backside effects fromtransparent substrates (see B-8). Fortunately, the effects of these non-idealities onstandard ellipsometry data can be quantified by measuring (and modeling) thedepolarization. This allows separation of the non-idealities from thin film model to insurethe correct thickness and optical constants are determined.B-8: Transparent SubstratesEllipsometry measurements are commonly taken on transparent substrates. In this case,the light reaching the detector may include reflections from the back-side of the substrate(bottom left figure). Substrates are generally thicker than the coherence length for the lightsource of the ellipsometer. Thus, the returning light does not interfere in a coherent sense,as its phase information is lost compared to the reflections from the top-surface coatings.This “incoherent” summation of light beams can be handled mathematically. In addition,there is generally some depolarization of the measurement.If the depolarization is measured (see B-7), the amount oflight returning from the back-side is easily quantified.Back-side reflections are typically undesirable whencharacterizing surface films. This is especially true if thesubstrate is anisotropic. To prevent back-side reflectionsthe surface can be roughened to scatter light (bottom rightfigure). In other cases, translucent tape (figure right) appliedto the backside of substrate is adequate to suppress the backside reflections*.12*R.A. Synowicki, “Suppression of backside reflections from transparent substrates”, Phys.Stat. Sol. (c) 5, (2008) 1085-1088. 2012, J.A. Woollam Co., Inc. All Rights Reserved
Appendix B: Measurement DetailsB-9: Generalized EllipsometryGeneralized ellipsometry involves all four components of the Jones matrix. R pp Ep E s out R psRsp E p Rss E s inWith this description of the sample, the experimental data are presented as three sets of Ψ,Δ pairs.AnEApsAsp R ppRss tan( )e i ps R psR pp tan( ps )ei ps sp RspRss tan( sp )ei spThe off-diagonal elements of the Jones matrix (Rsp and Rps) will be zero for isotropicsamples and special orientations of anisotropic samples. Thus, generalized ellipsometry istypically used for the characterization of anisotropic materials.B-10: Retardation MeasurementsEllipsometers measure the phase change of light. For retardance measurements, lighttransmits through the substrate, as shown in the figure below. Two orthogonal waves enterthe birefringent material in-phase. A phase change, d, is induced by the material as theindex of refraction (and thus phase velocity) differs along the fast- and slow-axis.Generalized ellipsometry measurements (see B-9) can determine the fast-axis orientationand provide a correct measure of retardance.13 2012, J.A. Woollam Co., Inc. All Rights Reserved
Appendix B: Measurement DetailsB-11: Mueller-Matrix EllipsometryStandard ellipsometry measurements assume 1) the measurement beam remains 100%polarized and 2) the off-diagonal elements are zero (no cross-coupling between p- and spolarizations). These assumptions are appropriate for a large variety of materialscharacterization problems. If assumption 1 is not valid, it is often possible to use anadvanced ellipsometer design and measure the amount of depolarization (Appendix B-7). Ifthe sample is anisotropic, assumption 2 may not be valid, which often requires generalizedellipsometry measurements (See Appendix B-9). In the rare case where both assumptionsfail at the same time (i.e. the sample is both depolarizing and anisotropic), the moregeneral Mueller-matrix measurement is necessary. Mueller-matrix ellipsometry replaces thestandard 2x2 Jones matrix description of the sample with a more general 4x4 matrix. TheMueller-matrix maps the Stokes parameters for incoming to outgoing light, using thefollowing notation. S0 M 11 M 12 S MM 22 1 21 S2 M 31 M 32 S3 OUT M 41 M 42M 13M 23M 33M 43M 14 S0 M 24 S1 M 34 S 2 M 44 S3 INTo determine all 16 elements of the Mueller-matrix would require a compensator beforeand after the sample. Fortunately, there is often symmetry within the Mueller-matrixelements that allows a complete characterization of difficult samples without measurementof all 16 elements.14 2012, J.A. Woollam Co., Inc. All Rights Reserved
Appendix C: Modeling and Data AnalysisC-1: Modeling OverviewAs described in Appendix A-3, it is important to analyze the data (Ψ and Δ) to determineoptical constants, layer thickness, and other material properties. A model describes themeasured sample using layers for each material. Thickness and optical constants (n and k)describe each layer over the measured wavelength range, with estimates for any unknownproperties. An example model is shown below with a silicon substrate (layer 0) and twocoatings above (layer 1 and 2).The unknown properties of the sample are defined as model “fit” parameters. Thesoftware automatically adjusts these parameters to improve the agreement between themeasured and model-generated data. This agreement is quantified via the Mean SquaredError (See Appendix C-2).C-2: Mean Squared ErrorThe MSE describes the difference between experimental data and model predicted data:1MSE 2N M mod exp 2 mod exp 2 1ii i i 2 expexp 2N M ,i i 1 ,i NThe subscript “i” identifies each unique wavelength and angle of incidence, is thestandard deviation, N is the total number of (Ψ, Δ) pairs, M is the number of “fitparameters”, and “exp” and “mod” signify experimental and calculated values. Anothercommon estimator, chi-square ( 2), is also �local”minima10050000.20.40.60.811.2Film Thickness ( m)The MSE compares the merit of different models to help find a physical sample descriptionthat best matches the experimental measurement. 2012, J.A. Woollam Co., Inc. All Rights Reserved15
Appendix C: Modeling and Data AnalysisC-3: Silicon and SiO2Although the optical constants for most materials are variable, crystalline substrates canhave very consistent properties. Silicon is one such material (at least in the ultraviolet tonear infrared wavelength region). Thus, the silicon optical constants can be modeled using“known” values from the published literature. The values we choose were developed byHerzinger et al*. This reference also provides excellent values for thermally grown SiO 2films. There is a thin interface between the silicon substrate and the SiO 2 layer, which isalso described in this reference.*C. M. Herzinger, B. Johs, W. A. McGahan, J. A. Woollam, and W. Paulson, “EllipsometricDetermination of Optical Constants for Silicon and Thermally Grown Silicon Dioxide via aMulti-sample, Multi-wavelength, Multi-angle Investigation”, J. Appl. Phys., 83 (1998) 33233336.C-4: Effective Medium ApproximationThe effective medium approximation (EMA) allows two or three materials to combine andform an “effective” mixed layer. Physical interpretation of EMA theory involves smallparticles of one material suspended within a host material. Under this approximation, theoptical constants can be mixed to satisfy electromagnetic equations. In practice, the EMA iscommonly used to describe surface or interfacial roughness, porous layers, andpolycrystalline materials.For further reading:1. D.E. Aspnes, Thin Solid Films 89 (1982) 249.2. H. G. Tompkins, A User’s Guide to Ellipsometry, Boston: Academic Press, (1993) 246-251.16 2012, J.A. Woollam Co., Inc. All Rights Reserved
Appendix C: Modeling and Data AnalysisC-5: Surface or Interfacial RoughnessSurface roughness can be described using the Bruggeman effective medium approximation(EMA). This model mixes the optical constants of the surface material with void (air) in a50:50 ratio. The approximation is valid when features are less than 1/10 th the wavelengthof probe light. Larger roughness may scatter and depolarize light. Therefore, thick layersare not modeled correctly with an EMA. In practice, roughness is represented by a single,planar layer, with thickness varying to provide the best approximation of the surfaceproperties.RoughSurfaceRoughSurfaceEMA approximationEMAapproximationtThe EMA can also be used to mix two materials to approximate a rough interface. A 50:50mixture of the material below and above the interface is assumed. This layer is used whenthe interfacial region is very thin – less than 1/10th the wavelength of the probe light.RoughRoughInterfaceInterfaceEMA approximationapproximationEMAtC-6: Index GradingIf the index of refraction varies through a film (with depth), it may affect the ellipsometrymeasurement. Although it is difficult to describe the exact depth profile, the ellipsometercan estimate the “trend”. Ellipsometry theory works with planar layers, so the indexvariation must be approximated as a series of “slabs” with varying index. The index at thesurface can be larger or smaller than the index at the bottom of the film.Graded ModelDepth Profile of Optical Constants at 1000nm2.0171.81.6 2012, J.A. Woollam Co., Inc. All Rights ReservedGraded FilmRoughness2.2Substrate2.4Index of refraction, nIndex Variation1000300050007000Distance from Substrate in Å9000
Appendix C: Modeling and Data AnalysisC-7: Thickness Non-UniformityWhen a film varies within the measured spot, the ellipsometer measures an averagethickness. Variation also “rounds” any sharp features in the experimental data. The effectscaused by thickness non-uniformity are calculated using a series of slightly differentthicknesses to correctly interpret the data. Non-uniformity can also introducedepolarization, so this can help quantify the thickness non-uniformity if the measurementincludes depolarization (See Appendix B-6).C-8: Pseudo-Optical ConstantsIf a material is uniform, isotropic, optically thick (i.e., negligible reflection from thebackside) with a smooth, abrupt surface; the optical constants can b
A-1: Ellipsometry Introduction Ellipsometry uses polarized light to characterize thin film and bulk materials. A change in polarization is measured after reflecting light from the surface. Thin film thickness (t) and optical constants (n, k) are derived from the measurement. Information is o