Transcription
Note: This is a preprint of paper being submitted for publication. Contents of this paper shouldnot be quoted nor referred to without permission ot the author(s).The Calculation of Thin Film Parameters fromSpectroscopic Ellipsometry DataG. E. Jellison, Jr.Solid State DivisionOak Ridge National LaboratoryOak Ridge, TN 37830"The submitted manuscript has been authoredby a contractor of the US. Government undercontract DE-AC05-960R22464. Accordingly,the U.S. Government retains a nonexclusive,royalty-free license to publish or reproduce thepublished form of this contribution. or allowothers to do so, for U.S.Government purposes."February 1996Prepared bySolid State DivisionOak Ridge National LaboratoryP.O. Box 2008Oak Ridge, Tennessee 3783 1-6056managed byLOCKHEED MARTIN ENERGY SYSTEMS, INC.for theU.S. DEPARTMENT OF ENERGYunder contract DE-AC05-960R22464
DISCLAIMERPortions of this document may be illegiblein electronic image products. Images areproduced from the best available originaldocument.
The Calculation of Thin Film Parameters fromSpectroscopic Ellipsometry DataG. E. Jellison, Jr.Solid State DivisionOak Ridge National LaboratoryOak Ridge, TN 37830AbstractSpectroscopic ellipsometry (SE) has proven to be a very powerful diagnostic forthin film characterization, but the results of SE experiments must first be comparedwith calculations to determine thin film parameters such as film thickness andoptical functions. This process requires 4 steps: (1)The quantities measured must bespecified and the equivalent calculated parameters identified. (2) The film structuremust be modeled, where the number of films is specified and certain characteristicsof each layer specified, such as whether or not the film is isotropic or anisotropic,homogeneous or graded. (3) The optical functions of each layer must be specified orparameterized. (4)The data must be compared with the calculated spectra, where aquantifiable figure of merit is used for the comparison. The last step is particularlyimportant because without it, no "goodness of fit" parameter is calculated and onedoes not know whether or not the calculated spectrum fits the data.DISCLAIMERThis report was prepared as an account of work sponsored by an agency of the United StatesGovernment. Neither the United States Government nor any agency thcreof, nor any of theiremployees, makes any warranty, express or implied, or assumes any legal liability or responsibility for the accuracy, completeness, or usefulness of any information, apparatus, product, orprocess disclosed, or represents that its use would not infringe privately owned rights. Reference herein to any specific commercial product, process, or service by trade name, trademark,manufacturer, or otherwise does not necessarily constitute or imply its endorsement, recommendation, or favoring by the United States Government or any agency thereof. The viewsand opinions of authors expressed herein do not necessarily state or reflect those of theUnited States Government or any agency thereof.1
I.IntroductionSpectroscopic ellipsometry (SE) has become increasingly important as a thinfilm diagnostic tool over the last decade [l]. Ellipsometry is a polarization-sensitiveoptical reflection technique [2], generally in the near ultraviolet-near infraredwavelength region, which means that it is non-destructive, and can be used inhigh-pressure and magnetic environments, situations where electron diagnosticscannot be used. However, the data obtained directly from SE measurements isusually not interesting; usable thin film parameters, such as film thickness, surfaceroughness, optical functions of the films, etc., must be obtained from the data bymodel calculations compared with the data. This is a common exercise in scienceand engineering, and as such is well understood.This interpretation of SE data requires 4 steps (Ref. 3 discussed the last three).The first step is to determine the parameters that are measured. This will depend onthe SE instrument used, on the configuration of optical elements within theinstrument, and on the characteristics of the sample and other perturbing optics,such and vacuum chamber windows. The second step is to specify the way in whichthe Fresnel Reflection coefficients (FRCs) are calculated. If the sample consists ofseveral homogeneous layers of isotropic materials, simple 2 x 2 matrix methods areappropriate; if one or more of the films are inhomogeneous (where the opticalfunctions vary with film thickness) or anisotropic, more complicated 2 x 2 matricesor 4 x 4 matrices must be used. The third step is to specify the optical functions ofeach layer; this can be a specification of a data base spectrum, a parameterization ofthe optical functions, or a combination of the two. The fourth step is the comparison of the calculated Fresnel reflection coefficients with the experimentalparameters; this is the critical step in that it determines the confidence one hasconcerning whether or not the calculation actually fits the data. In this paper, eachof these four steps are reviewed.2
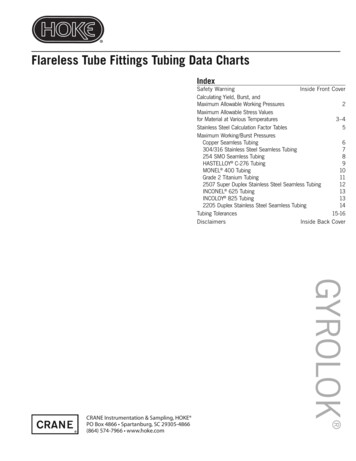
11. Measured ParametersA general schematic representation of a generalized SE instrument [2,4] isshown in Fig. 1. The light source produces a collimated light beam, which passesthrough a polarization state generator (PSG), reflects off the sample (S), passesthrough a polarization state detector (PSD) and is then detected.Themonochromator can be either before the light enters the PSG or after it exits the PSD.The PSG and the PSD each consist of polarizers and/or compensating opticalelements, and result in changing the ellipticity of the light polarization. The PSGtakes the unpolarized light from the source and elliptically polarizes it, while thePSG takes the elliptically polarized light reflecting from S and changes its ellipticity.The generalized sample S contains the actual specimen, but also any perturbationson the light polarization (such as vacuum chamber windows) between the specimenand the PSD or after the specimen and before the PSD.Since the PSG, S, and PSD are not in general ideal, we must take into accountthe possibility that each of these elements are depolarizing; therefore, the Stokesrepresentation of polarized light must be used. In this case, the Stokes vector isdefined as [Z].s I so II s1 II s2 II 3I I ItotalI I.- I Ix/4-Ln/4!. I - 111IIJThe elements of the Stokes vector are all intensities, and therefore real. The So termis the total intensity, Si is the intensity difference of the light polarized in thex-direction minus that in the y-direction,S2is the intensity difference of the lightpolarized in the 45" direction minus that in the -45" direction, and S3 is theintensity difference of right circular polarized light minus left circular polarizedlight. If the light beam is totally polarized, then
If the light beam is linearly polarized, then S3 O; elliptically polarized light will haveS3 O.Since the polarization of the input and exit light beam is expressed in terms ofStokes vectors, the generalized sample matrix is a 4 x 4 Mueller matrix, whichconsists of real numbers. For the case of an isotropic sample with no polarizationperturbing optical elements, the Mueller matrix is simply [2].M IIIm00 m01 m02m10mllm12m20 m21 m22m30 m3l m32m03 Imi31m23 Im33 J ( 1 -NI -N 1I o 0I o00 1o o I,c S Io -s c J(3)where the parameters N, S, and C will be defined later. Perturbations due towindows and other optical elements between the PSG and the specimen, andbetween the Specimen and the PSD can be incorporated into the generalized sampleMueller matrix by pre- and post- multiplying M with a correction matrix.The intensity of the light reaching the detector is given byI PSD *M*PSG ,(4)where PSD is the row vector representing the change in light polarization due to thePSD and PSG is the column vector representing polarization created by the PSG.We can see immediately the limitations of ellipsometers based only on linearpolarization optical elements. If both the PSG and the PSD contain no compensatingoptical elements, then only linearly polarized light is generated and detected;therefore S3 O for both the PSG and the PSD and neither the 4th row or 4th columnof the sample Mueller matrix is accessible to measurement and the intensity of light4
incident upon the detector is not a function of the S parameter. On the other hand,if either the PSG or the PSD contains a compensating optical element (such as aquarter wave plate or a photoelastic modulator), then either the 4th row or 4thcolumn of the sample Mueller matrix is now accessible to measurement and the Sparameter may be determined. If the PSD measures both polarizations (such as withthe 2-channel spectroscopic polarization modulation ellipsometer [5]) then N, S, andC can be measured simultaneously.Most SE instruments vary the polarization state as a function of time. Forexample, a rotating polarizer instrument will have as its PSG and PSD vectorsThis results in the intensity reaching the detector being given byI 1 - N COS (28,) COS (2Ot) ( COS (28,) - N) sin (20t) C sin (28,) .The interesting sample parameters measured are N and C, and are given as Fouriercoefficients of the intensity; the S term is not included in the intensity. Similarexpressions can easily be obtained for many other ellipsometers.The important result of this is that the measured quantities from mostspectroscopic ellipsometers are Fourier coefficients, which then can be related toelements of the sample Mueller matrix (N, S, and C for isotropic samples). Ingeneral, any ellipsometry experiment measures elements of the sample Muellermatrix S, or linear combinations of these elements.It is always possible to relate calculated Fresnel Reflection Coefficients (FRCs)to elements of the sample Mueller matrix [6] by5
whereA 0o 0o 1O-i( 1III001i1 1-1 I , J 0 1rPP rPsI rsprss11 .o JThe elements of the J matrix are the complex FRCs for light polarized in theindicated direction [p (s) is for light polarized parallel (perpendicular) to the plane ofincidence]; J" represents the complex conjugate of J and 63 represents the Kroneckerproduct. If the sample is isotropic, then the off-diagonal elements rsp and rps are 0,and the standard sample Mueller matrix sample (see Eq. 3) is obtained, wherep rpp/rss tan \v e a ye'*.N cos (2V) (l ) / (1 y2)S sin ( 2 sin) (A) 2 y sin(A) / (1 )C sin ( 2 cos) (A) 2 y cos(A) / (1 y2)As can be seen, N2 S2 C2 p2 1.If the sample under investigation is anisotropic (i.e., when the refractiveindices of the material now depend upon the direction in the material), then the offdiagonal elements of the sample Jones matrix are not generally 0, and the entiresample Mueller matrix can become populated with non-zero elements, many ofwhich are correlated. If certain symmetry conditions are met (such as that the opticaxis is in the plane of incidence or perpendicular to it) [2,7], then rsp rps 0, and thesample Mueller matrix will remain block diagonal. Furthermore, the notation thathas been developed for isotropic systems must be extended for anisotropic systems.A convenient notation, based on Eqs. 8 above, is given by:6
Note that N2 Spp2 Cpp2 Ssp2 Csp2 Sps2 Cps2 1. In this case, the sampleMueller matrix becomesM cII1-N-aps-N-aspl-aps-aspCps 51-cps -sps 5251c s p 51-csp 51ssp 52-ssp 52-s P2c-PlC Plsps 52S P2III19where%p aps 2yps / D,2 Ysp /D,P1 ( csp cps ssp spsD / 2,s/ 2,51 (C csp s Ssp) D / 2,51 (C cps Sps) DP2 (Ssp cps - csp spsD/2It;2 (C s p s - SCps) D / 2& (C Ssp -SCsp) D / 2 .IIt is always possible to associate an ideal Jones matrix calculated from the FRCs(calculated) with a Mueller matrix (measured); the inverse is not true. For example,if the sample acts as a depolarizer, then this direct association cannot be used. A verysimple case of this is when the sample consists of a thin film of non-uniform7
thickness over the illuminating spot [8]. In this case, N2 S2 C2 P2 c 1 and thedistribution of film thicknesses can be determined.111. Calculation of Fresnel Reflection CoefficientsThe calculation of the FRCs from multiple thin films is a well-understoodproblem, if all the films are isotropic and if there are no depolarization effects. Themost general method of performing this calculation is due to Abel&s[9]. In thisformulation, one defines s- and p-transfer matrices for each layer j, given byPj,p Pj,s IIIICOS bji sin bj fij /COSCOS bj ji sin bj fij COS ji sin bj COS j / f i jCOS bjI,Ji sin bj / fij COS jcos bjwhere bj 2 .n dj fij cos j / h, dj is the thickness, fij is the complex refractive index, j isthe complex angle of incidence, all in the jth layer, and h is the wavelength of light.The characteristic matrix for the entire layer stack is given byPp ll Pj,p and Ps ll Pj3.The FRCs for the total structure are then calculated usingwhere8
The subscript 0 refers to the ambient, while the subscript sub refers to the substrate.If any of the films are anisotropic, then in general rsp and rps are no longer 0and a more complicated 4 x 4 matrix formalism [10,11] must be used, where thematrix elements are complex. If rsp rps 0, either because the film is isotropic orbecause of symmetry considerations, then the 4 x 4 matrices become block-diagonal2x2 Abeles matrices.Another complication arises when the refractive indices of each layer arefunctions of depth. The most general and straight-forward way of calculating theFRCs is to break the layer into many thinner lamella, each with a constant refractiveindex, and calculate the FRCs from Eqs. 11 above. Although this procedure works inthe limit of very thin lamellae, in actuality, the number of layers required is quitelarge.In certain circumstances, it is possible to replace many lamella with a fewlamella, if it is assumed that the dielectric function (both real and imaginary part) islinear with respect to depth. If it is assumed that the dielectric function of the j-thlayer is given byE j l Ej a X,O X dj .It can be shown that [3] the Abeles matrices become:Pj,s 1- (vj2/2)(qj 2adj/3)i Vj (qj adj /2)IIwhere V j 2 n dj / I , second order inVji Vj1- (vj2/2)(qj adj/3)I .J(13b)sin 0 ,and qj Ej - 5. These calculations are performed toand first order in adj, so the thickness of each lamella must besufficiently small that second- or third-order terms can be ignored. Other forms ofthe dielectric function can be calculated using the formalism of Jacobsson [12].9
IV. Optical FunctionsThe third step in the analysis of SE data is to specify the wavelength-dependent optical functions of each of the layers. The simplest and most straightforward way is to assign the spectroscopic dielectric functions for bulk materials thathave been previously measured (see for example Ref. 13 and the associated data diskavailable from the Optical Society of America). These tabulated optical functions areusually very useful for substrates and certain types of thin films. However, theoptical functions of thin film materials tend to be different than the optical functionsof their bulk counterparts [14],so alternate ways of determining the optical functionsof the layers must also be available.One such parameterization using effective medium approximations (EMA)has been used for many years. In this case, a composite dielectric function iscalculated based on optical function spectra either in the data base or otherwisecalculated (see below).The effective medium approximation assigns anintermediate dielectric function to a material using the expressionwhereEHis the dielectric function of the host material and the sum is taken over allconstituents.There are two variations of effective medium approximation (EMA), dependingupon the choice of host materials: (1) the Maxwell Garnett (MG EMA) theory [15],where the major component is taken as the host material, and 2) the Bruggeman(B EMA) theory [16],where E EH. Because the composite dielectric function is onlyon the right-hand side for the MG EMA, the calculation ofEis quite straightforward;this theory is most accurate when the material consists of a well-known majorconstituent, interspersed with small, isolated minority constituents. In the B EMA,10
complexEexists in both the numerator and the denominator for each constituent,complicating the calculation ofE(see Ref. 17 for a technique to avoid branch cutproblems for 2 constituent B EMA calculations). The Bruggeman EMA has beensuccessfully used to simulate the optical functions of surface roughness and interfacelayers.In many cases, particularly in dealing with thin film materials that are notvery well characterized, it is best to parameterize the dielectric functions of the layer.The Lorentz approximation has often been used for this [18,19], and is given by: fi2 E 1 2 Aj A.2 / (k2- Lo2 irh).(15)where the sum goes from 1 to NL; often one term is sufficient.There are other parameterizations that have recently been utilized,particularly for approximating the optical functions of amorphous materials. One,based on a calculation of Forouhi and Bloomer (F&B) [20], has received someattention, but is flawed by the assumption that k(E) O for E E,, where E, is the bandgap of the amorphous semiconductor; the F&B approximation also is incorrect inthe limits as E O (for metals), and as E -,and the Kramers-Kronig determinationof the real part is incorrect. A more realistic model [21] is given byThe real part of the dielectric function is calculated from E ( E using)Kramers-Kroniganalysis, and results in a closed form. This formulation has several advantages overthe F&B calculation: 1)Q(E) 0 below the band gap; 2) Q(E) const/E3 as E -;E (E) constant for F&B; 3) If E, O, then E ( E const/E)as E O; Q(E) const E for F&B.Equation 16 and its Kramers-Kronig transform have been fit to several data sets11
fc ind in Refs. 13,sulting in far better fits than found from equivalent fits to theF&B expression.There are several other ways in which real situations in thin films can beparameterized. The effects of strain on the dielectric functions of materials can beparameterized if reasonably accurate spectroscopic values of the stress-optic constantsof the materials are available; these functions are not readily available for manymaterials, but are available for Si, Ge, and GaAs [22]. Free carrier effects can beincluded by adding a Drude term to the dielectric function of a layer [23]. If the thinfilm consists primarily of polycrystalline material, then the optical functions of thefilm are significantly different from the dielectric functions of the single crystallinematerial or its amorphous analog (see ref. 24 for the dielectric functions of variousforms of silicon); crystallite size effects have been successfully parameterized [23] forvery thin, small-grained aluminum films.V. Comparison of Calculations and DataThe final step in the process to analyze SE data is to compare the measuredparameters with calculated parameters. This is a critical step, but has been discussedpreviously in Refs. 3 and 25; therefore, only a summary will be given here.It is extremely important to choose a proper figure of merit (FOM) function touse as a comparison between the measured calculated parameters. The mostc o m o n FOM used [26,27] is the reduced x*, which is given bywhere n is the total number of data points, m is the number of fitted parameters,P e x p ( h i ) is the experimental data at wavelengthhi, Pcal,-(hi,z) is the calculatedquantity associated with the experimental data at wavelength hi and for theparameter vector z (with m elements), and Sp(hi) is the error associated with each of12
the experimental data points. The errors in the data points will have a randomcomponent, which is usually small, and a systematic part, due to errors in the angleof incidence, the natural spread in wavelength due to the monochromator, errors inthe wavelength due to the monochromator, errors in the azimuthal angles of theoptical elements, etc.The use of x2 as the FOM has several advantages:(1) It is automatically a measure of the "Goodness of Fit." If x 2- 1, then thecalculated model fits the data; if x2 1, the model does not fit the data. If x k 1 fortoo many cases, then the error limits have probably been set too large.(2) The more accurate experimental data points are automatically weightedmore than the inaccurate data points. This is particularly important for manyrotating element ellipsometers, where measurements of A become very inaccurate asA-0" or -180".(3) If a conversion algorithm such as Levenberg-Marquardt is used, thenelements of the calculation can be used to determine error limits of the parametervector z.Once a FOM is chosen, then one must "guess" at appropriate values of theparameter vector z, and converge onto the best fit values of z using a conversionalgorithm such as Levenberg-Marquardt. This calculation produces the curvaturematrix [26,27], given byIf E A-1, then 6Zi,corr (Eii)1/2 and 6zi,mcorr (1/Aij)I/' ,where GZi,corr and 6Zi,mcorrare the correlated and uncorrelated error limits of the ifh element of the parametervector z . In addition, the off-diagonal elements of the E matrix can be used tocalculate the cross-correlation coefficients: Ei,j / (Ei,i Ej,j)'/',measure correlations between parameters.13which can be used to
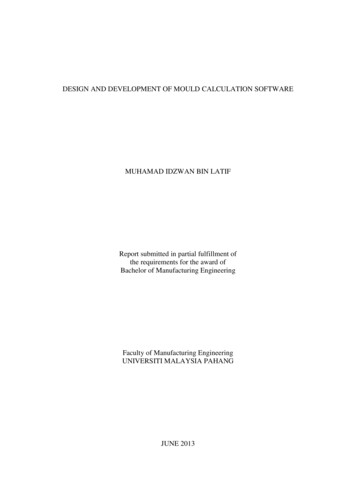
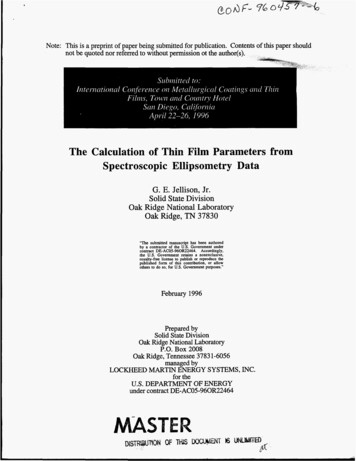
In reality, one cannot rigorously define error limits to the fitted parameters ifthere is any correlation between the fitted parameters [26,27]; all one can do is todefine a (m-1)-dimensional ellipsoid which define the confidence limits of each ofthe fitted parameters. If the fitted function is non-linear (as it is for SE), then theconfidence limits are not even described by ellipsoids, but rather a more complicated(m-1)-dimensional surface [26]; however, it often is a good approximation to assumethat the confidence limit surfaces are ellipsoidal.As an example, consider the case of several thicknesses of Si02 grown on Si.The complex p function was calculated for 4 different Si02 thicknesses from 1.5 to 5.3eV using literature values of the dielectric functions for Si02 (ref. 13) and for Si(Ref. 28), assuming an angle of incidence of 65"; errors in p were approximated usingthe procedure described in Ref. 25. These calculated p spectra where then fit to a 3material model, consisting of air/Si02/c-Sir where the optical functions of Si02 areparameterized using Eq. 15 and assuming that h1 92.3 nm andr O. This modelconsists of 2 fitable parameters: the Si02 thickness, and the Lorentz parameter A.The results are summarized in Table I.Since m 2 for this case, the resultingconfidence interval ellipsoids are just an ellipses, and are plotted in Fig. 2. Theresults shown in Table I and Fig. 2 are related the correlated error is just the totalheight of the error ellipse along the direction of interest, while the uncorrelatederror is the height of the ellipse at 0 error for the other parameter.As can be seen From Table I and Fig. 2, very thin films result in largeuncertainties in the fitted parameters, and there is a large correlation between thetwo parameters. As the film gets thicker, both the correlated and uncorrelated errorin A is decreased considerably; the absolute error in d also decreases modestly, butthe relative error decreases considerably. This example quantifies what has beenknown for some time: it is not possible to determine both the film thickness and theoptical functions of a very thin film.14
VI. SummaryIn this paper, we have looked at the analysis of spectroscopic ellipsometry datain detail to determine the elements of the calculation. There are 4:(1)Determination of the measured parameters.(2)Specification of the surface model.(3)Determination of the optical functions of the constituent films andsubstrate.(4)Parameterization of the model and the fitting of the data withcalculated spectra.Each of these steps is important, but step 4 is particularly important; if a "goodness offit" parameter is not calculated, then the researcher is relying on "chi-by-eye" [26],and therefore has no quantifiable measure of whether or not his model fits the data.This research was sponsored by the Division of Materials Science, Oak RidgeNational Laboratory, managed by Lockheed Martin Energy Research, for the U.S.Department of Energy, under contract DE-AC05-960R22464.15
References1. Spectroscopic Ellipsometry, Thin Solid Films, 233 (1993) 234.2. R. M. A. Azzam and N. M. Bashara, Ellipsometry and Polarized Light, NorthHolland, Amsterdam, 1977.3. G. E. Jellison, Jr., Thin Solid Films ,233 (1993) 416.4. P. S. Hauge, Surf. Sci., 96 (1980) 108.5. G. E. Jellison, Jr. and F. A. Modine, Appl. Opt., 29 (1990) 959.6. R. Barakat, Opt. Commun. 38 (1981) 159; C.Brosseau, C. R. Givens, and J. M.Kwiatkowski, J. Opt. SOC.Am., 10 (1993) 2248.7. H. Wohler, G. Haas, M. Fritsch, and D. A. Mlynski, J. Opt. Soc. Am., A 8 (1991)536.8. G. E. Jellison, Jr. and J. W. McCamy, Appl. Phys. Lett. ,61 (1992) 512.9. F. AbelGs, Ann. de Physique, 5 (1950) 596.10. S. Teitler and B. Henvis, J. Opt. SOC.Am., 60 (1970) 830.11. D. W. Berreman, J. Opt. Soc. Am., 72 (1972) 502.12. R. Jacobsson, in E. Wolf (ed.) Progress in Optics, 5, Wiley, 1965, p. 247.13. E. Palik (ed.), Handbook of optical constants of solids, Academic Press, Orlando,1985; Handbook of optica2 constants of solids, II Academic Press, Boston, 1991.14. G. E. Jellison, Jr., L. A. Boatner, D. H. Lowndes, R. A. McKee, and M. Godbole,Appl. Opt., 33 (1994) 6053.15. J. C. Maxwell Garnett, Philos. Trans. X. Soc. London, 203 (1904) 385; A 205 (1906)237.16. D. A. G. Bruggeman, Ann. Phys., (Leipzig)24 (1935) 636.17. Ph. J. Roussel, J. Vanhellemont and H. E. Maes, Thin Solid Films, 234 (1993) 423.16
18. G. E. Jellison, Jr. J. Appl. Phys., 69 (1991) 7627.19. S. Y. Kim and K. Vedam, Thin Solid Films, 166 (1988) 325.K.Vedam and S. Y. Kim, Appl. Opt. 28 (1989) 2691.20. A. R. Forouhi and I. Bloomer, Phys. Rev. B34 (1986) 7018.21. G. E. Jellison, Jr. MS in preparation.22. P. Etchegoin, J. Kircher, M. Cardona, and C. Grein, Phys. Rev. B45(1992) 11721;P. Etchegoin, J. Kircher, and M. Cardona, Phys. Rev. B47 (1993) 10292;P. Etchegoin, J. Kircher, M. Cardona, C. Grein, and E. Burstarret, Phys. Rev.B4XX199x) xxxxx23. H. V. Nguyen, I. An, and R. W. Collins, Phys. Rev. Lett. ,68 (1992) 994; Phys. Rev.B, 47 (1993) 3947.24. G. E. Jellison, Jr., M. F. Chisholm, and S. M. Gorbatkin, Appl. Phys. Lett., 62(1993) 3348.25. G. E. Jellison, Jr., Appl. Opt. ,30 (1991) 3354.26. W. H. Press, B. P. Flannery, S. A1 Teukolsky and W. T. Vettering, NumericalRecipes, Second Edition, Cambridge, University Press, 1992.27. N. R. Draper and H. Smith, Applied Regression Analysis, Wiley, New York,1981.28. G. E. Jellison, Jr., Optical Materials, 1 (1992) 41.17
Table IThe results of confidence limits to the calculation described in the text. The quantitydsi02 is the the Si02 film thickness, with correlated and uncorrelated errors shownas Gd,or, and Gduncorr respectively. The quantity A 1.099 for all calculations, but theorrelated and uncorrelated errors GAcorr and GAUncOrr vary considerably with filmthickness. 71000.250.150.0040.003-0.78818
Figure Captions1.A schematic of a generalized ellipsometer. The PSG is the polarization stategenerator, the PSD is the polarization state detector, and the S is thegeneralized sample, which contains all elements between the PSG and thePSD, including windows.2.The confidence limit ellipses for the 2-parameter example described in thetext. The correlated and uncorrelated errors are tabulated in Table I.19
LightLightDetectorSourceFigure 1G. E. Jellison,Jr.Oak Ridge National LabPO box 2008Oak Ridge, TN 37831-6056423-576-7309
Confidence intervals0.60.4n2 -tj0.20.0-0.2-0.4-0.6II-0.16I-0.08II0.00error (A)Figure 2JellisonOak Rid e National Lab.PO Box 008Oak Rid e, Tn 37831-6030423-5765309II0.08II0.1 6
The Calculation of Thin Film Parameters from Spectroscopic Ellipsometry Data G. E. Jellison, Jr. Solid State Division Oak Ridge National Laboratory Oak Ridge, TN 37830 Abstract Spectroscopic ellipsometry (SE) has proven to be a very powerful diagnostic for thin film characterization,