Transcription
IntroductionintoSpectroscopic Ellipsometry–Basics, Data InterpretationConsiderations and Applicationsto Photovoltaics1Thomas Wagner, L.O.T.-Oriel GmbH & Co. KGUniversity of Twente, February 11th 2010
OutlinePart 1: Theory andFundamentals What is Ellipsometry? Light and Polarization Measurements Optical Constants Models and DataInterpretation2Part 2: PV Applications SiNx AR coatings Amorphous, microcrystalline, andpoly-Si films Transparent Conductive Oxides CdTe and CdS CIGS Organic PV layers
Theory & Fundamentals Light Materials (optical constants) Interaction between light and materials Ellipsometry Measurements Data Analysis3
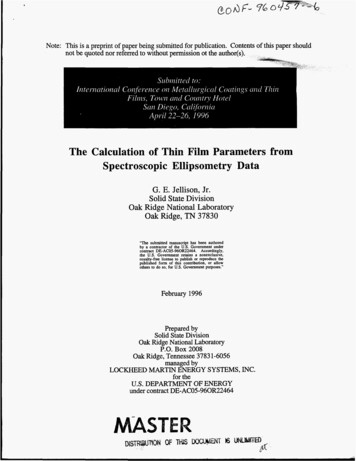
Electromagnetic Plane WaveLight From Maxwell’s equations we can describe a plane wave 2π E ( z, t ) E 0 sin ( z vt ) ξ λ Amplitudearbitrary phaseXWavelengthVelocityλElectric field E(z,t)YMagnetic field B(z,t)4ZDirectionof propagation
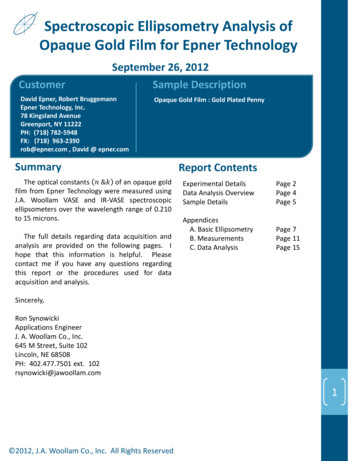
Intensity and Polarization Intensity “Size” of Electric field.I E2 Polarization “Shape” of Electric field travel.Different SizeYLessIntense(Intensity)EYEMore IntenseSame Shape!X5(Polarization)X
What is Polarization? Describes how Electric Field travels throughspace and time.Xwave1Ywave2Z6
What are Optical Constants?n,kDescribe how materials and light interact.n “refractive index”– phase velocity c/n– direction of propagation (refraction)k “extinction coefficient”– Loss of wave energy to the material n ikTogether “Complex Refractive Index”: n or “Complex Dielectric Function”: ε ε 1 i ε 272 ε n
Kramers-Kronig Relation Real and imaginary parts depend oneach other.ε 1 (ω ) 1 2πP 0ω ′ε 2 (ω ′)dω ′22ω′ ω Bumps make wiggles. Transparent range: Index increasesfor shorter wavelengths – normaldispersion When absorption increases, indexwill “turn” and decrease withdecreasing wavelength - anormaldispersion8ε1ε2nkFrequency (energy)
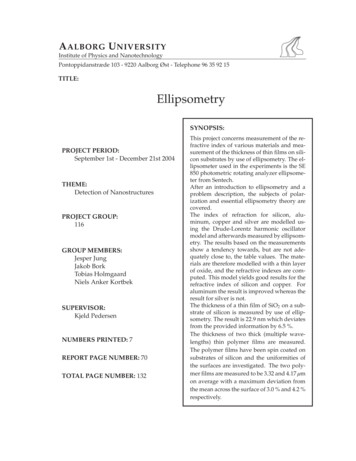
Absorbing regionAbsorptions in the various spectral regionshave different shapes & root causes.IR13ElectronicTransitions 60VisibleUV 50040-13ε1ε2Rutile TiO2-25UV to IR-38-500.0393020100.10.31Photon Energy (eV)3010ε2– Free-carriers25Transparentε1– Electronic Transitions– Molecular Vibrations– Lattice VibrationsLatticeVibrations
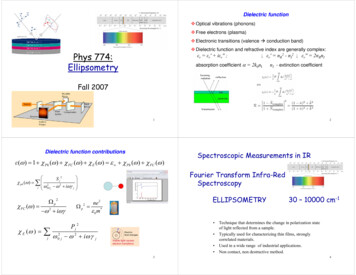
Polarized light at interface Electric field either parallel(p) or perpendicular (s) toplane of incidence.EsEp Material differentiatesbetween p- and s- lightReflection1.0RpRs0.60.40.20.001020406080Angle of Incidence ( )Esplane ofincidenceEs0.8EpEp100
Fresnel Coefficients Describes reflection and transmissionrs,pni Depends on angle and polarization (p or s)nt11ts,p E0 r ni cos θ i nt cos θ t rs E0 i s ni cos θ i nt cos θ t E0tt s E0i E0 rrp E0 i E0 t 2ni cos θ i t p E0 i p ni cos θ t nt cos θ i n cos θ i ni cosθ t t p ni cosθ t nt cos θ i 2 ni cos θ i s ni cos θ i nt cos θ t
Light-Sample InteractionMultiple reflections in single film lead to aninfinite seriesrtot r01 t 01r12t10ertot ( p, s ) 12-2iβr01( p ,s ) r12( p ,s )t 01( p ,s ) t10( p, s )e i 2 β2 t01r12 r10t10 er101 r01( p ,s ) r12( p ,s ) e i 2 βNoFILM PHASE THICKNESSN1 d1 β 2π n1 cosθ 1 λ N2t01t12-4iβt01r12t10t01r12r10t12 .t01r12r10r12t10t01r12r10r12r10t12
What is Ellipsometry? Measures change in polarization of reflected light. Sample is defined by reflection of p- and s- polarized light. E out rp p out Es 0E0 E inp in rs Es inE outEppE sout E sin rp i (δ p δ s )rp e tan (Ψ )e i ρrsrsp-planetan(Ψ) s-planep-planeEplane of incidences-plane13rprs δ p δs
What can SE determine?AnalysisProperties of Interest:Ellipsometry Measures:Film ThicknessRefractive IndexPsi (Ψ)Delta ( )Surface RoughnessInterfacial ty
Data Analysis Flowchart15
Ellipsometry Advantages Repeatable & accurate:– Self-referencing, measures ratio of Ep/Es Thus,reduced problems with: fluctuation of source intensity light beam spilling over small samples Measure two parameters– Ψ and at each wavelength/angle combination.– increased sensitivity to multiple film parameters16
Ellipsometry vs. ReflectometryGenerated Data0.70 in degreesGen sR 0 (1)Gen sR 0 (2)0.601nm & 2nm oxideon Si0.50200.30200600Wavelength (nm)80010004006008001000180150Gen E 75 (1)Gen E 75 (2)120906002004001nm & 2nm oxideon Si10300.40Gen E 75 (1)Gen E 75 (2)30 0.80ReflectionGenerated Data400200R17ΨΨ in degrees Phase informationgives Ellipsometryhigher sensitivity tovery thin films.1nm & 2nm oxideon Si400600Wavelength (nm)8001000
Thin Film Interference Each reflected wave will have a different phaseand amplitude. Coherent waves (same freq. and direction)combine constructively/destructively.n 0n 1n 218r01t01 r12 t10e-2iβt01 r12 r10 r12 t10e-4iβ
Motivation Data Interpretation:– Estimate sample based on “raw” data.– Reduce analysis time and improve ability toidentify correct models.Experimental Data3025Data interpretation notquantitativeΨin degreesExp E 65 Exp E 75 20151050300196009001200Wavelength (nm)15001800
Role of Optical Constants Index difference leads to reflection– Large N Large Reflection– Small N Small Reflection20Material 1Material 2ReflectanceAir (N 1)SiO2 (N 1.5) 3.3%Air (N 1)Si (N 3.5) 31%a-Si (N 3.4)Si (N 3.5) 0.02%
Bare Substrates What do we expect?– Psi features follow optical constant structure.– Psi curves minimize at Brewster condition, butremain higher when absorbing.– Delta at 180 or 0 , except when absorbing or inpresence of surface film.21
Substrate Optical Constants SemiconductorsSilicon7.06.0Index of refraction, nSubstrate Dielectrics5.03.03.02.02.01.0600800Wavelength (nm)1000Index of refraction, nIndex, n2.51.66009001200Wavelength 00Wavelength (nm)150001800Extinction Coefficient, kSiO2Si3N40.01200Aluminum3.01.822400 Metals2.01.43004.04.01.0200Index of Refraction, N2.25.0NKExtinction Coefficient, k6.0
Dielectrics Psi flat and smooth Delta 0 ,180 - except for surfacefilms30180150Exp E 45 Exp E 55 Exp E 65 Exp E 75 20 in degreesΨ in degrees25151050200230.5nm roughness12090Exp E 45 Exp E 55 Exp E 65 Exp E 75 6030400600800Wavelength (nm)100012000200400600800Wavelength (nm)10001200
Semiconductors Psi follows shape of absorption Delta between 0 or 180 whenabsorbing50200Exp E 55 Exp E 65 Exp E 75 150 in degreesΨ in degrees4030202410050100200ExpE 55 ExpE 65 ExpE 75 400600800Wavelength (nm)100012000200400600800Wavelength (nm)10001200
Metals Significant absorption:– Psi stays near 45 , Delta away from 0 or180 .44150Delta in degrees180Psi in degrees46120424065 75 85 383620025906065 75 85 30400600800Wavelength (nm)100012000200400600800Wavelength (nm)10001200
“Pseudo Optical Constants” n & k or ε1 & ε2 Assumption: Optically thick bulk substrate with nosurface layers or roughness2 where, 1 ρ222 ρ tan Ψ ei ε n sin (φ ) 1 tan (φ ) 1 ρ ϕ gth (nm)Ψ-E 70 Ψ-E 75 -E 70 -E 75 10008060401200ε 1 -E70 ε 1 -E75 ε 2 -E70 ε 2 -E75 7.06.05.04.0-403.0-60-802002.0400600800Wavelength (nm)10001.01200 ε 2 100Exp Exp Exp Exp -20 ε 1 1208.00 in degreesΨ in degrees402020020
“Pseudo Optical Constants” Angle independent way of viewingexperimental data.208.0Exp Exp Exp Exp 07.06.05.04.0-40 ε 2 ε1 -20ε 1 -E70 ε 1 -E75 ε 2 -E70 ε 2 -E75 3.0-60-802002.0400600800Wavelength (nm)10001.01200 All angles give same values implies:Light path is sameOptically thick bulk substrateNo film (or very thin surface layer)27
Thin Films “Very Thin” thickness 100 Å determining thickness when OC’s are known– SE deals with this well determining OC’s– very difficult, if not impossible28
Determining Thickness mainly Delta (Phase) is sensitive tovery thin films– 20, 40, 65, 80, 100 Å29
Very Thin Film Index? Correlation prevents exact determination, beyondwhether higher or lower than substrate index.n 1.25n 1.35n 1.4520n 1.55n 1.65n 1.755nm coating on Glass in degrees100-10-20-3030030400500600700Wavelength (nm)800900
Transparent Films0300406009001200Wavelength (nm)03006009001200Wavelength (nm)150018001800Exp E 75 802015005 micron Oxide100Ψin degreesΨ in degrees600400Exp E 75 806020500nm100Exp E 75 80Ψin degrees Thicker films producemore interferenceoscillations.100nm Oxide10060402003103006009001200Wavelength (nm)15001800
Thickness Effects As thickness increases:*Interference shifts to red*Peaks closer togetherΨ in degrees100T8060402000323006009001200Wavelength (nm)15001800
Transparent Films Dispersion Relationship, such as Cauchy, can beused to reduce the number of “fit” parameters.1.65Index of refraction 'n '1.621.592n( λ ) A B/ λ C/ λ41.56k( λ) 01.531.501.471.4420033400600800Wavelength (nm)10001200
Amplitude (An) Adjust the An parameter to the approximate index.2 λAn 2.50An 2.25An 2.00An 1.75An 1.50Cnλ42.82.62.4Indexn (λ ) An Bn2.22.01.81.61.430034400500600700Wavelength (nm)800900
Dispersion (Bn and Cn) Bn & Cn provide curvature versus wavelength.Bn 0.020Bn 0.010Bn 0.005Bn 0.0002.001.752λ Cnλ41.501.2530035n (λ ) An BnIndexBn -0.01400500600700Wavelength (nm)800900
Effect of Film IndexIndex difference affects oscillations (75 AOI)3610080Ψin degreesn 1.5n 1.75n 2.0n 2.25n 2.5n 2.75n 3.0n 3.25n 3.5n 3.75n 4.0604020003006009001200Wavelength (nm)15001800
Effects of Dispersion Oscillations are primarily due to thickness.Dispersion will affect oscillation position and amplitudeslightly.1 n 20 n 4500 nm1 mm1 user0 n 4With Dispersion in Film50504040Ψ in degreesΨ in degreesNo Dispersion3020100037500 nm1 mm3020103006009001200Wavelength (nm)15001800003006009001200Wavelength (nm)15001800
Multilayers- Envelope Oscillations for multilayers is acombination of each film envelope.8060Ψ in degrees2 nitride 200 nm1 oxide 500 nm0 substrate 1 mm40200038MultilayerOxide OnlyNitride OnlySubstrate3006009001200Wavelength (nm)15001800
Multilayer Example Both oscillation patterns are superimposed!Multilayer Example8060Ψ in degreesn 1.5 200 nmn 31000 nmn 41 mm402000393006009001200Wavelength (nm)15001800
Absorbing Thin Film If light is absorbed before returning to surface,only top reflection is ‘seen’ (Film appears as Substrate)300 in th (nm)270300
Multilayer (Absorbing-Transparent) If 2-layer, but 1 is absorbing, then:2 a-si1 sio20 si2 sio21 a-si0 si300 nm3000 nm1 mmGenerated DataGenerated Data60100508040Ψ in degreesΨ in degrees3000 nm300 nm1 mm30201000416040203006009001200Wavelength (nm)15001800003006009001200Wavelength (nm)15001800
PV Applications SE is applied to most PV thin films:– SiNx AR coatings– Amorphous, microcrystalline, and poly-Si films– Transparent Conductive Oxides– CdTe and CdS– CIGS– Organic PV layers– 42
Ellipsometric study of Photovoltaics Measurement challenges:––––Textured/ Rough surfaceLow reflectionLarge samplesIndustrial integration Modeling considerations:– Rough surfaces, Rough interfaces, Rough substrates– Parameter correlation Applications43
Textured Si coated with SiNyWafertreatmentMorphologyPolished, c-SiSmoothAlkaline etched, c-Si20 µmAlkaline etched,multi c-Si50 µmSample tilting mount50 µmImproved light sourceand detection system20 µmIncluding scatteringfactorAs-cut,multi c-Si44Textured surfaceHigh scatteringSpecular R 0Solution:Acid etched,multi c-SiM. F. Saenger, M. Schubert, J. Hilfiker, J. Sun,J. A. Woollam, M. Schädel, IMRC 2008MeasurementChallenge:
Textured Si WaferM-2000X with Intensity Optimizer45
Large Area MappingACCUMAP-SE46Flying-SE
Modeling Considerations Modeling considerations for PV thin films:– SiNx AR coatings– Amorphous, microcrystalline, and poly-Si films– Transparent Conductive Oxides– CdTe and CdS– CIGS– Organic PV layers47Rough surfaces, Roughinterfaces, Rough substrates,High absorption, Grading,Anisotropy, Superstrates,Complex sample structure,Parameter correlation, .
Thin Film Interference30transparentabsorbingrough surfaceΨ in degrees25201510501.8482.12.42.73.0Photon Energy (eV)3.3n 0n 0n 0 n1 n1n 1 n2 n2n 2Transparent h Surface –shifts in data
Thickness determination - UV/VISExperimental Data4.02003.52010050150105200ExpΨ-Eb 65 Exp -Eb 65 300400500600Wavelength (nm) in degreesΨ in 00600Wavelength (nm)700 Difficult in UV/ Visible range due to high absorption/surface roughness492.01.52.51.0200Extinction Coefficient ' k'25250Index of Refraction ' n'300.0800
Thickness determination- Near Infrared (NIR) or Infrared (IR)30300n0600-100800 1000 1200 1400 1600Wavelength (nm)2.52.5121.01.50.5100.0200002.00.51.0 004000300800012000600900 1200WavelengthWavelength (nm)(nm)160001500Transparent region in NIR/IR spectraeasy to get thickness!50n 2k 2.01.51.51.5ExpΨ-E 65 Exp -E 65 400Index of Refraction ' n'I n d ex o f refrac tio n , NΨ in degrees15 in degrees1003.0 3kExtinction Coefficient ' k'2002052002.52.53.53.525104.0 41800E x tin ctio n co e fficie n t, kExperimentalUV –VIS -DataNIR
Modeling of Rough SurfacesRough SurfaceEMA approximationt Bruggeman Effective Medium Approximation (EMA)– Mix the optical constants of surface layer with void51
SiNx AntiReflection Coatings40Textured Si - Exp DataTextured Si - MODELSiNx - Exp DataSiNx - MODELIndex of Refraction, n3020100 in degrees80601.96SiNx Optical Constants1.94nk1.921.880.051.86400600Insert: SEM graph200-20-402004006008001000Wavelength (nm)1 sin-tauc lorentz70.500 nm0 ema si jaw/23% void1 mm52800Wavelength (nm)400.150.101.901.842000.20With Scattering Factor0.001000Extinction Coefficient, kΨ in degrees50
Imag(Dielectric Constant), ε2Amorphous, Microcrystalline, and PolyCrystalline Silicon53For high crystalline %,the peak is narrowerand eventuallyseparates into twodistinct regions.504030a-Si70% Poly-Si85% Poly-Sic-Si201001.02.03.04.0Photon Energy (eV)5.06.0
Transparent Conductive Oxides TEC-15 GlassSnO2:F300 in degrees– Characterize Multi-LayerTCO structure– TCO intentionally rough hazy for light trappingModel FitExp Eb 55 Exp Eb 65 Exp Eb 75 2001000320nmSiO223nmSnO230nmGlass Substrate54Ψ in degrees302010003006009001200Wavelength (nm)15001800
Indium Tin Oxide NIR absorption used to monitor conductivityITO Optical Constants during Deposition2.5120.71.510.50400550.80.6n, Middle of depositionn, After depositionn, After annealingk, Middle of depositionk, After depositionk, After annealing0.50.40.30.20.1060080010001200Wavelength in nm14001600Extinction Coefficient, kIndex of Refraction, n0.9
CdTe / CdS on Tec-15 Glass15129 ε1 CdTeModel FitExp Eb 60 Exp Eb 75 CdS61458nm210nm3Tec-15 Glass0-30.01.02.03.04.05.06.07.0Photon Energy (eV)96 ε2 30Model FitExp Eb 60 Exp Eb 75 -3-6-90.01.02.03.04.05.0Photon Energy (eV)566.07.0CdTe –SEM micrographCourtesy: Nicola Romeo, University of Parma,INFM, & ARENDI S.p.A. IMRC 2008
CdTe and CdS 1.02.03.04.0Photon Energy (eV)575.06.00.07.012CdTe Optical Constants12ε1ε29866340-30.01021.02.03.04.0Photon Energy (eV)5.06.007.0Imag(Dielectric Constant), ε 27.0Real(Dielectric Constant), ε 1CdS Optical ConstantsImag(Dielectric Constant), ε 2Real(Dielectric Constant), ε 1 Measure optical constants with changingmorphology and process conditions.
CIGSA.M. Hermann et al. “Fundamental studies on large area Cu(In,Ga)Se2 films forhigh efficiency solar cells”, Solar Energy Materials & Solar Cells 70 (2001) 345.58
Organic Solar Cells Measurement similar to OLED Films may exhibit anisotropy SE Transmission fit, OLED film:59
Organic Solar Cell Materials PEDOT:PSS Multi-Sample fit:60
Organic Solar Cell Materials P3HT / 300nm SiO2 / Si Multi-Sample fit:Generated and 003006009001200Wavelength rated and Experimental200100Model FitExp E 45 Exp E 55 Exp E 65 Exp E 75 0-1000.01.02.03.04. 05.0Photon Energy (eV)616.0Photon Energy (eV) in degreesIndex of Refraction ' n'nxynzkxykz2.2Extinction Coefficient ' k'1.4Ψ in degrees80P3HT Optical Constants2.4Model FitExp E 45 Exp E 55 Exp E 65 Exp E 75 6.07.0
PV Summary SE has many uses toward PV thin films:– SiNx AR coatings– Amorphous, microcrystalline, and poly-Si films– Transparent Conductive Oxides– CdTe and CdS– CIGS– Organic PV layers– 62
Further References on Ellipsometry1.Hiroyuki Fujiwara, Spectroscopic Ellipsometry: Principles and Applications, John Wiley & Sons, 2007.2.Handbook of Ellipsometry, Tompkins and Irene, eds., William Andrew Publishing, NY, 2005.3.H. G. Tompkins, and W.A.McGahan, Spectroscopic Ellipsometry and Reflectometry, John Wiley & Sons, NewYork, 1999.4.R.M.A. Azzam, and N.M.Bashara, Ellipsometry and Polarized Light, North Holland Press, Amsterdam 1977,Second edition, 1987.ICSE Conference Proceedings:631.Thin Solid Films Vol. 455-456, (2004) M. Fried, K. Hingerl, and J. Humlicek, Editors, Elsevier Science.2.Thin Solid Films Vol. 313-314 (1998) R.W.Collins, D.E.Aspnes, and E.A. Irene, Editors, Elsevier Science.3.Spectroscopic Ellipsometry, A.C.Boccara, C.Pickering, J.Rivory, eds, Elsevier Publishing, Amsterdam, 1993.
What is Ellipsometry? Measures change in polarization of reflected light. Sample is defined by reflection of p- and s- polarized light. plane of incidence E E p-plane p-plane s-plane s-plane i(