Transcription
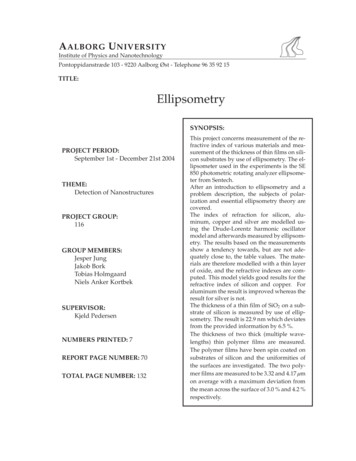
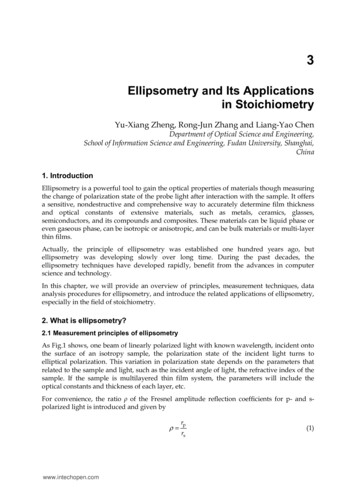
3Ellipsometry and Its Applicationsin StoichiometryYu-Xiang Zheng, Rong-Jun Zhang and Liang-Yao ChenDepartment of Optical Science and Engineering,School of Information Science and Engineering, Fudan University, Shanghai,China1. IntroductionEllipsometry is a powerful tool to gain the optical properties of materials though measuringthe change of polarization state of the probe light after interaction with the sample. It offersa sensitive, nondestructive and comprehensive way to accurately determine film thicknessand optical constants of extensive materials, such as metals, ceramics, glasses,semiconductors, and its compounds and composites. These materials can be liquid phase oreven gaseous phase, can be isotropic or anisotropic, and can be bulk materials or multi-layerthin films.Actually, the principle of ellipsometry was established one hundred years ago, butellipsometry was developing slowly over long time. During the past decades, theellipsometry techniques have developed rapidly, benefit from the advances in computerscience and technology.In this chapter, we will provide an overview of principles, measurement techniques, dataanalysis procedures for ellipsometry, and introduce the related applications of ellipsometry,especially in the field of stoichiometry.2. What is ellipsometry?2.1 Measurement principles of ellipsometryAs Fig.1 shows, one beam of linearly polarized light with known wavelength, incident ontothe surface of an isotropy sample, the polarization state of the incident light turns toelliptical polarization. This variation in polarization state depends on the parameters thatrelated to the sample and light, such as the incident angle of light, the refractive index of thesample. If the sample is multilayered thin film system, the parameters will include theoptical constants and thickness of each layer, etc.For convenience, the ratio ρ of the Fresnel amplitude reflection coefficients for p- and spolarized light is introduced and given byρ www.intechopen.comrprs(1)
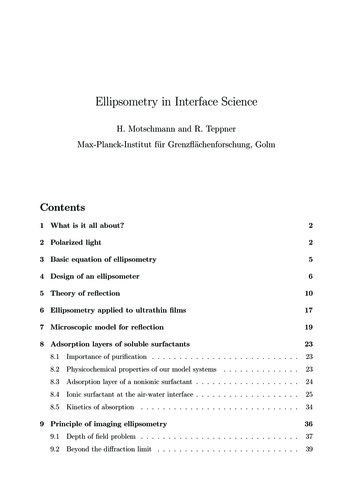
50Stoichiometry and Materials Science – When Numbers MatterWhere, rp and rs represent the amplitude reflection coefficients for p- and s- waverespectively. Both rp and rs are complex, so is the ratio ρ, which is usually expressed interms of the two ellipsometry angles ψ and Δ (0 ψ 90º,0 Δ 360º) as followsρ tanψ exp(iΔ )(2)Where, ψ and Δ are also called ellipsometry parameters. The ratio of the modulus of theamplitude reflection coefficients is given by tan ψ , and the phase difference between p- ands-polarized reflected light is given by Δ . The two ellipsometry parameters ψ and Δ areobtained directly from the measurement of ellipsometry.p-waveLinearly Epolarizedlights-waveNormalp-wavePlane ofincidenceEllipticallypolarizedlights-waveFig. 1. Reflection of p- and s-polarized lightUsually the samples are multilayered thin films, and the purpose of ellipsometrymeasurement is to get the film structure and optical constants from the measuredellipsometry parameters, such as the refractive index, extinction coefficient, and thickness ofeach layer, etc. for the sample.Fig.2 shows the process of ellipsometry data fitting and model analysis, and it includes thefollowing steps:1.2.3.4.To collect the ellipsometry data of the sample from the ellipsometry measurement.To build a suitable optical model for the sample with parameters ni ( λ ) , ki ( λ ) , di , imeans the ith layer of the film. The film may consist of only one kind of material orconsist of several kinds of materials.To select suitable dispersion model, such Sellimeier model, Cauchy model, Lorentzmodel, Drude model, effective medium approximation (EMA) model etc., for eachlayer. Which dispersion model should be selected for a certain layer depends on thespecific type of the film and we will discuss later in detail. In the model, someparameters are known and the others are unknown. The unknown parameters will bedetermined through mathematical inversion method.To calculate the theoretical values of ψ and Δ using the selected model and comparethem with the measured values. The following function is usually employed for thecomparison:www.intechopen.com
Ellipsometry and Its Applications in StoichiometryRMSE n1 ( Ψ calc Ψ meas Δ meas)2 ( Δcalc)2 iiii2n m 1 i 1 51(3)Where, the superscripts “meas” and “calc” represent the measured and calculatedellipsometry parameters respectively. In Eq. (3), n and m are the numbers of the measureddata points and the analytical parameters, respectively. The unknown parameters in theoptical model, such as film thickness or optical constants, are varied and try to produce a“best fit” to the experimental data. The best fitting results will lead to minimum of theRMSE value or a value small enough, and then the physical parameters are obtained once agood fit is achieved.Measurement (Experimental data)Model (Theoretical data)Fit ( Comparison of the Experimental dataand the theoretical data)Results (n,k,thickness,roughness,etc.)Fig. 2. Process of ellipsometry data fitting and model analysisFrom the above introduction, one may find that ellipsometry is an indirect way to get theoptical constants and thicknesses of each layer for a sample. The precision of the extractedparameters by the ellipsometry measurement depends on two aspects:1.2.The measurement accuracy of ψ and Δ .The right model and suitable fitting method.The general iterative algorithm which applied the most is least square method. However,the algorithm must have a suitable initial estimate, or we can not get the reasonablenumerical solution. In order to determine the film parameters more quickly and accurately,genetic algorithms, simulated annealing algorithm, artificial neural network algorithm andother optimization algorithms have been gradually applied to the ellipsometric dataprocessing. It has greatly improved the convergence speed of the fitting process.Here, we only provide a very simple introduction about the measurement principle ofellipsometry. As for the detailed knowledge on this topic, please refer to some excellentbooks or references [1-7].www.intechopen.com
52Stoichiometry and Materials Science – When Numbers Matter2.2 Types of ellipsometry2.2.1 Null ellipsometerIn the 19th century and early 20th century, as the only light detector, human eyes can onlydetect the presence or disappearance of the signal light from a quantitative point of view, sothe ellipsometers were based on null ellipsometry at that time [8-10]. The null ellipsometryis usually of PCSA structure, P, C, S and A are the polarizer, the phase compensator, thesample, and the analyzer device respectively. The order of letters shows the ordercomponents arranged in the light path along the propagation of light. The operation of nullellipsometry is to rotate the P, C and A, let the incident light intensity on the detector to thesmallest, and identify a set of azimuth (P, C, A) combination. The ellipsometry parametersψ and Δ are calculated from the azimuth combination. Automation technology had notbeen developed at that time, and the PCA mechanical azimuth adjustment was all manual.In order to obtain accurate azimuth, the measurement time can be up to several minutes,after the azimuth measured, manual calculation should be done based on the principles ofpolarized light.In 1960s, in order to reduce the time spending in angle calibration, H. Takasaki [11] usedautomation servomotor technology to drive polarizer and compensator and set the azimuthof polarizers automatically. However, in this configuration, it was still unavoidable to usehuman eye in the azimuth reading. Of course, the subsequent ellipsometry data processingwas still involved in the human. So this type of ellipsometer was only a semi-automaticellipsometer.In 1967, J. L. Ord et al. applied the computer to send pulses to the stepper motors, read thelight intensity signals from optical detector through an analog-digital (AD) signal converter,and precisely control and record the azimuths when light intensity comes to zero [12]. Theellipsometry parameters were then calculated by computer program from the measuredazimuths.During the operation of null ellipsometer, it is necessary to change the azimuths of thepolarizers or compensator through mechanical rotating of optical devices. Although theapplication of automation technology has improved the rotary speed, but still subject to therotation limit of the mechanical components. Besides the mechanical method of changingthe polarization state, there is a phase modulated ellipsometry that add an electro-opticmodulated device to the polarized device, changing the output light’s polarization state byphase modulation. The speed of changing polarization state depends on the electro-opticaleffect (about several kHz), which is much higher than that of the mechanical rotation(usually 1 100Hz). In 1960s, an ADP crystal with a large electro-optic coefficient was usedfor phase modulation [13, 14]. In the same period, Winterbottom [15] proposed and proveda new method to achieve phase modulation by using magneto-optical Faraday effect tochange the polarization state of the output light, and in 1970s H. J. Mathieu made thismethod come true [16]. With the support of automatic circuit control system, theellipsometer using Faraday-effect cell obtained higher measurement speed compared withthe stepper motor-driven automation null ellipsometer. In addition, in 2004, K. Postava et al.[17] applied the photoelastic modulation (PEM) crystal with photoelastic effect, which haveusually been used in the phase modulation photometric ellipsometer, to the nullwww.intechopen.com
Ellipsometry and Its Applications in Stoichiometry53ellipsometer with PCSA structure, and produced an automatic phase modulation nullellipsometer with high signal to noise ratio, high precision and high sensitivity but also fastmeasurement speed. However, due to the electro-optic effect and photoelastic effect of themodulator crystal are very sensitive to temperature, the phase-modulated ellipsometer mustwork under the conditions of constant temperature and the calibration process of coefficientof the crystal phase modulation is relatively complicated.2.2.2 Photometric ellipsometerIn 1937, C. V. Kent and J. Lawson [18] first reported the photometric instrument with thepolarizer and compensator adjusted to produce circularly polarized light on reflection fromthe sample. The analyzer was rotated at 40 Hz, and the pseudonull condition detected byamplifying the output of the photocell detector and listening to the 80 Hz components on apair of headphones.The modern type photometric ellipsometry technique, with the application of the steppermotor, photodetector and computer control system, appeared in early 1970s [19, 20]. Thistype of ellipsometry technique no longer needs to adjust the polarizers in the light path to aspecific azimuth and make the light reach the detector for a particular polarization. Onemay use computer to precisely set the azimuths of polarizer, analyzer and compensator, andmake the polarization state of light reaching the detector changing continuously. The signalof intensity of light with different polarization was changed to experimental data through alinear AD converter and collected by computer. The data were then analyzed based onprinciples of ellipsometry by computer. The ellipsometry parameters were obtained fromthe Fourier analysis during the data processing. All the operation (from measurement todata processing) can be performed by computer. Therefore, this photometric ellipsometerrepresents a fast and fully automatic measurement.Photometric ellipsometer can be divided into phase modulation type and mechanicalrotation type according to the method of continuously changing the light polarization. Thephase modulated ellipsometer (PME) [21, 22] is similar to the phase modulated nullellipsometer in principle, but unlike the latter, PME works without mechanical rotation ofoptical devices. PME has a very high measurement speed with kHz modulation frequency.However, PME also has a fatal flaw same to phase modulated null ellipsometer: as a keycomponent, the modulator crystal is very sensitive to temperature drift, measurement errorwill significantly increase if not used in constant temperature, and the entire build process iscomplicated, so the cost is relatively high. Mechanically rotating photometric ellipsometercan divided into rotating polarizer ellipsometer (RPE), rotating analyzer ellipsometer (RAE)[23, 24], rotating polarizer and analyzer ellipsometer (RPAE) [25, 26] and rotatingcompensator ellipsometer (RCE) [27]. In 1975, P. S. Hauge et al. applied rotatingcompensator into RCE for the first time. In the situation of fixing the polarizer and analyzer,one can measure all four Stokes vector components through rotating compensator, and thismethod can be used to measure all polarization states, including the complete polarizationand partial polarization state. If the dual rotating compensator [28] structure is used, allsixteen Mueller matrix elements can be measured. Compensator of RCE is a quarter-waveplate, strictly speaking, valid only for a single wavelength, making it restricted in the field ofmulti-spectral applications once.www.intechopen.com
54Stoichiometry and Materials Science – When Numbers MatterRPE, RAE and RPAE belong to the same kind of photometric ellipsometer, and they havecommon advantages, such as simple structure, mature, low cost, etc. But they have anobvious disadvantage: when the ellipsometry parameter Δ approaching 0 or 180 , the errorof measurement would be significant. Most of the early photometric ellipsometers onlyrotate one of the three polarizers. RPAE is the latest invention. P and A can rotate atdifferent speed at the same time. The rotation ratio of P to A is flexible and can be 1:2 [25,26], 1:1 [29], etc. The advantage RPAE has but the other two do not have is that it is notnecessary to know the background light intensity. So RPAE can obtain two sets ofellipsometry parameters for the absolute calibration self-consistency, which is unique forRPAE. Because the rotating polarizer is relatively far away from the detector in RPE, anysmall deviation in installation of polarizer will bring the light spot reaching the detectorrotate around a non-central point, tend to increase measurement error. Except theapplication in parallel measurement, the RPE is not as useful as RAE. In addition to C. V.Kent [18], the first RAE was built in 1962 by W. Budde [23]. In 1969, B. D. Cahan developedthe first automated photometric ellipsometer using RAE-based structure [24].2.2.3 Spectroscopic ellipsometerIt can’t determine the thickness of each layer with ellipsometry parameters of singlewavelength for multilayer samples. In order to determine the optical constant exactly, andto get the structure of multilayer films with enough data by ellipsometry, the spectroscopicellipsometer (SE) has been developed. In 1975, D. E. Aspnes et al. reported an SE systembased on RAE for the first time [30]. A Xe lamp and Czerny-Turner grating monochrometerwere employed in the SE system. The spectral resolution was 0.2 nm. For single wavelengthλ 400 nm, the total acquisition time was 7 seconds with cycles averaged per data point 1000.In 1984, R. H. Muller et al. developed an SE system based on Faraday Cell phase selfcompensation technique [31]. A special filter with uneven thickness was employed to choosewavelength at different position when white light used as light source. According tointerference theory, different point at the filter with different thickness corresponds todifferent central wavelength of transmittance. This method has low quality ofmonochromatic light, but it has a high rate for changing wavelength with speed as high as114 nm/s, and it can take 400 sets of ellipsometry parameters for different wavelength from370 nm to 720 nm in 3 seconds.In 1990, Y. T. Kim et al. realized a real time spectrum measurement with the combination ofRPE, prism spectrometer, and optical multichannel analyzer (OMA) [32]. It took 40 ms tofinish the measurement of 128 sets of ellipsometry parameters over the whole spectrum. In2003, this group developed a generalized ellipsometer with multichannel detecting usingcombination of RCE and OMA [33]. The measurement time depends on the rotatingfrequency of compensation device, and it can take 150 sets of ellipsometry parameters in theenergy range of 2 – 5 eV in 0.25 seconds.The spectral measurement technology has a new development with the combination ofmultiple gratings and two dimensional array detectors. With the development of denselyfolded spectral images of a charge-coupled device (CCD) spectrometer [34, 35], it is possiblewww.intechopen.com
55Ellipsometry and Its Applications in Stoichiometryto obtain the real time spectrum with high accuracy and resolution in the collecting time ofCCD without moving of the mechanical devices. H. Y. You et al. realized a fastmeasurement of ellipsometry parameters in visible light range with the combination ofarray grating spectrometer and RPAE [36]. Recently, P. H. Mao et al. reported a new type ofellipsometer using an integrated analyzer composed of 12 sub-analyzers with differentazimuth angles [37]. The new method having the merits of high speed and reliability in theoptical data measurement can be potentially used in the fields of real time processmonitoring.Up to date, diverse of ellipsometry has been developed, such as imaging ellipsometry [3840], infrared spectroscopic ellipsometry [41-50], Mueller matrix ellipsometry [51-63], etc.Here, we will not make a full introduction about the developments of ellipsometry. As anexample, a rotating-polarizer-analyzer ellipsometer (RPAE) will be introduced as follows.2.3 Example: A rotating-polarizer-analyzer ellipsometer (RPAE)Here, we take the RPAE as an example to show how an ellipsometer works. An improvedspectroscopic ellipsometer by synchronous rotation of the polarizer and analyzer (RPA) wassuggested, designed, and constructed many years ago [64, 65]. The configuration of RPAE isshown in Fig. 3, light goes through a fixed polarizer, a rotating polarizer, sample and arotating analyzer before entering the detector.Fig. 3. Optical configuration of the RPAEFor a convenient mathematical presentation, assuming that the coordinates s and p areperpendicular and parallel, respectively, to the incident plane, the azimuthal angles of bothP and A are related to the s axis. Then the electric field that finally emerges from theanalyzer is cos A sin A rsE f [1 0] sin A cos A 0(20 cos P sin P 1 0 cos P sin P 1 Erp sin P cos P 0 0 sin P cos P 0 0) rs cos A cos P rp sin A cos P sin P E0Therefore the light signal received by the detector iswww.intechopen.com(4)
56Stoichiometry and Materials Science – When Numbers MatterI Ef 2112 η cos2 A cos 4 P sin 2 A sin 2 2 P ( tanψ ) sin 2 A sin 2 P cos 2 P tanψ cos Δ 42 (5)where is an arbitrary number related to light intensity, ψ and Δ are two ellipsometryparameters. If A 2P ω0t, thenI I 0 I 1 cos ω0t I 2 cos 2ω0t I 3 cos 3ω0t I 4 cos 4ω0t(6)whereI0 η4(7 3 tan 2 ψ 2 tanψ cos Δ ) I bI4 (7a)I 1 η (3 tanψ cos Δ )(7b)I 2 η (2 tan 2 ψ )(7c)I 3 η (1 tanψ cos Δ )(7d)η4(1 tan 2 ψ 2 tanψ cos Δ )(7e)In Eq. (7a), Ib is the dc background signal. Hence 2 ( I1 I3 2 I2 ) I1 I 3 ρ0 cos Δ 12(8a)I1 3I 3 2 ( I 1 I 3 )( I 1 I 3 2 I 2 ) 12(8b)or 9 ( I1 I 3 2 I2 ) 2 ( 2 I 1 I 2 4 I 4 ) ρ0 cos Δ 12(9a)3 ( I1 I3 ) 4 ( I2 4 I 4 ) 8 ( I 1 I 3 )( I 1 I 3 2 I 2 ) 12(9b)As for bulk material measured at the incident angle in the air, the dielectric constant ε ofthe sample can be calculated directly from the ellipsometry parameters as follows: 1 ρ ε 1 iε 2 1 ρ ε sin 2 θ sin 2 θ tan 2 θ www.intechopen.com2(10)
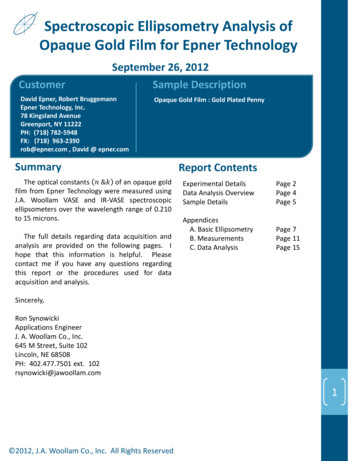
57Ellipsometry and Its Applications in StoichiometryWhere ρ tanΨ exp(i ). ε1, ε2 are the real part and imaginary part of the dielectric constantrespectively. The refractive index n and absorption coefficient k can be obtained by:n 1 2ε 1 ε 222 )1/2 ε 1 k 1 2ε 1 ε 222 )1/2 ε 1 ((1/2(11a)1/2(11b)The optical system of RPAE is shown schematically in Fig. 4. A Hilger DU560 high-intensity0.5-m-grating (1200-line/mm) monochromator produced the quasi-mono-chromatic lightwith a continuum light source provided by a 100 W quartz halogen filament lamp in the350-800 nm range. The light from the lamp house was conducted by a fused-silica fiber-opticcable to the monochromator. The analyzer and two polarizers were improved types ofGlan-Foucault calcite prisms, which were air-gapped in design so that the spectral responsecould be extended to the UV range if the short-arc xenon lamp were used. The prisms werespecially made and strictly tested to have a center transmitted beam deviation of 1 min.Fig. 4. Schematic diagram of the optical and controlling system of the RPAE: 1, lightcollimating lens; 2, the first fixed polarizer P0; 3, 4, rotating analyzer and polarizer,respectively, directly mounted on the shafts of the stepping motors; 5, stepping motors withhollow shafts; 6, light-shielding boxes; 7, sample; 8, mirrors that guide the laser beam forsample alignment; 9, rotating table connected to the arm that holds the analyzer andphotomultiplier (P.M.T.); 10, rotating table connected to the sample-mounting stage; 11,fused-silica fiber-optic cable.To have fewer parts and to avoid mechanical transmission problems entirely, the rotatinganalyzer A and polarizer P were directly mounted onto the motor shafts, which werewww.intechopen.com
58Stoichiometry and Materials Science – When Numbers Matterhollow to let light pass through. The outer and inner diameters of the shafts are 9 and 5mm, respectively. The probe beam size is 3 mm in diameter adjusted by the axis-centerediris diaphragms. In the experiment, the analyzer and polarizer were driven synchronouslyby two microstepping motors with 104 microsteps/revolution, i.e., with a resolution of0.036 deg/step, instead of with timing belts. Hence the arm, which holds the analyzer andphotomultiplier, can move freely according to the incident angle set by the users. Asshown in Fig. 4, the arm holding the two polarizers is fixed. The arm, on which theanalyzer and photomultiplier with an S20 response are mounted, is connected to thelower rotating table. The sample stage sits on the upper rotating table. The two rotatingtables are concentric. In the experiments both rotating tables are driven by two steppingmotors to positions exactly coincident with the incident angle with a computer-controlledresolution of 0.001 . The entire optical system is mounted firmly on an optical vibrationisolation table.3. Data processing for ellipsometryOptical constants of samples are determined from the change in the polarization state byreflection (or transmission) in ellipsometry. The ellipsometry parameters ( , ) representthe amplitude ratio and phase difference between p- and s-polarization. However,ellipsometry parameters generally show complicated variations with changes in opticalconstants and film thicknesses for the investigated samples. Since the ellipsometryparameters can’t be related to what we interested directly, some mathematical analysisshould be done to get information such as dielectric function, film thickness and so on.3.1 Effective medium approximationEllipsometry is very sensitive to sample surface and interface structures. Hence, toincorporate these structures into an optical model for the investigated sample is necessary inellipsometry data analysis. The effective medium approximation (EMA) [66] has beenapplied to calculating the complex refractive indices and dielectric constants of surfaceroughness and interface layers. In addition, the volume fractions in composite materials canbe got from ellipsometry analysis using EMA.A general equation that describes the EMA model is:ε j εhε εh fjε Yεhεj Yε hj(12)Where, εj and fj are the dielectric function and volume fraction, respectively of jth material.The quantities ε and εh are the dielectric functions of the effective medium and the hostrespectively. Y is a factor related to screening and shape of the inclusion.According to the above EMA equation structure, the difference of different EMA modelsdepends on the choice of the host material.For example, the Maxwell-Garnett model just sets the first material which has the largestvolume fraction to be the host material (εh ε1) and then the EMA equation reduces to:www.intechopen.com
59Ellipsometry and Its Applications in Stoichiometryε j ε1ε ε1 fjε Y ε1εj Y ε1j(13)The Bruggeman model assumes that the host material is just the EMA dielectric function(εh ε) which is self-consistent. For the Bruggeman model the EMA equation reduces to: fj εε j ε1 0j Y ε1j(14)The Lorentz-Lorenz model is obtained when the host material is chosen as air or vacuum(εh 1). The EMA equation reduces to:ε j 1ε 1 fjε Yεj Yj(15)3.2 Dielectric function modelsOptical constants are closely related to the wavelength of incident light, and it is known asthe dispersion relation. In the analysis of ellipsometry data, it is an important step to selectappropriate dispersion model for the investigated samples if the dielectric function isunknown.The Lorentz oscillator model is a classical model which is usually used to describe thedispersion relation of semiconductor and crystalline materials. [6, 7, 67, 68] On the basis ofthis model, the dielectric function is usually expressed asε (E) 1 jAjE02 j E 2 iΓ j E(16)It assumes that this material is a sum of the j oscillators. In above expression, the Aj is thestrength of jth oscillator in unit of eV2, is the damping coefficient in unit of eV, E0j in unit ofeV is the jth oscillator resonance energy and E is the energy of the light.Sellmeier model is another model first proposed by W. Sellmeier in 1871. It is best suited totransparent materials such as SiO2, MgF2, TiO2, BK7 optical glass and so on. It can also beused for germanium, silicon, gallium arsenide, etc. in infrared spectra region. In theSellmeier model, the dielectric function can be regarded as a special region of Lorentz modelwhose ε2 is 0. It can be expressed by equations:ε1 n 2 A jε2 0B jλ 22λ λ02 j(17a)(17b)Cauchy model is regarded as an approximate function of Sellmeier model. It was anempirical model first proposed by A. L. Cauchy. The equation of the model is expressed as:www.intechopen.com
60Stoichiometry and Materials Science – When Numbers Mattern (λ ) A B λ2Cλ4 . , k 0’(18)The Drude model is best suited to metallic materials such as Al and Au. It tries to explainthe properties of metals with the idea that electrons move free between positively chargedionic cores. The dielectric function can be expressed as:ε (E) 1 jBj 1 E E iΓ j . (19)Usually one single term is sufficient for accuracy and the following equation is used: ε ε 1 E ( E iv) E 2pWhere, ε is the high-frequency lattice dielectric constant, Ep ħfrequency and ν is the electron scattering frequency.(20)p,pis the plasma angularThe Forouhi-Bloomer (F-B) theory is first proposed by A. R. Forouhi and I. Bloomer in 1986[67]. It is applied to parameterize the optical functions of amorphous materials. In theirwork, they obtained the extinction coefficient k starting from the single electron model withlimited excited lifetime. The extinction coefficient k is given by:k (E) qAi ( E E g )2i 1E 2 Bi E Ci(21)Where Ai, Bi, Ci and band gap Eg are fitting parameters. Then the refractive index ndetermined by Kramers-Kronig integration is as follows:n ( E ) n ( ) B0i qB0i E C0ii 1E 2 Bi E Ci Ai Bi2 Eg Bi Eg2 Ci , Qi 2 C0i AiQiBi 2 ( Eg Ci ) 2 2 Eg Ci , 1Qi (4Ci Bi2 )1/ 2 .2(22)(23)(24)(25)The difference between F-B model and classical models is that when E goes large, the k(E)approaches constant and the refractive index n is larger than 1. It is unphysical.www.intechopen.com
61Ellipsometry and Its Applications in StoichiometryAnother model for optical functions of amorphous materials is Tauc-Lorentz (T-L) modelwhich is first proposed by G. E. Jellison et al. in 1996 [68]. The parameterization is obtainedas a combination of Tauc expression and Lorentz oscillator model for ε2 of a collection ofnon-interacting atoms, and ε2(E) is given byε 2 (E) AE0Γ( E E g ) 2E[( E 2 E02 )2 Γ 2 E 2 ]Θ( E Eg ),(26)Where, E0 is the peak transition energy and is the broadening parameter, Eg is the bandgap and A is the prefactor. Θ is the Heaviside Theta function, where Θ(E 0) 0 andΘ(E 0) 1.Although the T-L expression is empirical, it is consistent with Kramers-Kronig relations andthe known physical phenomena, within the limitation of the model.3.3 Data analysis procedureThe ellipsometry data analysis procedure consists of the following steps [6,7]:1.2.3.Constructing an optical model. In the data analysis procedure in ellipsometry, anoptical model corresponding to the investigated sample structures must be constructedfirstly. An optical model is represented by the complex refractive index and layerthickness of each layer, normally, it consists of an air/thin film/substrate structure. Itshould be decided if any layer is anisotropic at this stage, and whether or not interfacelayers are to be modeled as a single effective medium approximation, or is a morecomplicated graded interface to be used for the sample.Selecting the dielectric functions model for each layer. In some cases, the existing datasets or some kind of parameterization are used. However, the dielectric functions oflayers are normally not known, and the dielectric function models described in section3.2 are employed.Fitting the measured ( , ) spectra and evaluating th
polarized light Elliptically polarized light Fig. 1. Reflection of p- and s-polarized light Usually the samples are multilayered thin films, and the purpose of ellipsometry measurement is to get the film structure and optical constants from the measured ellipsometry parameters, such as the refractive in dex, extinction coefficient, and .Cited by: 1Publish Year: 2012Author: Yu-Xiang Zhen