Transcription
CHAPTER41Using ASA FirePOWER ReportingYou can view reports on various time periods to analyze the traffic on your network. Reports aggregateinformation on various aspects of your network traffic. In most cases, you can drill down from generalinformation to specific information. For example, you can view a report on all users, then view detailsabout specific users.Overview and detail reports include multiple report components such as top policies and web categories.These reports show the most often occurring items of that type for the report you are viewing. Forexample, if you are viewing the detail report for a specific user, the top policies show the policy hitsmost associated with that user.For more information, see: Understanding Available Reports, page 41-1 Report Basics, page 41-2 Example Report, page 41-6Understanding Available ReportsLicense: AnyAvailable reports include the main reports available in the ASA FirePOWER module. You can viewthese reports from the ASA FirePOWER Reporting menu.In general, you can click on many items, including names and View More links, to get more detailedinformation about individual items or about the monitored category as a whole.Network OverviewThis report shows summary information about the traffic in the network. Use this information tohelp identify areas that need deeper analysis, or to verify that the network is behaving within generalexpectations.UsersThis report shows the top users of your network. Use this information to help identify anomalousactivity for a user.TipUser names are available only when user identity information is associated with traffic flows. Ifyou want to ensure that user identity is available in reports for the majority of traffic, the accesscontrol policy should use active authentication.Cisco ASA with FirePOWER Services Local Management Configuration Guide41-1
Chapter 41Using ASA FirePOWER ReportingReport BasicsApplicationsThis report displays applications, which represent the content or requested URL for HTTP trafficdetected in the traffic that triggered an intrusion event. Note that if the module detects an applicationprotocol of HTTP, but cannot detect a specific web application, the module supplies a generic webbrowsing designation here.Web categoriesThis report shows which categories of web sites, such as gambling, advertisements, or searchengines and portals are being used in the network based on the categorization of web sites visited.Use this information to help identify the top categories visited by users and to determine whetheryour access control policies are sufficiently blocking undesired categories.PoliciesThis report shows how your access control policies have been applied to traffic in the network. Usethis information to help evaluate policy efficacy.Ingress zonesThis report displays the ingress security zone of the packet that triggered an event.Egress zonesThis report displays the egress security zone of the packet that triggered the event.DestinationsThis report shows which applications, such as Facebook, are being used in the network based on theanalysis of the traffic in the network. Use this information to help identify the top applications usedin the network and to determine whether additional access control policies are needed to reduce theusage of unwanted applications.AttackersThis report displays the source IP addresses, used by the sending hosts, that triggered an event.TargetsThis report displays the destination IP addresses, used by the receiving hosts, that triggered an event.ThreatsThis report displays the unique identifying number and explanatory text assigned to each detectedthreat to your network.Files logsThis report displays the type of files detected, for example, HTML or MSEXE.Report BasicsLicense: AnyThe following sections explain the basics of using reports. These topics apply to reports in general andnot to any single specific report.For more information, see:Cisco ASA with FirePOWER Services Local Management Configuration Guide41-2
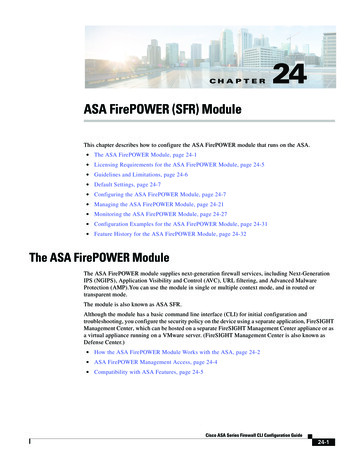
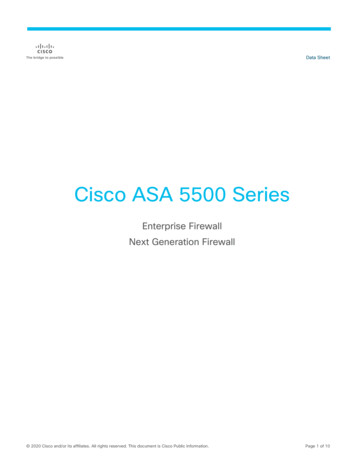
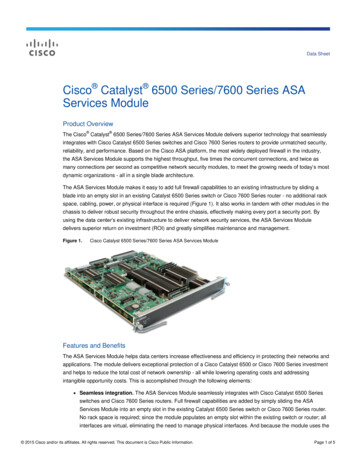
Chapter 41Using ASA FirePOWER ReportingReport Basics Getting Started with Reports, page 41-3 Understanding Report Data, page 41-3 Drilling into Reports, page 41-4 Changing the Report Time Range, page 41-4 Controlling the Data Displayed in Reports, page 41-5 Understanding Report Columns, page 41-5Getting Started with ReportsTo run reports, log in to your ASA FirePOWER module and click Home ASA FirePOWERReporting. Available report types are displayed across the top of the window as the following figureshows.Following is an example of the Network Overview report. Click any underlined text to get moreinformation about it.Understanding Report DataLicense: AnyReport data is collected immediately from the device, so there is little lag time between the data reflectedin a report and network activity. However, keep the following points in mind when analyzing the data:Cisco ASA with FirePOWER Services Local Management Configuration Guide41-3
Chapter 41Using ASA FirePOWER ReportingReport Basics Data is collected for traffic that matches an access control policy applied to your ASA FirePOWERmodule. Data is aggregated into 5 minute buckets, and 30 minute and one hour graphs show data points in 5minute increments. At the end of the hour, the 5 minute buckets are aggregated into one hourbuckets, which are subsequently aggregated into day and week buckets. The 5 minute buckets arekept for 7 days, the one hour buckets for 31 days, and the day buckets for up to 365 days. The fartherback you look, the more aggregated the data. When you query for old data, you get the best resultsif you align your queries to the availability of these data buckets.NoteIf a data point is missing, for example, because the device was unreachable for longer than 5minutes, there will be gaps in line charts.Drilling into ReportsLicense: AnyReports include many links to help you drill down to the information that you need. Mouse over itemsto see which ones might take you to more information about the item.For example, in a typical reporting item, you can click the View More link to go to the summary reportfor that item.You can also get to a detail report on a specific item by clicking the item in a summary report. Forexample, clicking Hypertext Transfer Protocol (HTTP) in the applications summary report takes you tothe applications detail report for HTTP.Changing the Report Time RangeLicense: AnyWhen you view a report, you can change the time range that defines the information to include in thereport using the Time Range list. The time range list appears at the top of each report, and allows you toselect predefined time ranges, such as the last hour or week, or to define a custom time range withspecific start and end times. The time range you select is carried over to any other report that you viewuntil you change the selection.Reports automatically update every 10 minutes.The following table explains the time range options.Table 41-1Time Ranges for reportsTime RangeData Returned InLast 30 minutes30 complete minutes in five minute intervals, plus up to five additionalminutes.Last hour60 complete minutes in five minute intervals, plus up to five additionalminutes.Last 24 hoursOne hour intervals for the last 24 hours rounded to the previous hourboundary. For example, if the current time is 13:45, the Last 24 Hour periodis from 13:00 yesterday to 13:00 today.Cisco ASA with FirePOWER Services Local Management Configuration Guide41-4
Chapter 41Using ASA FirePOWER ReportingReport BasicsTime RangeData Returned InLast 7 daysOne hour intervals for the last seven days rounded to the previous hourboundary.Last 30 daysOne day intervals for the last 30 days starting from the previous midnight.Custom RangeThe time range you define. Edit boxes are displayed for start date, start time,end date, and end time; click in each box and select the desired value. ClickApply to update the report when you are finished.When constructing a custom time range, you should align your range withthe availability of data buckets. For ranges 7-31 days in the past, align yourquery on the hour. For older ranges, align them on the day; for ranges over ayear, align them on the week.Controlling the Data Displayed in ReportsLicense: AnyOverview and detail reports include several subordinate reports such as Top Policies and WebCategories. Each report panel includes controls that let you view different aspects of the data. You canuse the following controls:Transactions or Data UsageClick these links to view charts based on the number of transactions or the amount of data in thetransactions.All, Denied, AllowedThe unlabeled list in the upper right of each report includes these options. Use them to change whetheryou see denied connections only, allowed connections only, or all connections whether denied orallowed.View MoreClick the View More link to go to the report for the item you are viewing. For example, clicking ViewMore in the Web Categories chart of the Destinations report takes you to the Web Categories report. Ifyou are viewing the report in a detailed report, you go to the detailed Web Categories report for the itemyou are viewing details about.Understanding Report ColumnsLicense: AnyReports typically contain one or more tables to present information in addition to the informationdisplayed in graphical format. The meaning of many columns is modified by the report in which they are included. For example,the transactions column shows the number of transactions for the type of item reported on. You canalso toggle the values between raw numbers and as a percentage of the total reported raw values forthe item by clicking Values or Percentages. You can change the sort order of the columns by clicking the column heading.The following table explains the standard columns that you can find in the various reports.Cisco ASA with FirePOWER Services Local Management Configuration Guide41-5
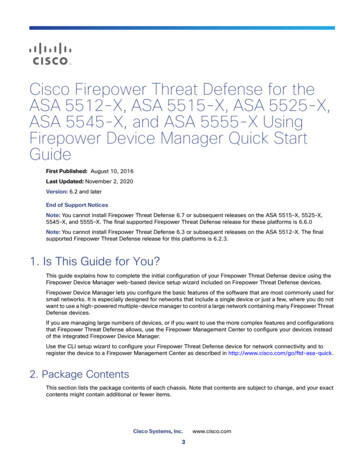
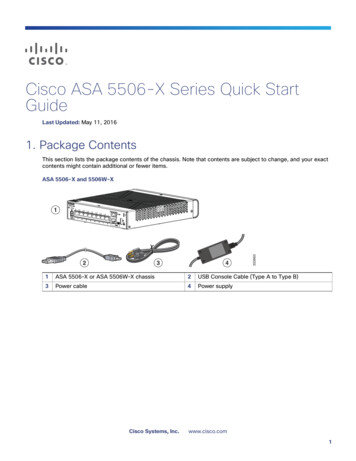
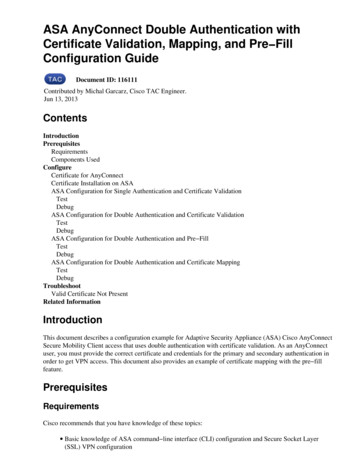
Chapter 41Using ASA FirePOWER ReportingExample ReportTable 41-2Report ColumnsColumnDescriptionTransactionsThe total number of transactions for the reported item.Transactions allowedThe number of transactions that were allowed for the reported item.Transactions deniedThe number of transactions that were blocked (based on policy) forthe reported item.Total bytesThe sum of bytes sent and received for the reported item.Bytes receivedThe number of bytes received for the reported item.Total Bytes SentThe number of bytes sent for the reported item.Example ReportThis section discusses how to run the Policies report. You can use the tasks discussed in this procedureto run any other reports you wish.To run reports:Step 1Log in to your ASA FirePOWER module.Step 2Click Home ASA FirePOWER Reporting.Available report types are displayed across the top of the window as the following figure shows.Step 3Many reports enable you to view details about categories contained in the report. For example, clickNetwork Overview.Cisco ASA with FirePOWER Services Local Management Configuration Guide41-6
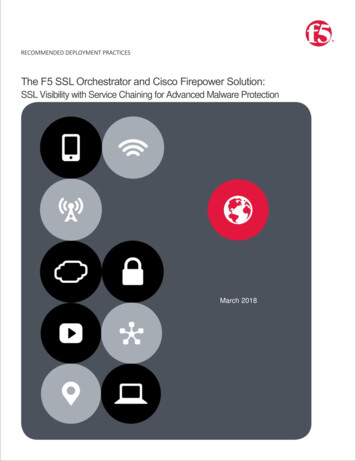
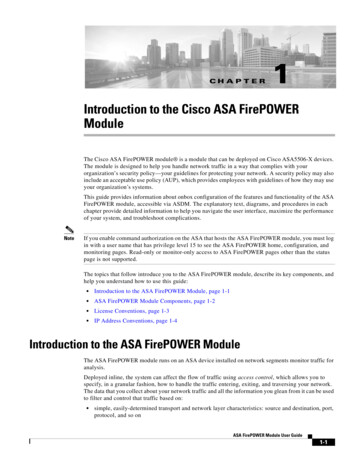
Chapter 41Using ASA FirePOWER ReportingExample ReportStep 4In the Network Overview report results, click the name of any Top Destinations to get more informationabout destinations.The results display summary information and details about the destinations.Cisco ASA with FirePOWER Services Local Management Configuration Guide41-7
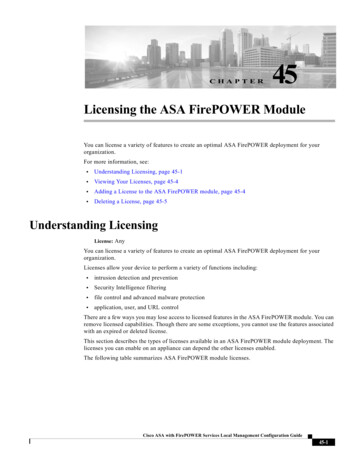
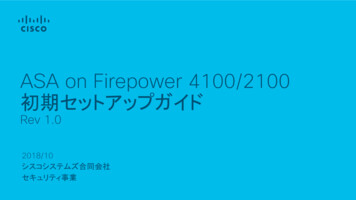
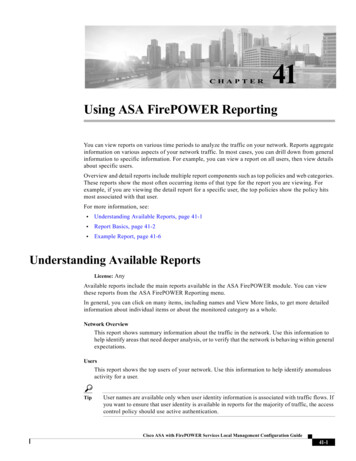
Chapter 41Example ReportStep 5(Optional.) Click View More to view additional details.Cisco ASA with FirePOWER Services Local Management Configuration Guide41-8Using ASA FirePOWER Reporting
Cisco ASA with FirePOWER Services Local Management Configuration Guide Chapter 41 Using ASA FirePOWER Reporting Report Basics Applications This report displays applications, which represent the content or requested URL for HTTP traffic detected in the traffic that triggered an intrusion event. Note that if the module detects an application