Transcription
5Spectroscopic Ellipsometry ofIon-Implantation-Induced DamageDenis Shamiryan and Dmitriy V. LikhachevGlobalfoundries, DresdenGermany1. IntroductionIn modern semiconductor manufacturing ion implantation requires precise control and sucha control is impossible without adequate measurements of the implanted media. As theglobal trend of miniaturization dictates continuous decrease of the energy and dose of theimplants, the measurement precision should match stricter requirements.Well-established analysis techniques, including secondary ions mass-spectrometry (SIMS)(Benninghoven et al., 1987; Brundle et al., 1992; Alford et al., 2007), high-resolutiontransmission electron microscopy (HRTEM) (Hirsch et al., 1977; Horiuchi, 1994; Williams &Carter, 2009) allow direct observation of the effect of ion implantation, although they sufferfrom being destructive, time consuming and unusable for real-time in-line monitoring of ionimplantation process or to measure uniformity. Some of the more common methods, likesheet resistance measurements (four-point probe, FPP) (Keenan et al., 1985; Johnson, 2001;Schroder, 2006) and thermal-wave technology (TW) (Smith et al., 1985; Guidotti & van Driel,1985; Smith et al., 1986), are fast and relatively inexpensive, but require special efforts inorder to get reliable information and exclude measurement errors. Ideally, the techniqueshould be non-destructive to the sample, fast, accurate and precise to be used for routineprocess monitoring and control.Among various characterization methods, ellipsometry is a fast, non-intrusive andinformative technique that is sensitive to changes in optical properties and thicknesses ofthin films. As ion implantation significantly changes optical properties of many materials(especially, crystalline), the ellipsometry is one of the most suitable technique for monitoringthe results of ion implantation with no special sample preparation requirements.Ellipsometric analysis is able to detect and characterize the degree of crystallinity in buriedlayers as well as depth profiling in the sample. Besides the crystalline substrates, theellipsometry is able to measure crust, formed on top of photoresist during masked ionimplantation. The crust often poses a problem in post ion implantation photoresist strip andits characterization is important for optimization of strip processes.Ellipsometry of implanted crystalline substrates is based on the fact that those substrates areamorphized and amorphous medium has very different optical properties from thecrystalline one. In traditional models, ion-beam-induced amorphization occurs as a phasetransition induced by adequate number of point defects created by individual ions (point-www.intechopen.com
90Ion Implantationdefect concentration exceeds some critical value; homogeneous amorphization) or theformation of continuous amorphous layer is due to overlapping of isolated damagedregions (heterogeneous amorphization) (Pelaz et al., 2004). Despite numerous studies, themechanisms of amorphization by ion implantation are still under intensive investigations.Currently, various numerical simulations for ion implantation processes, like Monte-Carlo(MC) and molecular dynamics (MD) techniques, have been widely used to reconstruct theamorphization profiles (Sigmund, 2004; Ziegler et al., 2010; Nordlund, 1995; Beardmore &Grønbech-Jensen, 1998).The amorphization depends on the crystalline medium, implanted elements, energy anddose of the implantation. There are number of papers describing dependence of the opticalproperties and depth of the amorphized layer on the processing conditions. However, therecent results indicate that even for rather low-energy low dose implants (with energy ofseveral keV, dose around 1015 ions/cm2), which do not cause amorphization, the changes ofthe optical properties of the implanted crystalline semiconductor are significant and can bedetected by ellipsometry. The implantation depth measured by ellipsometry corresponds todirect observations of distorted crystalline lattice by TEM. These results allow extension ofthe ellipsometry capabilities toward the lower limits of energy and dose, where noamorphization occurs.Ellipsometric measurements of the photoresist crust formation are based on the fact thatenergetic ions remove lighter photoresist fraction leaving behind graphite-like carbon-richlayer. Having optical properties different from those of the bulk photoresist, such a layercould be measured by ellipsometry. It should be noted, however, that with reduction ofdose and energy of the ion implantation, the formation of this layer is less pronounced andit causes less issues in post ion implantation photoresist strip.In the chapter, a short overview of ellipsometry principles is given in section 2. Theapplication of ellipsometry to investigate ion implantation of crystalline and polycrystallinesilicon is reviewed in section 3. The recent results obtained on very shallow low-doseimplantation are also presented. Finally, summary and future perspectives are presented insection 4.2. Fundamentals of ellipsometryIn this section, a very brief overview of the ellipsometry principles is presented. For muchmore extended and detailed up-to-date discussion on fundamental principles ofellipsometry, instrumentations, data analysis as well as multiple applications, see(Tompkins, 1993; Tompkins & McGahan, 1999; Tompkins & Irene (Eds.), 2005; Fujiwara,2007; Losurdo et al., 2009; Azzam, 2010).Ellipsometry (reflection polarimetry; single-wavelength as well as spectroscopic) is anoptical measurement technique for evaluation geometrical and material properties ofsubstrates, thin films and multilayer structures. Determination of fundamental opticalproperties (complex dielectric functions (ε) or complex refractive indexes (N)) gives anopportunity to characterize other important material properties such as composition, phasestructure, doping, stress, uniformity, electrical properties, etc. The principles of thistechnique as well as first applications have been established in the late 19th century but itwww.intechopen.com
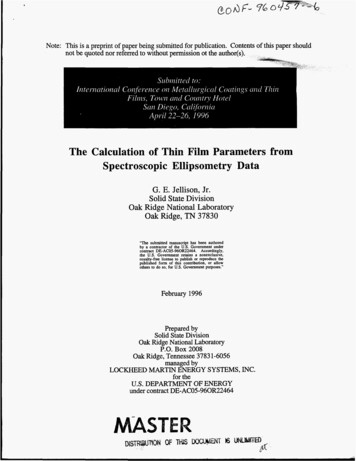
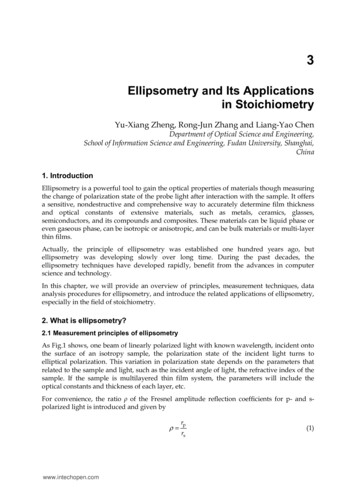
91Spectroscopic Ellipsometry of Ion-Implantation-Induced Damagebecame widely utilized only in 1960s and 1970s due to significant developments in theinstrumentation, computers and data analysis algorithms (Azzam & Bashara, 1977; Rzhanovet al., 1979; Theeten & Aspnes, 1981; Riedling, 1988; Azzam (Ed.), 1991).Ellipsometry measures the changes in the polarization state of light upon reflection from asample surface at non-normal (oblique) incidence (although transmission ellipsometry atnormal incidence can be used for optically anisotropic samples) and those changes typicallyexpressed in terms of two values (ellipsometric angles) called Psi (Ψ) and Delta ( ). Theserepresent an amplitude ratio and relative phase shift between p- and s-components of thepolarized light1 which are induced by reflection from the sample (see Fig. 1).Incident waveEReflected waveE rsE ipLightsourceθE isθE rpPlane of sampleφPlane of incidenceRefracted waveFig. 1. Scheme showing the basic principle of ellipsometry: linearly polarized light with pand s-components at oblique incidence is reflected and it becomes elliptically polarized. Theparameters of the resulting ellipse depend on the initial direction of polarization, the angleof incidence and the optical properties of the surface. Eip, Eis, Erp, and Ers represent the pand s-components of the incident (i) and reflected (r) light waves.The measured quantities Ψ and are described by the fundamental equation ofellipsometry tan( )ei Erp Rs Eip Rp Ers , Eis (1)where Rp and Rs are the Fresnel reflection coefficients for the p- and s-polarized light,respectively. The reflection coefficients are directly related to the optical properties of thesample. In the simple case of single thin film on substrate (see Fig. 2), can be described asa function tan( )ei f ( N 0 , N 1 , N 2 , 0 , d ),(2)1 The term “p-polarization“ was taken from the German word “parallel“ since this component of theelectric field Ep is parallel to the plane of incidence. The component perpendicular to this plane, Es,was named “s-polarization“ and derived from the German word “senkrecht“ (perpendicular).www.intechopen.com
92Ion Implantationwhere N n ik is the complex index of refraction.2θ0N0N1N2θ1dθ2Fig. 2. Three-phase (ambient/film/substrate) optical model.There are two major flavours of ellipsometric technique. Single-wavelength ellipsometry(SWE) uses a monochromatic light source (typically, high-intensity probe beam from HeNelaser with a wavelength of 632.8 nm) which results in only single set of ellipsometricparameters (Ψ, ). Multi-wavelength approach or spectroscopic ellipsometry (SE) involvesmeasurements of Ψ and as functions of wavelength (Tompkins & McGahan, 1999;Fujiwara, 2007). Therefore, the SE determines the complex index of refraction as a functionof wavelength (material dispersion; N f( )). This is definitely an advantage of the SE ascompared with SWE since knowledge of the n and k spectra is very helpful in establishingthe correlations to various physical and chemical properties of the materials (for instance,the ultraviolet (UV) range of the n and k spectra allows us to determine the degree ofcrystallinity in polycrystalline silicon or, together with visible range, to ascertain SiGestoichiometry). In variable-angle spectroscopic ellipsometry (VASE), a variant of the SE, theellipsometric angles Ψ and are measured as functions of both wavelength and angle ofincidence (AOI) which results in higher sensitivity and accuracy due to additional opticalpaths for various AOI’s (Woollam, 1999 ; Woollam et al., 1999 ; Johs et al., 1999).The real part of N, namely n, is the conventional refractive index. The imaginary part of N,namely k, is called the extinction coefficient and it is directly related to the absorptioncoefficient of the medium: 4 k where is the free-space wavelength of light.These two wavelength-dependent quantities are often called the “optical constants” of thematerial, although they are not constants in fact but depend, in addition to the (or light2 Here we follow the traditional ellipsometric convention which defines the imaginary part of N with a„minus“ sign („The Nebraska Convention“, 1968; see (Muller, 1969; Holm, 1991; Bennett, 2010)). Inother areas of physics the complex index of refraction is defined with a „plus“ sign.www.intechopen.com
Spectroscopic Ellipsometry of Ion-Implantation-Induced Damage93frequency), also on material’s conditions. The “optical constants” can be considered asintrinsic properties of the material which completely characterize material’s optical response.There is an equivalent approach to describe the optical properties in terms of the complexdielectric function ε (sometimes also called “complex dielectric constant”): 1 i 2 .The complex index of refraction N and complex dielectric function ε are related to each otherthrough the following relation derived from Maxwell’s equations: N2.Therefore, 1 n2 k 2 , 2 2 nkand 121 1 12 22,2121 1 12 22.k 2n The fact that ellipsometry measures the changes in polarization (rather than the absolutelight intensity or absolute phase) makes it highly accurate, robust and very reproducibletechnique. Presence of “phase” information ( ) also makes ellipsometric measurementsextremely sensitive for the analysis of surfaces.Experimentally, the ellipsometric parameters Ψ and can be determined with very highprecision. However, the next step, namely, extraction of required information (the opticalconstants n and k and film thickness(-es)) from those measured values, requires adequateoptical model for calculations and it might be quit complicated to construct one in somecases. Thus, the ellipsometric technique is the indirect characterization method. 3 Then usinglinear regression analysis technique the film stack parameters are determined byminimizing fitting errors to the measured spectroellipsometric data using various errorfunctions (for more details on data analysis procedure see, for instance, (Jellison, 1993, 1998;Fujiwara, 2007)).3. Spectroscopic ellipsometry measurements on implanted silicon wafersIn the past few decades the spectroscopic ellipsometry was extensively used to investigateion implantation (Si , Ge , B , P , As , Ar , Xe , and N2 ) of crystalline and polycrystallinesilicon (Ibrahim & Bashara, 1972; Adams & Bashara, 1975; Adams, 1976; Jellison et al., 1981;Ohira & Itakura, 1982; Lohner et al., 1983; Vasquez et al., 1985; Vedam et al., 1985; Nguyen &Direct n and k extraction from the ellipsometric parameters Ψ and is only possible in case of flat,isotropic and homogeneous substrates (medium of semi-infinite thickness).3www.intechopen.com
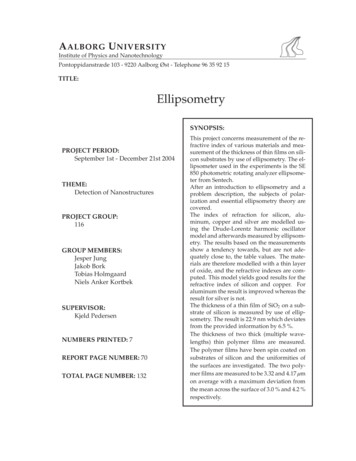
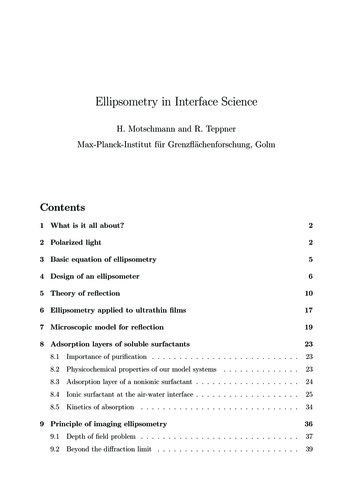
94Ion ImplantationVedam, 1990; Miyazaki & Adachi, 1993; Fried et al., 1992, 2004; Müller-Jahreis et al., 1995;Shibata et al., 1999, 2010; Giri et al., 2001; Tsunoda et al., 2002; Petrik et al., 2003; Yoshida etal., 2005; Stevens et al., 2006; Lioudakis et al., 2006a, 2006b; Petrik, 2008; Matsuda et al., 2010;Mohacsi et al., 2011). One of the motivations of that was to get non-contact, non-destructiveand rapid measurement technique with high accuracy and sensitivity for industrialapplications (in particular, for integrated circuits (IC) manufacturing). For instance,Vanhellemont et al. ([Van91], as cited in Petrik, 1999) claim that spectroscopic ellipsometry“can be considered as a non-destructive, cheap poor man's optical Rutherford backscatteringspectrometer and even as a one-dimensional optical high-resolution microscope”. With aproper optical model, calibrated to other analytical techniques, it is possible to nondestructively characterize damage depth profiles with various degrees of crystallinity aswell as effects of subsequent annealing of ion-implanted Si layers.Fig. 3. Realistic damaged depth profile models where the damaged regions are divided intosublayers: (a) with fixed thicknesses (Fried et al., 1992); (b) with thicknesses inverselyproportional to the slope of the profile (Petrik et al., 2003) (reprinted from (Petrik et al.,2008), with permission from Dr. P. Petrik).The usual way of describing the ion-implanted media includes two constituents. At first, theparametrization of the amorphization profile needs to be established. For instance, typicallayer structure for ion-damaged crystalline of polycrystalline Si consists of native oxide onthe top, an extensively damaged region where amorphization exceeds critical amorphizationdensity, and partially amorphous layer underneath. Those damaged regions can be dividedin sublayers with various ratios for crystalline and amorphous components. Verysophisticated damaged depth profile models were introduced (Fig. 3) in which coupled halfGaussian functions used to describe the damage levels in the sublayers with fixedthicknesses (Fried et al., 1992) or with thicknesses inversely proportional to the slope of theprofile (Petrik et al., 2003). Secondly, it is necessary to describe the optical properties of thedisordered layers or, in other words, parametrize the complex dielectric functions of suchlayers (sublayers). Typically, it can be modeled as a composition of crystalline (c-Si) andamorphous, ion-induced damaged (i-a-Si), phases using self-consistent Bruggeman effectivemedium approximation (B-EMA). Since dielectric functions of the amorphous silicon are notunique, various optical models can be selected to obtain its optical properties (for example,well-established Tauc-Lorentz (TL) optical model (Jellison & Modine, 1996a, 1996b) whichwww.intechopen.com
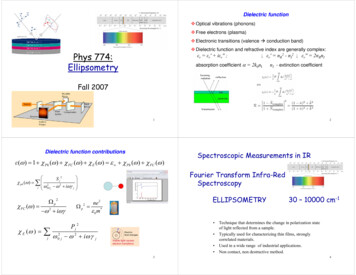
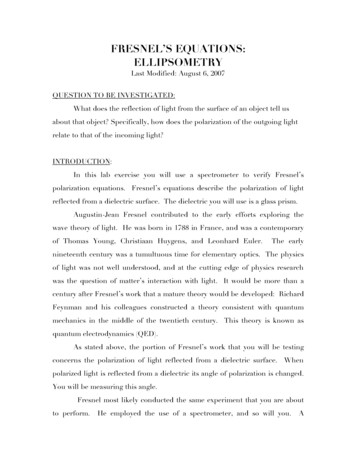
95Spectroscopic Ellipsometry of Ion-Implantation-Induced Damagehas been the most widely used parametrization of the optical functions for amorphousmaterials). 4However, even a simple model of the ion-damaged Si layer could be used forcharacterization of ion-implanted Si for semiconductor manufacturing, where therobustness and the speed of measurements are the key factors. The measurements are basedon the fact that the top part of the crystalline Si is amorphized by high energy ions and sinceamorphous Si (a-Si), crystalline Si (c-Si) and SiO2 (which inevitably exists on top of Si afterexposure to air) have very distinctive optical properties, as shown in Fig. 4.(a)(b)Fig. 4. Dispersions of the refractive index n (a) and the extinction coefficient k (b) ofcrystalline Si, amorphous Si and SiO2. Extinction of SiO2 is zero in the plotted range.Significant difference in optical properties of those three layers allows thicknessesmeasurement of both the amorphized layer and SiO2 on top of the crystalline Si substrateafter ion implantation. It should be noted that the implantation energies in theaforementioned works are rather higher (10 keV or more) while modern ultra-shallowjunctions require implantation energy close to 1 keV or even less. At such low energies Simight not be amorphized but only damaged. However, recently published papers(Shamiryan et al., 2010; Radisic et al., 2009, 2010) demonstrated that spectroscopicellipsometry can be used for implanted Si measurements even in the case of low energy ionimplantation, when no Si amorphization is observed.Si implanted with B and As species at low energies (as specified in Table 1) was measuredby spectroscopic ellipsometry with a spectral range of 150–895 nm. The optical modelconsisted of a Si substrate and two layers: SiO2 on top and a damaged Si (d-Si) layer at the4 Recently, Ferlauto et al. suggested the Cody-Lorentz dispersion model which has a few advantagesover TL model and better describes the optical properties of some amorphous materials (see details in(Ferlauto et al., 2002)).www.intechopen.com
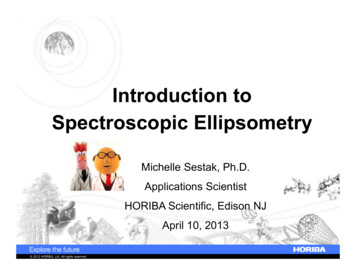
96Ion Implantationbottom. The SiO2 model was taken from library since the optical properties of SiO2 wereconsidered not modified by ion implantation as it has been reported that the change ofrefractive index of silica upon ion implantation does not exceed 1-2% (Bayly & Townsend,1973; Webb & Townsend, 1976). This could be easily explained by the fact that, unlike Sisubstrate, the SiO2 layer is already amorphous prior to ion implantation and energetic ionsdo not significantly change its state. The model for the damaged (implanted) Si layer wasbased on the a-Si model represented by a set of harmonic oscillators. In order to fit themodel to the measured spectra, the thickness of both SiO2 and d-Si were varied as well asoptical properties of the d-Si layer. After the implantation, besides ellipsometry, the sampleswere also inspected by transmission electron microscopy (TEM). This technique allowsdirect observation of the crystallinity of the layers and determination of their thicknessesusing interatomic distance as a reference.ElementEnergy, keVDose, cm-2Tilt, degreesB0.5; 1; 31.5x10157As1; 1.51.5x10157Table 1. Ion implantation conditions.After fitting of the two layer model to the ellipsometric data obtained after ion implantationit was found that the top damaged layer is indeed similar in optical properties toamorphous Si. Fig. 5 shows the n and k dispersions for As- and B-doped Si along with thedispersions for a-Si taken from the library. One can see that the dispersions of bothimplanted layers are closer to the a-Si than to c-Si (cf. Fig. 4).(a)(b)Fig. 5. Dispersions of n (a) and k (b) for a-Si (solid curve – taken from KLA-Tencor library)and for As (1 keV, 1.5x1015 cm-2)- and B (0.5 keV, 1.5x1015 cm-2) -doped Si (circles andtriangles, respectively) as measured by SE.www.intechopen.com
Spectroscopic Ellipsometry of Ion-Implantation-Induced Damage97TEM micrographs (Fig. 6) reveal that for implantation of B with energies of 0.5 keV and 1keV the Si substrate is not amorphized. However, the top implanted layer is still visible onTEM images due to strain induced by ion implantation. The thickness of this strained layeris in a good agreement with SE measurements. As implantation energy of B increases to 3keV, TEM images show two layers: a bottom strained layer and a top amorphous layer. Thetotal thickness of these two layers is in agreement with SE measurements. Similar resultswere obtained for As, but the top layer was amorphized even for the lowest studiedimplantation energy of 1 keV. Summary of TEM measurements and SE measurements isshown in Table 2. One can see that both d-Si and SiO2 measurements are in a goodagreement with TEM data.Fig. 6. TEM images of Si implanted with B at 0.5 keV (a) and 3 keV (b), the dose is 1.5x10¹⁵ inboth cases. All measurements on the images are in nm.From the comparison of the TEM and SE measurements we can make two importantconclusions:1.Even when the implanted Si is not amorphized, its optical properties changesignificantly, so it can be easily distinguished from c-Si.www.intechopen.com
982.Ion ImplantationSince the optical properties of the d-Si are close to those of a-Si (see Fig. 5) ellipsometrycan hardly distinguish between those two layers when they both are present at higherimplantation energies.Therefore, it is possible to measure thickness of the implanted Si layer even though it mightbe impossible to tell whether the implanted layer is just strained or amorphized.TechniqueTEMSETEMSEB implantation energy, keVAs implantation energy, keV0.5131.5SiO2 thickness (nm)2-2.72.4-2.62.1-2.92.32.8 0.12.4 0.12.5 0.12.7Damaged Si thickness (nm)3.5-5.57-1020-247-104.7 0.17.4 0.123.5 0.26.0Table 2. Summary of TEM and SE measurements of thickness of the implanted Si substrates.Fig. 7. Depth of the damaged Si as function of the implantation dose, as measured byellipsometry. The left panel shows all data, the right one shows the data obtained for lowenergies (less than 10 keV).The results of the ellipsometric measurements of ion-implanted monocrystalline Si areshown in Figures 7 and 8. One can see that there are detection limits above which theellipsometry can detect damaged Si layer. The detection limits depend on the dose, energyand ion mass. The dependence of the damaged layer thickness on dose is logarithmic (thethickness is proportional to the logarithm of the dose; see Fig. 7), while the dependence ofthe damaged thickness d on the ion energy E exhibits power dependence in the formd A Ex ,www.intechopen.com
Spectroscopic Ellipsometry of Ion-Implantation-Induced Damage99where A is a constant related to the implanted element, and x is the power factor in therange of 0.7-0.8 (see Fig. 8).Fig. 8. Depth of the damaged Si as function of the ion implantation energy, as measured byellipsometry.4. ConclusionIn this chapter the basic principles of ellipsometry as well as application of spectroscopicellipsometry to investigate ion implantation of crystalline and polycrystalline silicon havebeen reviewed. Spectroscopic ellipsometry can be used for characterization of ion-implantedcrystalline substrates before anneal. Ion implantation creates a damaged Si layer, whetheramorphized (for higher implantation energies) or just strained with a distorted lattice. SEcan measure this damaged layer since its optical properties in both cases (amorphization orlattice distortion) are similar and significantly different from the crystalline Si. Due tosimilarity in optical properties, SE cannot distinguish between amorphized and distorted Silayer.5. AcknowledgmentsThe authors would like to thank imec pilot line (Leuven, Belgium) for sample preparation,Dr. Andrey Zakharov for fruitful and spirited discussions and Dr. Manfred Mört for criticalreading of the manuscript and comments.6. ReferencesAdams, J. R. & Bashara, N. M. (1975). Determination of the complex refractive index profilesin P 31 ion implanted silicon by ellipsometry. Surface Science, Vol. 49, No. 2, (April1975), pp. 441-458, ISSN 0039-6028www.intechopen.com
100Ion ImplantationAdams, J. R. (1976). Complex refractive index and phosphorus concentration profiles in P 31ion implanted silicon by ellipsometry and auger electron spectroscopy. SurfaceScience, Vol. 56, (June 1976), pp. 307-315, ISSN 0039-6028Alford, T. L.; Feldman, L. C., & Mayer, J. W. (2007). Fundamentals of Nanoscale Film Analysis,Springer Science Business Media, Inc., ISBN 978-0-387-29260-1, New York, NY,U.S.A.Azzam, R. M. A. & Bashara, N. M. (1977). Ellipsometry and Polarized Light, North-HollandPublishing Co., ISBN 978-0-720-40694-8, New York, NY, U.S.A.Azzam, R. M. A. (Ed.) (1991). Selected Papers on Ellipsometry, SPIE Optical Engineering Press,ISBN 978-0-819-40571-5, Bellingham, WA, U.S.A.Azzam, R. M. A. (2010). Ellipsometry, In: Handbook of Optics, Vol.I. Geometrical and PhysicalOptics, Polarized Light, Components and Instruments, 3rd Ed., M. Bass, (Ed.), pp. 16.1–16.25, McGrow-Hill Companies, Inc., ISBN 978-0-071-62925-6, New York, NY,U.S.A.Bayly, A. R. & Townsend, P. D. (1973). Ellipsometric analysis of refractive index profilesproduced by ion implantation in silica glass. Journal of Physics D: Applied Physics,Vol. 6, No. 9, (June 1973) pp. 1115-1128, ISSN 0022-3727Beardmore, K. M. & Grønbech-Jensen, N. (1998). Efficient molecular dynamics scheme forthe calculation of dopant profiles due to ion implantation. Physical Review E, Vol.57, No. 6, (June 1998), pp. 7278–7287, ISSN 1539-3755Bennett, J. M. (2010). Polarization, In: Handbook of Optics, Vol.I. Geometrical and PhysicalOptics, Polarized Light, Components and Instruments, 3rd Ed., M. Bass, (Ed.), pp. 12.3–12.31, McGrow-Hill Companies, Inc., ISBN 978-0-071-62925-6, New York, NY,U.S.A.Benninghoven, A.; Rüdenauer, F. G., & Werner, H. W. (1987). Secondary Ion MassSpectrometry: Basic Concepts, Instrumental Aspects, Applications, and Trends, JohnWiley & Sons, Ltd, ISBN 978-0-471-01056-2, New York, NY, U.S.A.Brundle, C. R.; Evans, C. A., Jr., & Wilson, S. (1992). Encyclopedia of Materials Characterization:Surfaces, Interfaces, Thin Films, Butterworth-Heinemann & Manning PublicationsCo., ISBN 978- 0-750-69168-0, Boston, MA, U.S.A.Ferlauto, A.S.; Ferreira, G. M., Pearce, J. M., Wronski, C. R., Collins, R. W., Deng, X.,Ganguly, G. (2002). Analytical model for the optical functions of amorphoussemiconductors from the near-infrared to ultraviolet: Applications in thin filmphotovoltaics. Journal of Applied Physics, Vol. 92, No.5, (September 2002), pp. 24242436, ISSN 0021-8979Fried, M.; Lohner, T., Aarnink, W. A. M., Hanekamp, L. J., & van Silfhout, A. (1992).Nondestructive determination of damage depth profiles in ion‐implantedsemiconductors by spectroscopic ellipsometry using different optical models.Journal of Applied Physics, Vol. 71, No.6, (March 1992), pp. 2835-2843, ISSN 00218979Fried, M.; Petrik, P., Lohner, T., Khánh, N. Q., Polgár, O., & Gyulai, J. (2004). Dosedependence of ion implantation-caused damage in silicon measured byellipsometry and backscattering spectrometry. Thin Solid Films, Vol. 455-456, (May2004), pp. 404-409, ISSN 0040-6090Fujiwara, H. (2007). Spectroscopic Ellipsometry: Principles and Applications, John Wiley & Sons,Ltd, ISBN 978-0-470-01608-4, Chichester, UKwww.intechopen.com
Spectroscopic Ellipsometry of Ion-Implantation-Induced Damage101Giri, P. K.; Tripurasundari, S.; Raghavan, G.; Panigrahi, B. K.; Magudapathy, P.; Nair, K. G.M.; & Tyagi, A. K. (2001). Crystalline to amorphous transition and band structureevolution in ion-damaged silicon studied by spectroscopic ellipsometry. Journal ofApplied Physics, Vol. 90, No.2, (July 2001), pp. 659-669, ISSN 0021-8979Guidotti, D. & van Driel, H. M. (1985). Spatially resolved defect mapping in semiconductorsusing laser‐modulated thermoreflectance. Applied Physics Letters, Vol. 47, No. 12,(December 1985), pp. 1336-1338, ISSN 0003-6951Hirsch, P. B.; Howie, A., Nicholson, R. B., Pashley, D.W., & Whelan, M. J. (1977). ElectronMicroscopy of Thin Crystals (2nd Ed.), R. E. Krieger Pub. Co., ISBN 978-0-882-75376-8,Huntington, NY, U.S.A.Holm, R. T. (1991). Convention confusions, In: Handbook of Optical Constants of Solids II, E. D.Palik, (Ed.), pp. 21–55, Academic Press, ISBN 978-0-125-44422-2, San Diego, CA,U.S.A.Horiuchi, S. (1994). Fundamentals of High-Resolution Transmission Electron Microscopy, NorthHolland Publishing Co., ISBN 978-0–444–88744–3, Amsterdam, London, New York,TokyoIbrahim, M. M. & Bashara, N. M. (1972). Ellipsometric study of 400ev ion damage in silicon.Surface Science, Vol. 30, No. 3, (May 1972), pp. 632-640, ISSN 0039-6028Jellison, Jr., G. E. (1993). Data analysis for spectroscopic ellipsometry. Thin Solid Films, Vol.234, No.1-2, (October 1993), pp. 416-422, ISSN 0040-6090Jellison, Jr., G. E. (1998). Spectroscopic ellipsometry data analysis: measured versuscalculated quantities. Thin Solid Films, Vol. 313-314, (February 1998), pp. 33-39, ISSN0040-6090Jellison, Jr., G. E. & Modine, F. A. (1996a) Parametrization of the optical functions ofamorphous materials in the interband region. Applied Physics Letters, Vol. 69, No. 3,(July 1996), pp. 371-373, ISSN 0003-6951Jellison, Jr., G. E. & Modine, F. A. (1996b) Parametrization of the optical functions ofamorphous materials in the interband region. Applied Physics Letters, Vol. 69, No.14, (September 1996), p. 2137, ISSN 0003-6951Jellison, Jr., G. E.; Modine, F. A., White, C. W., Wood, R. F., & Young, R. T. (1981). Opticalproperties of heavily doped silicon between 1.5 and 4.1 eV. Physical Review Letters,Vol. 46, No. 21, (May 1981), pp. 1414–1417, ISSN 0031-9007Johnson, W. H. (2001). Sheet resistance measurements of interconnect films, In: Handbook ofSilicon Semiconductor Metrology, A. C. Diebold, (Ed.), pp. 215–244, Marcel Dekker,Inc., ISBN 978-0-824-70506-8, New York, NY, U.S.A.Johs, B. ; Woollam, J. A., Herzinger, C. M., Hilfiker, J., Synowicki, R., & Bungay, C. L. (1999).Overview of variable angle spectroscopic ellipsometry (VASE), Part II: Advancedapplications, Optical metrology, Proceedings of SPIE Conference, Vol. CR72, pp. 29-58,ISBN 978-0-819-43235-3, Denver, CO, U.S.A., July 18-19, 1999Keenan, W. A.; Johnson, W. H., & Smith, A. K. (
polarized light 1 which are induced by reflection from the sample (see Fig. 1). Fig. 1. Scheme showing the basic principle of ellipsometry: linearly polarized light with p- and s-components at oblique incidence is reflec ted an