Transcription
Note: This is a draft of a paper submitted for publication. Contents of this paper should notbe quoted or referred to without permission of the author(s).To be presented as an invited paper at theEuropean Materials Research Society 2003 Spring MeetingStrasbourg, FranceJune 10-13, 2003Generalized Ellipsometry for Materials CharacterizationG. E. Jellison, Jr.Condensed Matter Sciences DivisionOak Ridge National LaboratoryOak Ridge, TN 37831-6030Submitted June 2003The submitted manuscript has been authored by acontractor of the U.S. Government under contractNo. DE-AC05-00OR22725.Accordingly, theU.S. Government retains a nonexclusive, royaltyfree license to publish or reproduce the publishedform of this contribution, or allow others to d oso, for U.S. Government purposes."Prepared by theCONDENSED MATTER SCIENCES DIVISIONOAK RIDGE NATIONAL LABORATORYManaged byUT-BATTELLE, LLC, for theU.S. DEPARTMENT OF ENERGYUnder Contract No. DE-AC05-00OR22725
Generalized Ellipsometry for MaterialsCharacterizationG. E. Jellison, Jr.Condensed Matter Sciences DivisionOak Ridge National LaboratoryOak Ridge, TN 37831-6030AbstractEllipsometry experiments normally measure 2-4 parameters, which are converted tothe ellipsometric parameters ψ and . This is usually sufficient for many samples, butmore complicated situations (such as anisotropic or depolarizing samples) require moresophisticated measurements.Over the last 7 years, we have developed the two-modulator generalized ellipsometer(2-MGE), which measures 8 elements of the sample Mueller matrix simultaneously eitherin reflection or transmission. In reflection, the 2-MGE totally characterizes lightreflection from anisotropic samples, measuring the normal ellipsometry parameters, as
well as the cross-polarization and depolarization effects. Applications include thedetermination of the spectroscopic optical functions of uniaxial materials (such as TiO2and ZnO), and the measurement of cross-polarization from diffractive structures. Intransmission, the 2-MGE completely characterizes a general linear diattenuator andretarder. Applications include the measurement of the retardation and diattenuation offilm polarizers and internal electric fields in LiNbO3 and CdZnTe under bias.
1.IntroductionOptical measurements that conserve the wavelength (thus eliminating such processesas Raman scattering and photoluminescence) can generally be divided into threecategories, depending on the complexity of the measurement.1. Reflection and transmission measurements. These measurements determine thefraction of light intensity that is lost when the incident light beam is transmitted throughor is reflected from the front surface of a sample. The accuracy of this type ofmeasurement suffers from scattering losses and requires a very linear detector. Inaddition, reflection and transmission measurements are not sensitive to small phase shifts.2. Normal ellipsometry measurements. These experiments are polarizationsensitive, and determine ratios of certain characteristics of the reflected or transmittedlight for s- and p-polarized light. Traditionally, one measures characteristics of thereflection (or transmission) ratio:ρ rprs tan(ψ )e i (1)where rp (rs) is the complex reflection ratio for light polarized parallel (perpendicular) tothe plane of incidence. The angles ψ and are the traditional ellipsometry parameters,and are the naturally measured quantities in a nulling ellipsometry measurement. Modernspectroscopic ellipsometers measure 2 to 4 independent parameters. However, theseparameters1 are usually not ψ and directly, but rather elements of the sample Mueller
matrix, which are trigonometric functions of ψ and . As a result, normal ellipsometrymeasurements are usually not capable of measuring characteristics of very complicatedsamples that may contain depolarization or cross-polarization.3. Generalized ellipsometry measurements. These experiments2-6 are similar to thenormal ellipsometry experiments, but determine 8 to 15 elements of the sample Muellermatrix. Because of the complexity of the measurements, these experiments can deal withconsiderably more complicated situations, including depolarization, cross polarization inreflection measurements, and rotated diattenuators and retarders in transmission.In this paper, we will review the capabilities of reflection and transmissiongeneralized ellipsometry as performed by the two-modulator generalized ellipsometer (2MGE), as described in refs. 2. Although this instrument measures only 8 of the 15elements of the reduced sample Mueller matrix in each configuration, this is sufficient fora large number of experimental situations. In addition, 2-MGE measurements require nophysical rotation of an optical element during measurement, making registration veryaccurate: all measured parameters are taken at exactly the same point of the sample.2. Description of the 2-MGEThe 2-MGE system used for transmission ellipsometry measurements is described indetail in refs. 2 and 7. Briefly, it consists of two polarizer-photoelastic modulator (PEM)pairs, each operating at a different resonant frequency. One polarizer-PEM pair is usedas the polarization state generator (PSG) on the input arm of the ellipsometer, while theother is used as the polarization state analyzer (PSA) on the output arm of theellipsometer. The two PEMs are resonant devices that are cut to oscillate at different
frequencies ( 50 and 60 kHz in our case). Typically, the PEM operates with a Q inexcess of 10,000, making it a very stable device with respect to frequency variation. Thepolarizers are oriented at 45 with respect to the major oscillation axis of PEMs.The light intensity reaching the detector in any 2-MGE is a very complicated functionof time, but can be expressed as2Intensity (t) Idc IX0 X0 IY0 Y0 IX1 X1 IY1 Y1 IX0X1 X0 X1 IX0Y1 X0 Y1 IY0X1 Y0 X1 IY0Y1 Y0 Y1.(2a)The terms Idc, IX0, IY0, etc. are constants that multiply the basis functions:X0 sin (A0 sin (ω0t)),(2b)Y0 cos (A0 sin (ω0t)),(2c)X1 sin (A1 sin (ω1t)),(2d)Y1 cos (A1 sin (ω1t)).(2e)These basis functions are not just Fourier basis functions, but rather sines and cosines ofsines. The modulator amplitudes (A0 and A1) are measured in angular units (usuallyradians) and the modulator frequencies are given by ω0 and ω1.The information content of the data from the 2-MGE is contained in the 8 parametersIX0, IY0, etc. which can be easily normalized to the dc light intensity Idc. These 8parameters are then related directly to elements of the sample Mueller matrix, dependingonly upon the azimuthal angles of PSG and the PSA. The sample Mueller matrix is
represented by For example, if the PSG and PSA are oriented at (0 , 45 ) with respect tothe primary reference frame, the sample Mueller matrix is represented by 1 IM Y1 I X 1 IY 0 I Y 0Y 1 IY 0 X 1IX0 I X 0Y 1 , I X 0X1 (3)The dots in the matrices of Eq. 3 represent unmeasured quantities in that configuration,and the coefficient of the intensity waveform is placed at the Mueller matrix position ofthe measured element. By combining the results of these this configuration and theconfiguration where the PSG and PSA are oriented at (0 , 45 ) with respect to theprimary reference frame, then only the m22 and m33 components remain unmeasured.2.12-MGE in ReflectionThe above analysis is valid for the 2-MGE whether it is aligned in the reflection mode(normal ellipsometry configuration) or in the transmission mode. If the sample isisotropic in the reflection mode, allowing for simple depolarization, then the sampleMueller matrix is given by8 1 β NM 0 0where βNβ0000βC βS0 0 βS βC (4a)
N cos (2ψ)(4b)S sin (2ψ) sin ( )(4c)C sin (2ψ) cos ( )(4d)and β is the fraction of polarized light after the sample, called the polarization factor; β 1 for no depolarization. If the Mueller matrix elements m21, m43, and m44 are measured,then(m212 m432 m442) β2,(4e)thus measuring the polarization factor. Note that the elements of the sample Muellermatrix can only be reduced to the ψ representation if there is no depolarization. Ifthere is no depolarization, then equation 1 becomesρ rprs tan(ψ )e i C iS1 N(4f)For anisotropic samples in the reflection mode, the s- and p- polarizations are nolonger eigenmodes of reflection. That is, some of the incoming s-polarized light can beconverted to p-polarized light, and visa versa. These are expressed in terms of the crosspolarization reflection coefficients rsp and rps. If there is no depolarization, then theellipsometric data can be expressed in either the ψ representation, the ρ representation,or the NSC representation:ρ rpprss tan(ψ )e i C iS1 N(5a)
ρ ps ρ sp rpsrssrsprss tan(ψ ps )e tan(ψ sp )ei psi sp C ps iS ps1 NC sp iS sp1 N(5b)(5c)If the sample does partially depolarize the light, then the NSC representation must beused, and the depolarization factor β can be determined.1,22.22-MGE in TransmissionIn transmission for a linear diattenuator and retarder with no depolarization, thesample Mueller matrix is similar to that of the reflection Mueller matrix, but the meaningof the N, S, and C coefficients is considerably different. One additional degree offreedom for transmission measurements is that it is trivial to change the direction of theprincipal axis of the sample with respect to the reference frame of the instrument bysimply rotating it. In this case, the sample Mueller matrix is given by 1 C NM s Ss N 00 Cs N Ss N22C s S s C C s S s (1 C ) S s S ,C s S s (1 C ) C s2 S s2 CCs S Ss SC Cs S(6a)The quantity –N is the signed diattenuation, given byN Po Pe ,Po Pe(6b)
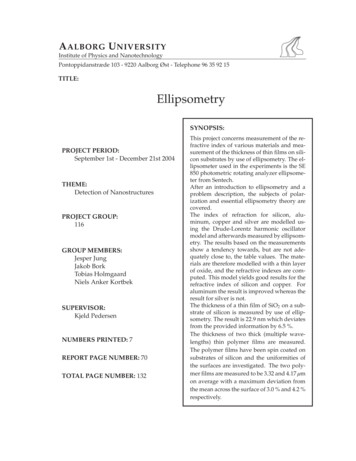
where Po (Pe) is the light power transmitted for light polarized along the ordinary(extraordinary) direction. The quantities S and C are given byS (1 – N2) sin (δ),(6c)C (1 – N2) cos (δ),(6d)where δ is the sample retardation, given byδ 2πd nλ,(6e)where d is the thickness of the sample, λ is the wavelength of light and n no - ne is therefractive index difference between the ordinary and extraordinary rays. Finally, thedirection of the principal axis φ and Cs cos (φ); Ss sin (φ). As can be seen bycomparing Eq. 6a with Eq. 3, the 2-MGE is capable of determining all the relevantparameters for a linear retarder and diattenuator with a single measurement.3.Examples: 2-MGE in reflection3.1Measurement of Optical Functions of Rutile and Anatase (TiO2)One of the most useful applications of the 2-MGE technique is to determine theoptical functions of crystalline uniaxial materials.9-13 Figure 1 shows the raw dataexpressed in terms of the ρ representation for a rutile crystal oriented such that the opticaxis was in the plane of the sample, at 45 with respect to the plane of incidence. Similardata is obtained when the optic axis is pointed at -45 with respect to the plane ofincidence, but where the signs of the sp and ps components are changed. This data can
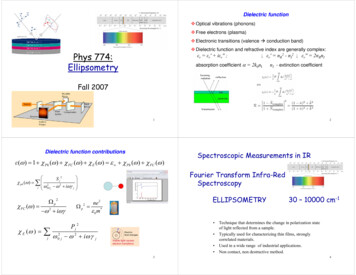
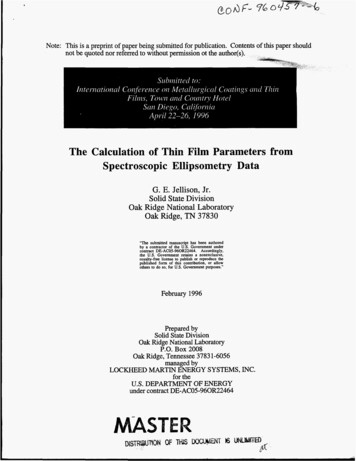
be converted to the optical functions of the material,9 shown as the complex refractiveindex (n ik) in Figure 2. When the crystal is transparent, the values of the refractiveindex are not quite as accurate as the values that can be obtained using minimumdeviation methods. However, the values of the complex refractive index in the opaqueregion are far more accurate than any other technique.The optical functions of another crystalline form of TiO2 (anatase) can also bedetermined using the 2-MGE, and are also shown in Figure 2. The anatase crystal hasquite a different crystal structure, and naturally cleaves such that the optic axis is not inthe plane of the sample, but rather makes an angle of 68.3 with the sample surfacenormal, which can be taken into account in the analysis.13 Clearly, the complexrefractive indices of anatase and rutile are quite different. Below the band edge, rutilehas a higher refractive index, as well as a greater value of birefringence, than doesanatase. Above the band edge, two critical points are observable in the spectra ofanatase, while rutile exhibits one peak.3.2Measurement of the optical functions of ZnOAnother interesting uniaxial crystalline material is ZnO, which has the wurtzitecrystal structure, making it optically uniaxial. However, the structure of ZnO is verynearly zincblende, which is cubic with isotropic optical properties. Therefore, one wouldexpect there to be a small but measurable birefringence, which is shown in Figure 2,expressed in terms of the complex dielectric function (ε ε1 i ε2 (n i k)2 ).10Two main features are observable in ε1 and ε2 near the direct band edge, and the ε1e,ε2e spectra are nearly the same shape as the ε1o, ε2o spectra --- only shifted up in energy
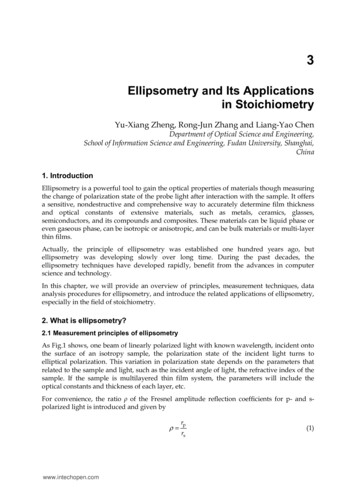
and up in magnitude. The two features can be identified as the n 1 and n 2 excitonsassociated with a critical point in the joint density of states related to the one-electronband structure. The complex dielectric functions in this region have been successfully fitby Djurisic et. al.143.3Diffractive StructuresStructures that show considerable diffraction, such as diffraction gratings can alsoshow strong cross polarization effects. Figure 4 shows experimental 2-MGE data for aruled diffraction grating blazed to be most efficient at 500 nm. The spectrum dependssignificantly on the direction of the grating vector, which is the vector perpendicular tothe direction of the grooves, but there also is significant symmetry. If the grating vectoris at 0 , then there is no cross polarization. However, if the grating vector is placed at 90 ,then there is significant cross polarization, contrary to what one would expect foroptically uniaxial crystals. Similarly, there is significant symmetry between 45 , asnoted in Figure 4.4.Examples: 2-MGE in transmissionClearly, the 2-MGE can also be configured in the transmission mode, where similarparameters are measured, but the meaning is quite different. In our system, two differenttypes of measurements can be performed:7 First of all, the output from the secondpolarizer photoelastic modulator pair can be connected to a monochromator, therebyallowing spectroscopic measurements to be made. Secondly, a filter can be used to selecta small range of wavelengths, and a lens attached to a x-y stage can be placed such that asmall portion of the sample is imaged onto an optical fiber connected to the
photomultiplier detector. By moving the x-y stage, different portions of the sample canbe imaged onto the end of the fiber, thereby allowing x-y maps of the sample to be made,although the map is now of parameters such as retardation, diattenuation, and thedirection of the principal axis.4.1PolaroidFigure 5 shows the diattenuation N, as well as the parameters S, and C of a Polaroidpolarizing film, while the resulting retardation and the direction of the principal axis isshown in Fig. 6.7 An ideal polarizer will have N -1, S C 0. According to the data inFig. 5, the Polaroid film is a very good polarizer from 520-720 nm, but deviatessignificantly from ideality both in the blue and the red parts of the spectrum. Althoughthe diattenuation remains very close to –1 in the blue and the ultraviolet, there is asignificant amount of retardation (as indicated by the increased magnitude of S and C).Very little light below 325 nm passes through the Polaroid material.The effects in the red part of the spectrum are particularly dramatic: the magnitude ofthe diattenuation rapidly drops off, while S and C become more important. While thePolaroid is a very good polarizer at 720 nm, at 850 nm, the Polaroid is more of a retarderthan a polarizer. This is quite reasonable, since the matrix material of a Polaroid(polyvinyl alcohol) is often used as a retarder. The amount of retardation (shown in Fig.5) will depend upon the thickness of the Polaroid, as well as other intrinsic properties ofthe material. No retardation data is shown between 500 and 720 nm, since both S and Care small making the retardation measurements very inaccurate.
4.2Lithium Niobate (LiNbO3) Under Bias15If a material with a linear or Pockels electro-optic effect is placed in an electric field,then the material may become birefringent. This birefringence is proportional to theapplied internal electric field, so the measurement of the electric field-inducedbirefringence is a direct way to measure internal electric fields. This is critical for severalmaterials that operate under electric field, such as LiNbO3, which is used primarily in theelectro-optic industry for optical modulators. LiNbO3 has trigonal symmetry with 3mpoint group, and is known for an extremely large Pockels effect when the electric field isapplied along the z-axis. However, an electric field applied along the x- or y-axes willalso induce a birefringence.Figure 7 shows an x-y map of the retardation and direction of the principal axis of aLiNbO3 crystal,15 where the light beam propagates along the z-axis and the electric fieldis applied along the x-axis. Two sets of x-y maps were obtained. In the first set, labeledAC in Fig. 7, the applied voltage alternated between the positive and negative voltages,staying at the applied voltage for 0.8 sec. During this time, the 2-MGE measured theretardation and the direction of fast axis, as well as the other parameters. After the otherpolarity was measured, the lens was moved to obtain similar data at the next x-y point.The second set of measurements, labeled DC in Fig. 7, were taken at a constant biasvoltage, and the measurements were not initiated until the sample sat at bias for 10 min.As can be seen from this plot, the average δ of the AC measurements is considerablyless than for the DC case, and the distribution of δ for the AC case is considerablysmoother (smaller standard deviation) than it is for the DC case. For the DC
measurements, there is a build-up of retardation near each contact that is absent in the ACmeasurements; furthermore, the build-up of retardation on the ground contact for thepositive DC measurement is greater, while the negative DC measurement concentratesthe retardation on the negative voltage contact. The value of φ is 138 for positivevoltages, and 45 for negative voltages. This value of φ does not depend appreciablyon whether or not the voltage is ac or dc, but the dc voltage results in a much smallerdistribution of φ.A series of time-resolved measurements were performed to examine the timeevolution of the retardation and fast axis angle with time. There were at least twocomponents: one or more with a time constant less than our system resolution ( 50 ms),and one with a much longer time constant. Figure 8 shows time-resolved measurementsof δ and φ taken near the center of the plots of Fig. 7, with a time resolution of 0.4 sec.After the positive voltage is applied, the retardation increases immediately to 0.153, andthen to 0.254 with a time constant of 122 sec. After the voltage is reduced to 0(grounded), the retardation decreases immediately to 0.113 rad., decaying to its nominalstarting value with a time constant of 119.5 sec. Furthermore, the fast axis goesimmediately to 138 upon application of the voltage, and changes very little with time.However, when the contacts are grounded, there is an immediate jump to φ 142 , andthen a very slow decay in φ to it’s nominal, unbiased value. (Note that the error in φincreases considerably with decreasing retardation.)
4.3Cadmium Zinc Telluride (CZT) Under Bias16Another material with considerable potential technological application is cadmiumzinc telluride (CZT), which is a used for room temperature gamma ray detectors. Inorder to make a good room temperature gamma detector, it is critical to have the electricfield penetrate throughout the entire material. However, most experimentaldeterminations of this are measurements of voltages, which are integrals over the internalelectric field. Similar to the case of lithium niobate discussed above, the electric fieldinduced birefringence can be used to determine the internal electric field in CZT.The capabilities of the 2-MGE measurement system can be seen in Figure 9, whereseveral x-y maps are shown for a CZT crystal at 0 bias (top), and at 800 V (bottom).16In this figure, the ground electrode is at the top edge of the color and the blackbackground interface, and the voltage electrode (either positive or negative) is at thebottom black to color changeover. The x-y maps of 5 different quantities are shown inthis figure, all on a linear scale, where the scale is defined at the bottom of the figure.The scales for both measurements are the same, with the exception of the retardation,which is 0-1.2 radians for the 800 V plot, and 0-0.11 radians for the unbiased plot.As can be seen in Figure 9, the intensity (averaged over the time and expressed inarbitrary units) varies considerably over the x-y map. This variation could come from anumber of sources, such as variations in the light intensity from the source itself,variations in the absorption coefficient of the CZT material, or from variations in thesurface quality of the CZT crystal. Fortunately, these variations in intensity do not affectthe 2-MGE measurements, as long as sufficient light reaches the detector to give
adequate signal-to-noise. The retardation of the unbiased CZT crystal is small but nonzero, and does depend somewhat on the position within the crystal. The direction of thefast axis is 90 , and does not depend significantly on x-y position. The diattenuation Nalso is very small, and the polarization factor β is nearly 1 over most of the x-y plot,except near the voltage contact where it is somewhat low (β 0.90 0.95). This indicatesthat the sample does not significantly depolarize the light beam, except in the region nearthe voltage contact.In contrast, the sample under 800 V bias exhibits a strong retardation near thepositive electrode (bottom). Moreover, the direction of the fast axis in the region of nonzero retardation approaches 133 , and there is a small but discernable change in thediattenuation. At the edge near the positive voltage electrode, the diattenuation becomesquite large, and there is a clear feature unobservable in any other parameter, possiblyindicating a defect in the crystal emanating from this contact (This feature is alsoobservable for lesser positive voltages, although the magnitude of the diattenuationchange is somewhat less.). As with the 0-bias case, the polarization factor β is nearly 1over the most of the x-y mapped region; however, there is a region of decreased β nearthe positive electrode, which is larger than the similar region for the unbiasedmeasurement. This indicates that light passing near the electrode is partially depolarizedin both measurements, but the amount of depolarization is slightly greater for the biasedmeasurement compared to the unbiased measurement. There is very little if anydifference in the intensity map between the 800V and 0V bias experiments, showingthat the application of the voltage does not affect the intensity.
5.SummaryIn this paper, we have shown that generalized ellipsometry as implemented using thetwo-modulator generalized ellipsometer (2-MGE) can be applied to a class of problemsinaccessible to standard ellipsometry. The 2-MGE is capable of measuring 8 of the 15elements of the reduced sample Mueller matrix, which is sufficient for a wide range ofapplications. Although the 2-MGE can be operated in either the reflection or thetransmission modes, the resultant information requires a different interpretationdepending upon the mode.In reflection, the 2-MGE measures the standard ellipsometry parameters, as well asthe cross-polarization terms and the depolarization. For single crystal samples, this datacan then be used to determine the complex optical functions of the material for both theordinary and extraordinary directions in the crystal. In the transparent region of thecrystal (below the band gap), the information obtained agrees with more accurateminimum deviation methods, but the technique is unsurpassed for the determination ofoptical functions in the opaque region of the crystal. Several crystals have beenmeasured in this way, and here we have shown the results from two crystal forms of TiO2(rutile and anatase) and ZnO. We have also shown that diffractive structures showconsiderable optical anisotropy when examined using generalized ellipsometry.The 2-MGE can also be operated in transmission, but the interpretation of themeasured parameters is considerably different from reflection measurements. Intransmission, the 2-MGE measures sample retardation, diattenuation, circulardiattenuation, direction of the principal axis, and the polarization factor. Our instrument
can be configured in two modes: spectroscopic, where the parameters are determined as afunction of wavelength, and spatially resolved, where the parameters are determined as afunction of position within the crystal. Spectroscopic measurements of a Polaroidrevealed that the Polaroid is indeed a good polarizer in the visible, it becomes more of aretarder in the near infrared. Spatially resolved measurements of LiNbO3 and CZTrevealed that the 2-MGE is capable of measuring the electric field-induced birefringenceassociated with a penetrating electric field. However, this effect is complicated by thefact that these materials are not simple, and atomic drifting may alter not just the internalelectric field, but also the Pockels coefficient.6.AcknowledgementsThe author is indebted to several of his co-workers for their assistance with this work,including C. M. Rouleau, D. E. Holcomb, L. A. Boatner, J. P. Hunn, all of Oak RidgeNational Laboratory, A. Burger of Fisk University, and C. O. Griffiths of HindsInstruments. Research sponsored by the U. S. Department of Energy under contract DEAC05-00OR22725 with the Oak Ridge National Laboratory, managed by UT-Battelle,LLC.
References1. G. E. Jellison, Jr., Thin Solid Films 313-314, 33-39 (1998).2. G. E. Jellison, Jr. and F. A. Modine, Appl. Opt. 36, 8184-8189 (1997); ibid, Appl.Opt. 36, 8190-8198 (1997); ibid Appl. Opt. xx, xxxx-xxxx (2003).3. M. Schubert, B. Rheinlander, J. A. Woollam, B. Johs, and C. M. Herzinger, J. Opt.Soc. Am. A13, 875 (1996).4. M. Schubert, Thin Solid Films, 313-314, 323-332 (1998).5. H. Yao, J. C. Erikson, L. A. Lam, and R. B. James, Thin Solid Films, 313-314, 351355 (1998).6. R. W. Collins, J. Koh, J. Opt. Soc. Am., A16, 1997 (1999).7. G. E. Jellison, Jr., C. O. Griffiths, D. E. Holcomb, and C. M. Rouleau, Appl. Opt. 41,6555-6566 (2002).8. C. Brosseau, Fundamentals of Polarized Light: a Statistical Optics Approach, (Wiley,New York, 1998).9. G. E. Jellison, Jr., F. A. Modine, and L. A. Boatner, Opt. Lett 22, 1808-1810 (1997).10. G. E. Jellison, Jr. and L. A. Boatner, Phys. Rev. B 58, 3586-3589 (1998).11. G. E. Jellison, Jr., J. O. Ramey, and L. A. Boatner, Phys. Rev. B 59, 9718-9721(1999).12. G. E. Jellison, Jr., L. A. Boatner, and C. Chen, Optical Materials 15, 103-109 (2000).13. G. E. Jellison, Jr., L. A. Boatner, J. D. Budai, B. S. Jeong, and D. P. Norton, J. Appl.Phys. 93, 9537-9542 (2003).14. A. B. Djurisic, Y. Chan, and E. H. Li, Appl. Phys. A. 76, 37 (2003).15. G. E. Jellison, Jr., C. O. Griffiths, and D. E. Holcomb, Appl. Phys. Lett. 81, 12221224 (2002)16. G. E. Jellison, Jr., D. E. Holcomb, C. O. Griffiths, M. Grozas, A. Burger, L. Li, and F.Yu, J. Elect. Mat. XXX, xxx-xxx (2003). Accepted for publication.
Figure 1. The spectroscopic values of ρ determined using 2-MGE for Rutile where thedirection of the optical axis was in the plane of the sample, oriented at 45 with respect tothe plane of incidence
Figure 2. The spectroscopic values of the ordinary (o) and extraordinary (e) refractiveindex n and the extinction coefficient k for rutile and anatase. The values of n and k weredetermined from the data shown in Figure 1 for rutile, while the original data for anataseis not shown.
Figure 3. The spectroscopic values of the complex dielectric function for ZnO near thedirect transition.
Figure 4. The spectroscopic values of the complex ρ as measured from a replica ruleddiffraction grating blased for optimum performance at 500 nm. The angle listed is thegrating vector, which is perpendicular to the grooves.
Figure 5 The spectroscopic values of N, S, and C for transmission through a Polaroid.
Figure 6. The calculated values of the retardation and the direction of the principal axisversus the wavelength, determined from the data shown in Figure 1.
Figure 7. An x-y color plot of the retardation δ and fast axis angle φ as a function ofapplied voltage. The retardation scale (min to max) is 0-0.4 rad, while the Fast axis anglerange is 25 -55 for negative voltages and 125 -160 for positive voltages. Thehorizontal (x) dimension is 1.27 mm (41 pixels) and the vertical (y) dimension is 2.45mm (79 pixels). The AC measurements were made by alternating between the positiveand negative values, dwelling at each voltage for 0.8 sec. The DC measurements weremade by putting the sample at voltage for 10 min before beginning measurements.
Figure 8. A plot of the retardation and fast axis angle as a function of time at a singlepoint near the center of the field shown in Fig.7.
Figure 9. x-y maps of several parameters of a CZT sample unbiased (top) and under 800 V bias (bottom). The ground electrode is at the top black-color interface of eachfigure, while the bias contact is at the bottom to black-color interface. The color scale isdefined at the right, where the maximum and minimum values are given at the bottom ofthe figure. The color scales for the intensity, N, φ, and β are the same for both biases, butare different for the retardation δ
where rp (rs) is the complex reflection ratio for light polarized parallel (perpendicular) to the plane of incidence. The angles ψ and are the traditional ellipsometry parameters, and are the naturally measured quantities in a nulling ellipsometry measurement. Modern spectrosc